Poverty and food insecurity are interrelated challenges for many individuals and families in New Hampshire. Research suggests a strong relationship between poverty and food insecurity, both of which rose following the Great Recession of 2007-2009 nationally and in New Hampshire. The COVID-19 pandemic also significantly increased the risk that more people would face poverty and food insecurity. However, the federal policy response to the COVID-19 pandemic has reduced poverty and food insecurity, nationwide and in the Granite State. Early data suggests the expiration of key policies in response to the pandemic has led to a rebound in both of these hardships.
While useful for historical comparisons, the traditional measure of poverty has substantive shortcomings, due in part to changes in the relative magnitude of the costs households face since the metric was established in the 1960s. Despite the measure’s limitations, measuring poverty in this manner does provide some insight into the well-being of Granite Staters with the fewest financial resources. Individuals who do not work have substantially higher poverty rates, as do individuals with disabilities, who comprise approximately 30 percent of the population in poverty in New Hampshire; those disabilities likely prevent many Granite Staters in poverty from working. Additionally, single parents, particularly single women caring for related children, also have much higher poverty rates. These households in poverty likely face significant hardships, and potential food insecurity with long-term consequences for their children.
Structural barriers to success continue to impact key groups of Granite Staters, including Black and Hispanic residents, who face poverty rates about twice as high as the statewide figures.
Estimates of the cost of living are far above official poverty thresholds in every New Hampshire county. Individuals and families who are living with the very low income levels represented by the poverty thresholds are likely forgoing many goods and services, such as food, that other households consider necessary parts of their budgets. Food insecurity is associated with poorer adult and child health, mental health disorders, higher probability of common chronic diseases, and, among children, problems with language development, school performance, social interactions, and lower physical growth potential.
Both overall poverty and food insecurity declined in New Hampshire before and during the pandemic, but data suggest food insecurity rates remain high in some communities, including in cities and towns where enrollment in food assistance programs represents a significant portion of the population.
This Issue Brief seeks to understand poverty and food insecurity in New Hampshire using recently released population-level data and historical comparisons. It explores the geographic prevalence of poverty and food insecurity both within the state and between states, and seeks to understand supplemental methods of measuring poverty and food insecurity as well as the interconnection between the two hardships.
Poverty in New Hampshire and Alternative Measures of Hardship
Poverty measures income relative to certain living costs defined by the federal government. The original definition, developed by economist Mollie Orshansky at the Social Security Administration in the 1960s, relied on survey data from 1955 that showed families of three or more people spent about one-third of their post-tax income on food. Orshansky used the estimated costs for purchasing the food comprising the U.S. Department of Agriculture’s “Economy Food Plan,” the least expensive of the food plan estimates developed by the federal government at that time; this plan was based on recommended dietary allowances and for temporary or emergency use in a period of constrained resources. That amount, for a family of three, was multiplied by three to develop the poverty threshold, with families below that income level living in poverty. The multiplication factor varies for different household compositions, but this measure, with adjustments for food costs over time, provides the fundamental framework for defining poverty under the federal government’s Official Poverty Measure (OPM) today. The OPM is only a measure of income, rather than assets, debt, or the physical, mental, or social impacts of poverty.1
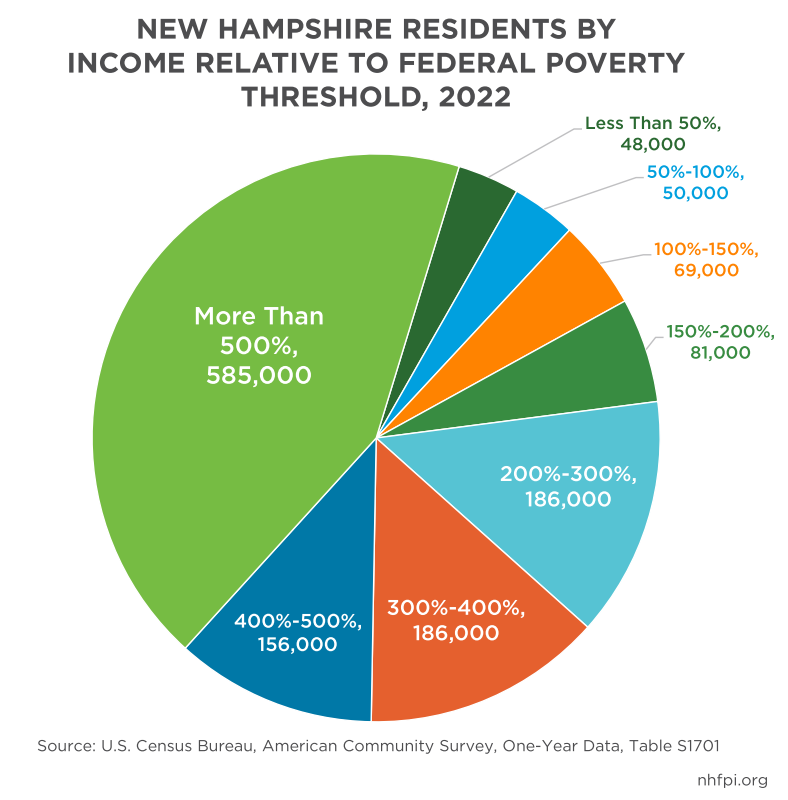
Based on this measure, the U.S. Census Bureau establishes poverty thresholds, which are the annual incomes of households of varying sizes, below which the household is considered living in poverty. The poverty threshold throughout the contiguous 48 states in 2022 was $15,225 annually for an individual less than 65 years old, $23,556 for a family of three with one child, and $29,678 for a family of four with two children.2 Cumulatively in 2022, according to the most recently-published U.S. Census Bureau data, about 98,000 Granite Staters lived in poverty; this group was slightly larger than the estimated 2022 populations of Claremont, Concord, Laconia, and Portsmouth combined. Approximately 48,000 people lived at less than half of poverty-level income, while an estimated 247,000 people, nearly one in five residents, lived with less than twice poverty-level incomes. The overall poverty rate in New Hampshire was 7.2 percent, based on data collected from households in 2022.3
Other Measures of Financial Hardship
The OPM is not the only estimate of financial hardship that can be applied to New Hampshire. Other estimates of living costs, including surveys and measures designed to capture more dimensions of severe financial constraints beyond the OPM’s food cost-based measure, provide additional insights into economic struggles in the Granite State.
Alongside the OPM, the U.S. Census Bureau also publishes the Supplemental Poverty Measure (SPM). The OPM measures gross pre-tax income relative to the federal government’s lowest-cost food plan, but only uses that plan and the adjustments in costs in that food plan to calculate new poverty thresholds annually. The SPM uses ongoing survey data to estimate expenditure costs for food, clothing, utilities, and housing costs. The SPM includes regional variation in housing costs, but not geographic changes in other costs. The SPM also includes the effects of taxes and tax credits, nutrition and energy assistance, work and medical expenditures, child support payments, and child care costs. The SPM is a much newer measure, with data calculated back only to 2009, while the OPM has been estimated for each year since 1959.4
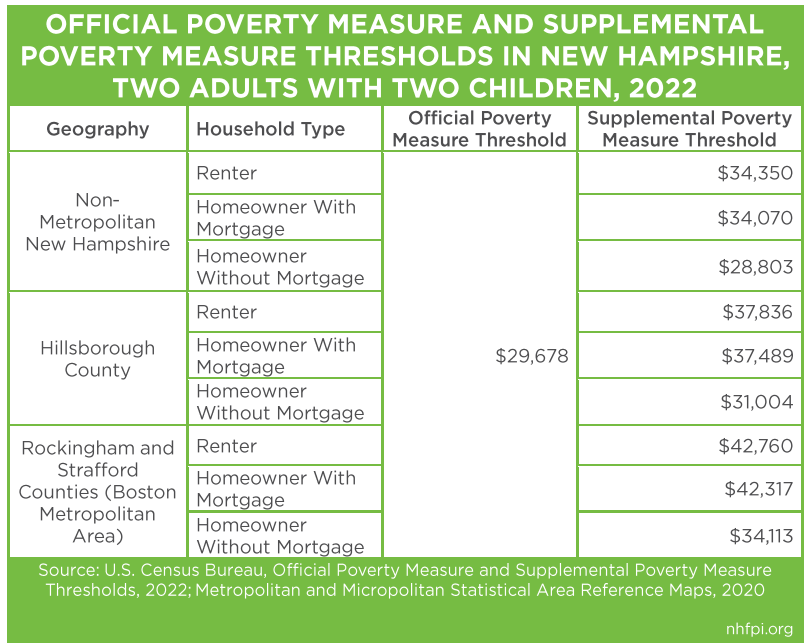
Unlike the OPM, the SPM poverty calculation includes regional variations in housing costs, and these variations are calculated for groups of counties within or outside of metropolitan areas. In 2022, the SPM poverty threshold was $28,803 per year for a household with two adults and two children in rural New Hampshire (defined as outside of Rockingham, Hillsborough, and Strafford counties) living in a house they own without a mortgage. For the same family renting their home in Hillsborough County, the SPM poverty threshold was $37,836 in 2022.5 In New Hampshire, the SPM poverty rate is typically higher than the OPM rate, likely reflecting relatively high housing costs.6
For example, while New Hampshire’s OPM has been the lowest of any state in the country in recent years, the SPM poverty rate in New Hampshire is not consistently lower than all other states. For the 2020-2022 period, New Hampshire’s SPM poverty rate was 6.2 percent, which was lower than the pre-pandemic years and likely reflected the benefits provided to households through the tax code. However, that SPM poverty rate was higher than Maine’s 4.6 percent even after accounting for statistical uncertainty in the data. Seven other states had lower estimated SPM poverty rates than New Hampshire, but those differences were not statistically significant, indicating the poverty rates were indistinguishable from one another.7
Published single-year estimates of the SPM use other survey data and modeling to produce estimates by state. These estimates show New Hampshire’s 6.0 percent 2021 SPM poverty rate was statistically indistinguishable from five other states. Estimates for 2020 are not available due to data limitations associated with the COVID-19 pandemic, and 2022 estimates have not yet been published for this secondary U.S. Census Bureau product. In 2019, an estimated 28,000 more people were in poverty under the SPM measure than were using the comparable OPM in New Hampshire; in 2021, 13,000 fewer people were in poverty in New Hampshire using the SPM measure than the OPM, and the estimated SPM poverty rate dropped from 9.5 percent in 2019 to 6.0 percent in 2021. As with the national data, the expanded Child Tax Credit for 2021 was likely key to this change; in 2019, an estimated 21,000 children (8.2 percent) were in SPM poverty, whereas the figure dropped to an estimated 10,000 Granite Staters under 18 years old (4.0 percent) in 2021. Adults aged 18 to 64, including the parents of children, saw the SPM poverty rate drop from 9.6 percent to 5.6 percent between these two years.8
Significant federal assistance to households through legislation related to the COVID-19 pandemic was provided through tax credits. As a result of that design, key assistance was reflected in the SPM but not the pre-tax OPM. Single-year SPM estimates for New Hampshire are not available for 2020 or 2022, but national data show reduced SPM poverty rates resulting from the Economic Impact Payments, also known as one-time “stimulus checks,” in 2020 and 2021, as well as the expanded tax credits in effect for the 2021 tax year, including the Child Tax Credit, the Earned Income Tax Credit, and the Child and Dependent Care Tax Credit. The SPM poverty rate dropped substantially in 2020 and 2021, despite the economic conditions associated with the pandemic, and rose substantially after the expiration of these tax credits in 2022. Between 2021 and 2022, however, the national SPM poverty rate increased from 7.8 percent to 12.4 percent, or 4.6 percentage points (a 59 percent increase), due largely to the expiration of the one-time tax credits and to contemporaneous price increases, including for housing and energy. For children, whose households were the direct beneficiaries of the enhanced Child Tax Credit payments, SPM poverty rose from 5.2 percent to 12.4 percent, or a 7.2 percentage point (138 percent) increase during this period, showing the impacts of removing key supports previously provided through the tax code.9
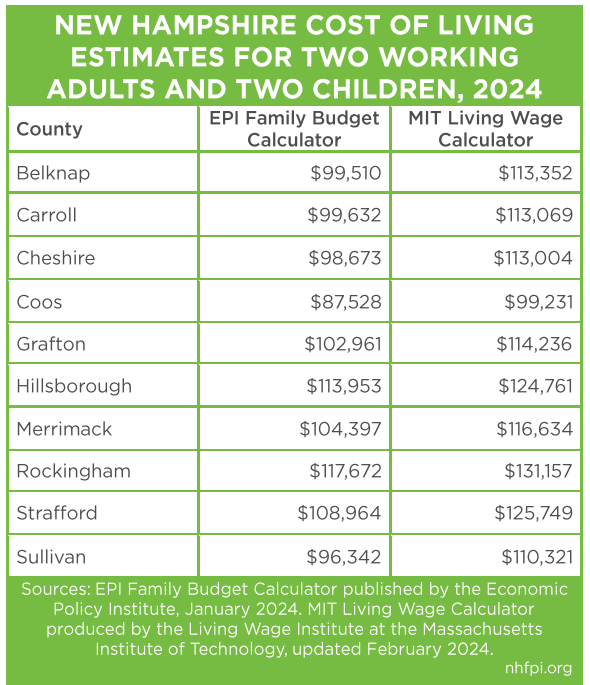
Other measures do not specifically seek to define poverty but provide an understanding of the cost of living. Two key measures are the Massachusetts Institute of Technology’s Living Wage Calculator and the Economic Policy Institute’s Family Budget Calculator. Updated periodically, these two tools estimate the cost of living at the county level around the nation, and the Living Wage Calculator also includes a statewide estimate. Both include estimates for the costs of food, child care, housing, medical expenses, transportation, taxes, and other costs in household budgets, but do not include certain key expenses that many households incur, such as higher education costs. These calculators use different methodologies to estimate key expenses, although some similarities in methodologies or data sources exist. The most recent estimates from the Living Wage Calculator suggest a household with two working adults and one child would have to earn $97,876 to meet expenses in New Hampshire, while two working adults with two children would need $122,072.10 For Rockingham County, estimated to be the most expensive county in the state to live in, the Economic Policy Institute estimates a household with two adults and one child would need $94,597 to cover these expenses, and a two-adult, two-child household would need $117,672; in Coos County, the least expensive county in the state for living costs, the annual income needed for a two-adult, one-child household was estimated to be $72,501, and $87,528 for the same household with two children.11
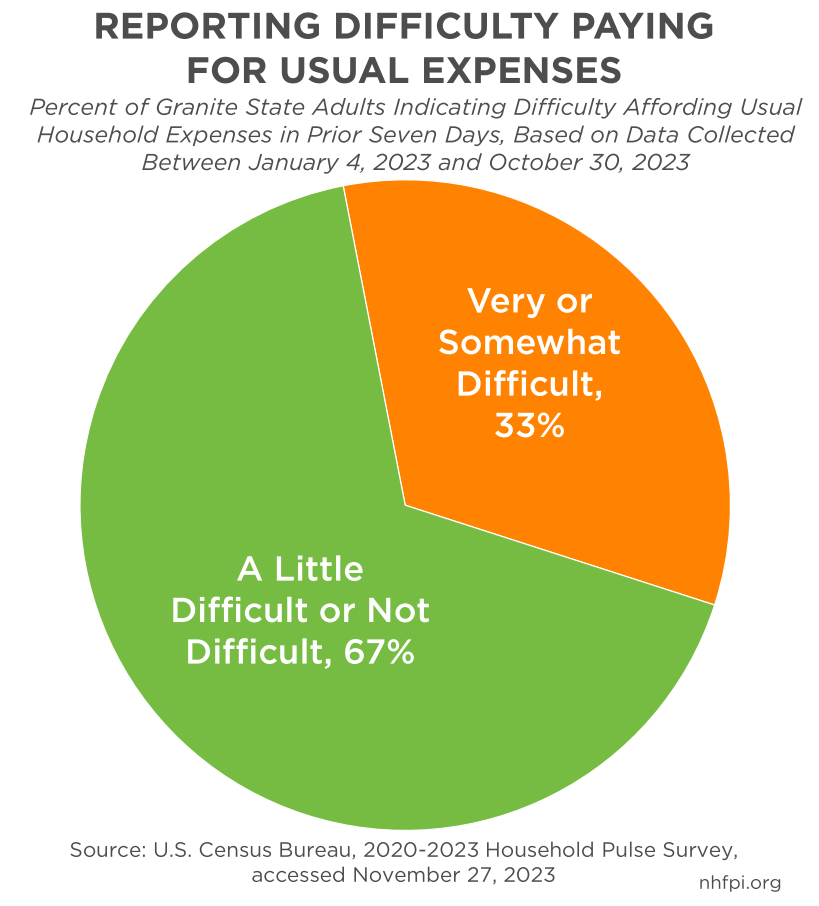
In response to the fast-changing health and economic environment following the beginning of the COVID-19 pandemic, the U.S. Census Bureau created the Household Pulse Survey. This online-based survey of U.S. adults seeks to collect information from a small, representative sample of the population from each state on a regular basis. Recent collections have occurred approximately monthly, and questions have changed over time to adapt to the evolving circumstances around the COVID-19 pandemic.12 While the small sample sizes can be subject to considerable uncertainty, collection over extended periods provides significant insight into the well-being of households. One key question, which has been administered in each survey since August 2020, asks how difficult affording usual household expenses has been over the last seven days, and notes those usual expenses include but are not limited to food, rent or mortgage, car or student loan payments, and medical expenses. In surveys covering the time period of early January 2023 to late October 2023, one in every three New Hampshire adults reported it was either somewhat or very difficult to afford usual household expenses in the prior seven days.13
Poverty by Group
Certain groups are disproportionately more likely to face poverty in New Hampshire, likely due in significant part to structural barriers to success.14 Data averaged over a five-year period, from 2018 to 2022, allow for a more granular examination of OPM poverty in New Hampshire, and provide more insight into the characteristics of the nearly 100,000 Granite Staters in poverty.
For example, the estimated poverty rate for the population overall was 7.3 percent in the 2018 to 2022 period. However, the poverty rate was substantially higher for individuals with some form of disability (16.2 percent), while those without any disability had a lower poverty rate (5.8 percent). About 30 percent of all people in poverty (the 7.3 percent of the total population) were identified by their survey responses as having a disability.15 Disabilities identified by the U.S. Census Bureau include difficulties with hearing, vision, cognition, ambulation, self-care, and independent living functions.16
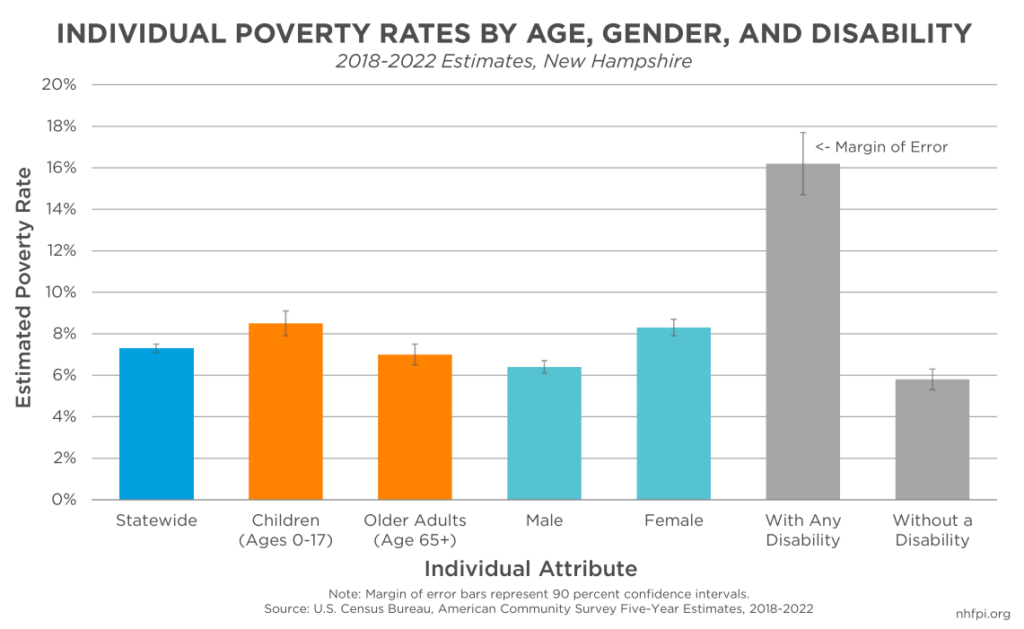
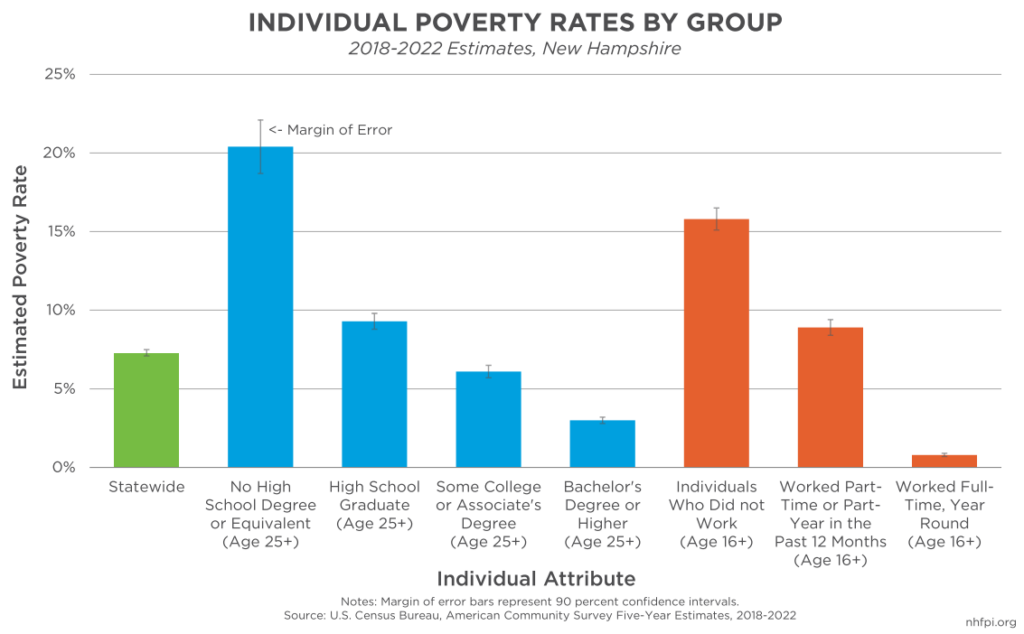
All these types of disabilities could be substantial barriers to employment, limiting the income associated with work. Individuals older than 16 years who did not work accounted for about 52 percent of all individuals in poverty during the 2018 to 2022 period. While the data do not identify the reasons for these individuals not working, if all the Granite Staters with a disability and in poverty were not working, they would comprise about three out of every five individuals not working and in poverty. Individuals 16 years or older who were engaged in full-time, year-round work had a poverty rate of less than one percent, while Granite Staters age 16 and over who worked part-time or for only part of the year, such as seasonal workers, faced a poverty rate of 8.9 percent, higher than the statewide rate. Non-working individuals over age 16 had a poverty rate of 15.8 percent.
Access to education may also be a barrier to success. While the poverty rate for individuals age 25 years and older with a bachelor’s degree or higher was 3.0 percent, Granite Staters age 25 and up with an associate’s degree or with some college but no degree had a poverty rate that was about twice as high, at 6.1 percent. However, both those estimates were lower than the poverty rate for the population overall. About 27.2 percent of New Hampshire’s population age 25 years and older had a high school degree or the equivalent, but no additional years of formal education; the poverty rate for these Granite Staters was 9.3 percent, above the statewide estimate of 6.6 percent for the population age 25 years and older during the 2018 to 2022 time period. For the approximately 6.2 percent of Granite Staters in this age group who did not have at least a high school degree or the equivalent, the poverty rate was 20.4 percent.17
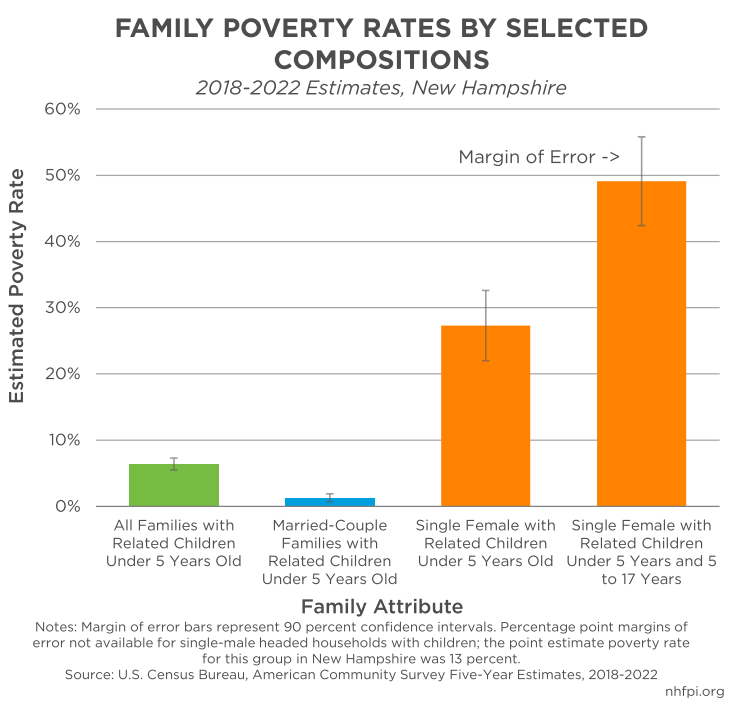
Data also suggest that certain family structures may create barriers to financial success or workforce engagement. A single parent may be less able to work full time, particularly considering access to child care in New Hampshire can be both limited and expensive.18 Using family structures identified by the U.S. Census Bureau’s survey questionnaires, married-couple families in New Hampshire with at least one related child under five years old faced a poverty rate of approximately 1.3 percent, while about one in every four Granite State families with a single-female headed householder and at least one related child under five years old were in poverty. The estimated poverty rates for single-male headed households with no spouse and at least one child was about 13 percent. For single-female headed households with at least two children, one under age five and the other between the ages of five and 17 years, the poverty rate was estimated to be approximately 49 percent.19
Households in New Hampshire that owned their homes were also substantially more likely to have incomes higher than the poverty thresholds. While homeowner families faced a poverty rate of about 2.6 percent in the 2018 to 2022 period, renter households faced a poverty rate nearly five times that of homeowners, at an estimated 12.7 percent. Single female-headed households again faced higher poverty rates than married couples, and renters in these groups faced higher poverty rates than their homeowner peers; about one in every eight single male households that rented were in poverty, while one in every four single female households were.20
Overall, both women and children faced higher poverty rates than men and older adults. The female poverty rate was 8.3 percent, compared to a male poverty rate of 6.4 percent, during the 2018 to 2022 period in New Hampshire. Granite Staters under 18 years old experienced a poverty rate of 8.5 percent, while adults age 65 years and older had a collective poverty rate of about 7.0 percent.
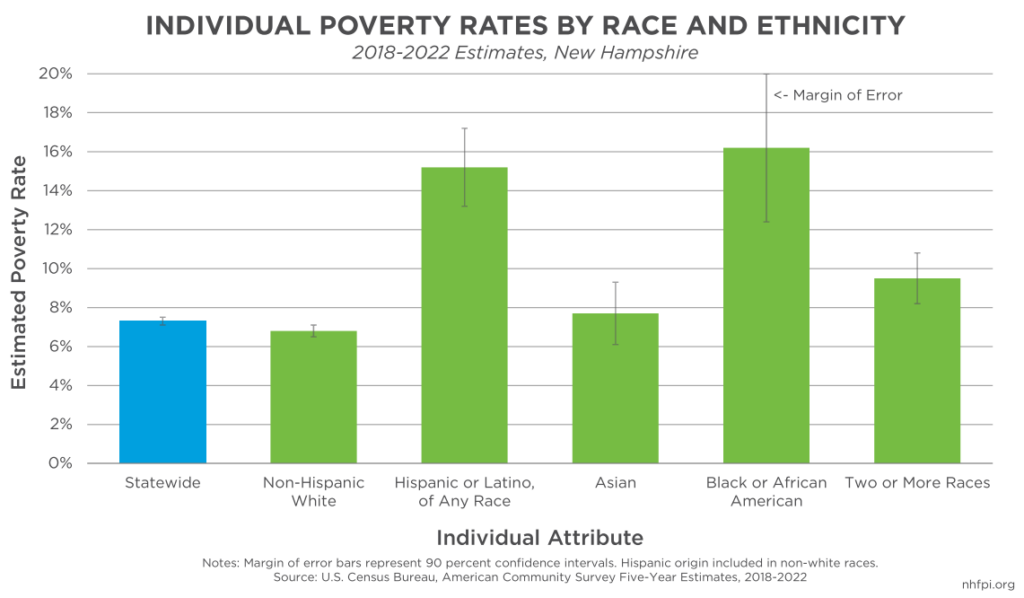
Structural barriers to success associated with race and ethnicity also appeared to continue negatively impacting Granite Staters of color.21 The poverty rate for individuals identifying their ethnicity as Hispanic or Latino, regardless of their race, was about 15.2 percent, which was twice the statewide rate (7.3 percent). Black or African American Granite Staters had a poverty rate of 16.2 percent in the 2018 to 2022 period, more than twice the statewide rate. Individuals identifying as having two or more races also had an elevated poverty rate (9.5 percent), while Asian New Hampshire residents reported a poverty rate (7.7 percent) that was statistically indistinguishable from the statewide estimate of 7.3 percent. The poverty rate for people identifying as white and not Hispanic was also statistically indistinguishable, at 6.8 percent, from the statewide figure. However, non-Hispanic white individuals in poverty comprised 82 percent of all Granite Staters with such low incomes.
For context, the national poverty rates among racial and ethnic groups from 2018 to 2022 had similar relative levels to New Hampshire’s poverty rates, although poverty overall is higher in the national figures. The Black or African American poverty rate nationally was about 2.3 times the non-Hispanic white poverty rate, while the Black or African American poverty rate in New Hampshire was 2.4 times the non-Hispanic white poverty rate. Nationally, the Hispanic or Latino poverty rate was 1.9 times the non-Hispanic white poverty rate, while the ratio in New Hampshire was 2.2 times the non-Hispanic white rate. Nationally, Asian residents had a slightly higher poverty rate (10.1 percent) than non-Hispanic whites (9.2 percent) during this period.
Poverty by County
Poverty rates, measured using the OPM, increased at the county level in northern and western parts of New Hampshire, reflecting the income and economic activity generated by the Boston metropolitan area to New Hampshire’s southeast.22 However, those poverty rates do not necessarily reflect the number of New Hampshire residents in poverty within each part of the state.
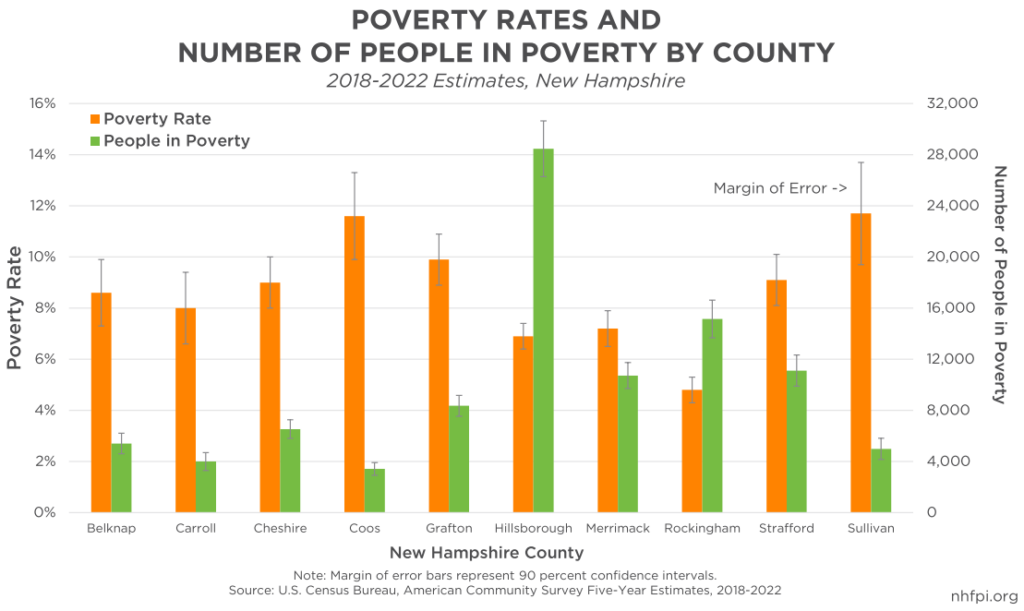
Rockingham County, with an estimated poverty rate of 4.8 percent during the 2018 to 2022 period, was the only county that was statistically distinguishable from all other counties with regard to the poverty rate, as it had the lowest poverty rate in the state. However, this populous, largely suburban and exurban southeastern county had the second-highest number of residents in poverty in the state, with an estimated 15,100 people living in poverty in the county. This number of Granite Staters in poverty was behind only the state’s most populus county, Hillsborough County, with about 28,500 residents in poverty and a poverty rate of 6.9 percent, which was statistically indistinguishable from Merrimack (7.2 percent) and Carroll (8.0 percent) counties, but otherwise a lower rate than every other county except Rockingham.
Rural northern and western counties faced the highest poverty rates. Sullivan (11.7 percent) and Coos (11.6 percent) had the highest estimated poverty rates, although both were statistically indistinguishable from neighboring Grafton County (with a 9.9 percent poverty rate). Coos and Sullivan counties had a combined estimated population in poverty of about 8,400 Granite Staters, but the higher concentrations of poverty suggest that fewer resources and economic opportunities may be available to residents of those rural counties, which have the two lowest overall populations among New Hampshire’s ten counties.
Changes in Poverty Over Time by Group
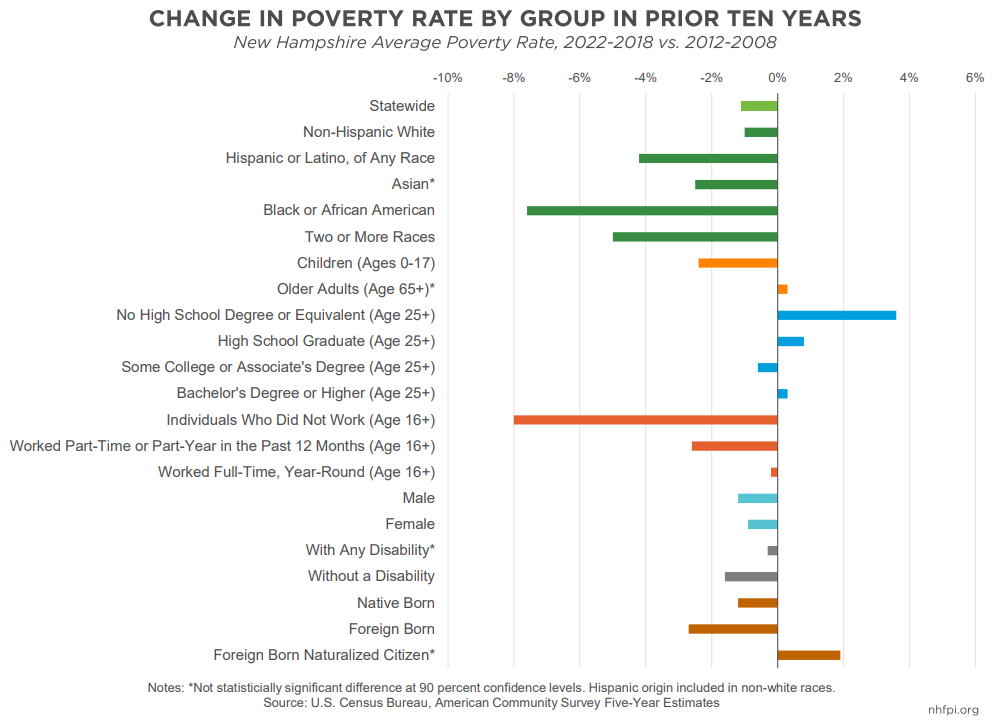
Poverty in the years before and during the COVID-19 crisis has been lower than in the years during and following the Great Recession, but poverty has not declined for all groups. Comparing the five-year average poverty rates for 2018-2022 to the data a decade earlier, during 2008-2012, shows a poverty rate that is 1.1 percentage points lower overall. Poverty rates have declined for individuals identifying as white and non-Hispanic (-1.0 percentage points), Hispanic or Latino and of any race (-4.2 percentage points), as Black or African American (-7.6 percentage points), or as two or more races (-5.0 percentage points). The difference in the poverty rate for Asian Granite Staters is statistically indistinguishable from zero, meaning no clear change has occurred.
While the poverty rate for children declined (-2.4 percentage points) between these two five-year periods, the poverty rate for older adults age 65 years or older remained largely the same. Granite Staters with a disability also saw no clear change in the poverty rate they faced over this ten-year period, while individuals without a disability experienced a decline.
Individuals age 16 and up who did not work also had a substantial decline (-8.0 percentage points) in their poverty rate during this period, which may be due in part to more people entering retirement with incomes counted in the calculations for the poverty rate as well as the declining child poverty rate, both of which would lower the overall poverty rate for non-working individuals age 16 and older; the tax credits are not included in the OPM poverty rates discussed here, so forms of pandemic-related assistance delivered through the tax code would not be counted. Individuals working part time may have seen their poverty rates decline (-2.6 percentage points) because of the labor force constraint in the state pushing up wages, although part-time work was still associated with higher poverty rates than the overall population.23
The poverty rate for individuals aged 25 years or older with bachelor’s degrees or higher edged up (0.3 percentage points), but Granite Staters with an associate’s degree or some college coursework but no degree saw a slight decline (-0.6 percentage points) in the poverty rate between the 2008-2012 and 2018-2022 periods. However, poverty rates rose for individuals age 25 and up with lower levels of formal educational attainment, including Granite Staters with a high school degree or its equivalent only (0.8 percentage points) or less than a high school degree (3.6 percentage points).
Small county populations rendered most county poverty rate changes statistically indistinguishable from having no change. All point estimates moved down except for Sullivan County, which saw an increase, but the change was not statistically significant. Poverty rates dropped in a statistically meaningful manner in Carroll, Cheshire, Hillsborough, Merrimack, and Strafford counties.
Food Insecurity and Other Measures for Lack of Access to Food
Food security at the household level is defined by the United States Department of Agriculture (USDA) as “access at all times to enough food for an active, healthy life for all household members.”24 Not reaching this status is food insecurity, with the severity defined as “food insecure” or “very low food security.” The evaluation of food insecurity, including the severity, is determined by a survey of U.S. households conducted by the U.S. Census Bureau and analyzed by the USDA every year.25
The risk of food insecurity increases when money to purchase food is limited or unavailable, with higher rates of food insecurity among households with lower incomes. Unemployment increases the risk of food insecurity, including among children of unemployed parents. Adults with disabilities may also be at higher risk of food insecurity. Physical access to food, due to a combination of geographic distances to healthy, consistent, and affordable food sources and challenges accessing transportation, may also impact food security.26
Food insecurity is not necessarily a constant status for households. It also does not necessarily cause hunger, which is “discomfort, illness, weakness, or pain caused by an involuntary lack of food.”27 While not as severe as active hunger, food insecurity is associated with poorer adult and child health, poor sleep quality, mental health disorders, higher probability of common chronic diseases, problems with language development in children, school performance and social interactions for children, higher rates of asthma and lower physical growth potential for children, and higher risk of maternal depression and anxiety among mothers.28
Food Insecurity and Poverty
Substantial research identified low incomes as the primary cause of food insecurity. Several studies have also identified that income volatility within a household increases the probability that food insecurity occurs. One study, measuring food insecurity relative to the OPM and the SPM, found a strong relationship between food insecurity among children and both measures of poverty, with an even stronger relationship specifically with SPM.29 While food insecurity exists outside of poverty, the survey questions that are used to determine food insecurity levels focus on the limitations of existing resources to be used for food, in part to prevent other factors that may limit food intake from affecting results. The amount of resources available to households, which may include income or other assets, is potentially the most important factor impacting food insecurity; people in poverty face an extreme case of very limited income, which likely makes affording food, alongside other necessities, particularly difficult. Assets other than income may help households with low incomes remain food secure, and some research suggests households with fewer assets are substantially more likely to be food insecure. Average incomes over a two-year period can be a valuable predictor of food insecurity, as income stability may help households remain food secure, and higher income households may be food insecure due to negative income shocks or high expenses associated with other needs.30
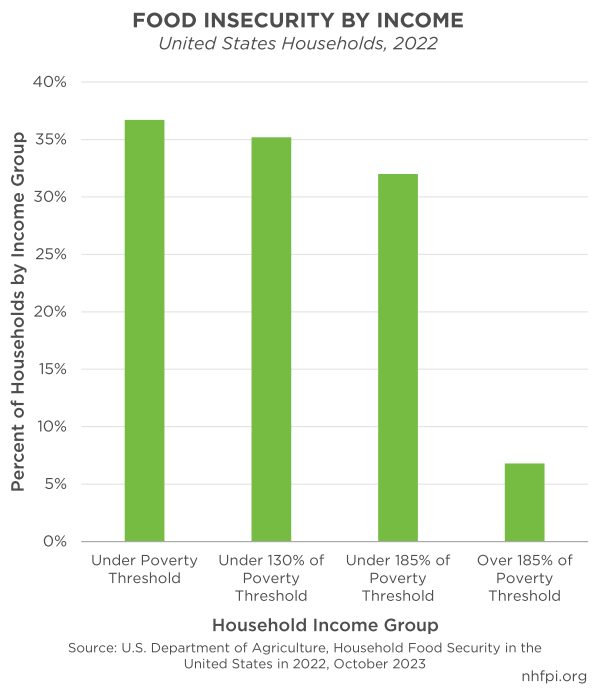
Recent data provides additional evidence for the correlation between lower household incomes and food insecurity. Data from 2020 show that nearly two in five households in poverty nationally were food insecure. Households with lower incomes above the poverty line appear to be only slightly less likely to be food insecure, as about 32.0 percent of all households with incomes below 185 percent of the federal poverty threshold, incorporating households with nearly double poverty-level incomes, were food insecure. Above 185 percent of the federal poverty threshold, the household food insecurity rate fell to 6.8 percent, relative to the 12.8 percent of all households in the United States that were food insecure in 2022.31
Food Insecurity During the COVID-19 Pandemic
The 12.8 percent of U.S. households, or 17.0 million, that were food insecure in 2022 was an increase from the 10.2 percent (13.5 million) in 2021 and 10.5 percent (13.8 million) in 2020. While the Great Recession of 2007-2009 led to a period of elevated food insecurity during most of the 2010s, the COVID-19 recession corresponded with a drop in food insecurity due to federal aid provided to households during the pandemic.32 The substantial assistance provided directly to households alleviated poverty, boosted incomes, and likely removed financial barriers to food security. Federal policy changes also increased food assistance program benefits, including in the Supplemental Nutrition Assistance Program (SNAP), also known as the Food Stamp Program in New Hampshire, as well as the Special Supplemental Nutrition Program for Women, Infants, and Children and other programs designed to provide food assistance to children in school or outside of school buildings due to pandemic concerns.33
This assistance helped push the official household food insecurity rate to lower than it was before the Great Recession in New Hampshire and nationally. While national data is available for single years, official USDA estimates of food insecurity at the state level are expressed in three-year averages to provide more data certainty, as surveys only reach a limited number of households in New Hampshire and other small states. In the 2020-2022 period, New Hampshire’s food insecurity rate was lower than the overall national rate; New Hampshire had the lowest point estimate rate among the 50 states, but it was statistically indistinguishable from the food insecurity rates of Minnesota, North Dakota, and Vermont.34
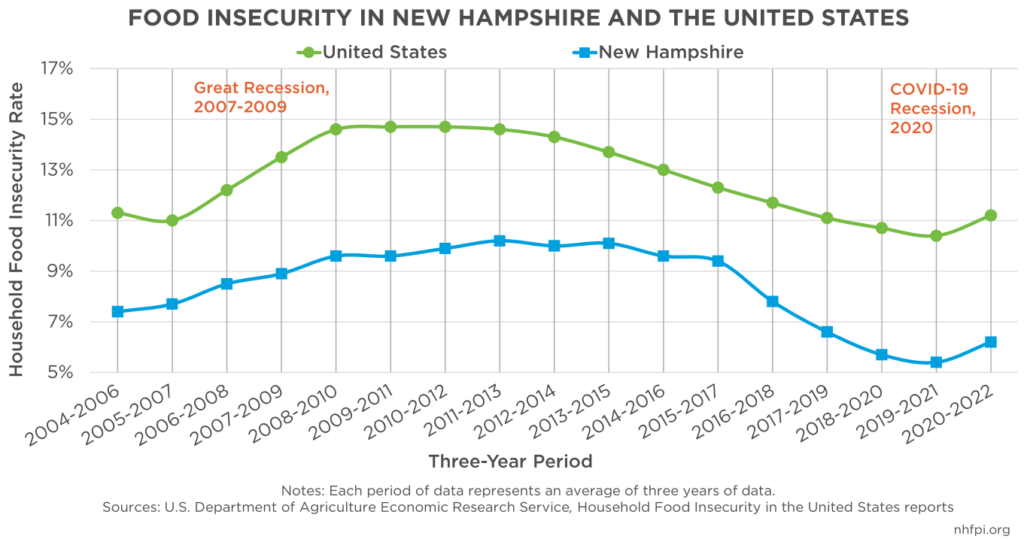
The lowest point for food insecurity, the 2019-2021 period, appeared to coincide in part with the economy in 2019, immediately prior to the pandemic, and the two years of pandemic-related aid being directed at households with lower incomes. While the change is not statistically significant, New Hampshire’s point estimate for the household food insecurity rate increased from 5.4 percent to 6.2 percent in the 2020-2022 period, representing about 35,000 Granite State households. For context, the average household in New Hampshire had 2.44 people in it in 2022, and family households averaged three or more people, including single-parent households, which that are more likely to be food insecure.35 While additional data would need to be collected to obtain greater certainty, pressures on household budgets from inflation may have led to higher overall food insecurity in 2022 relative to 2019 in New Hampshire, which would correlate with single-year national figures for 2019 and 2022.
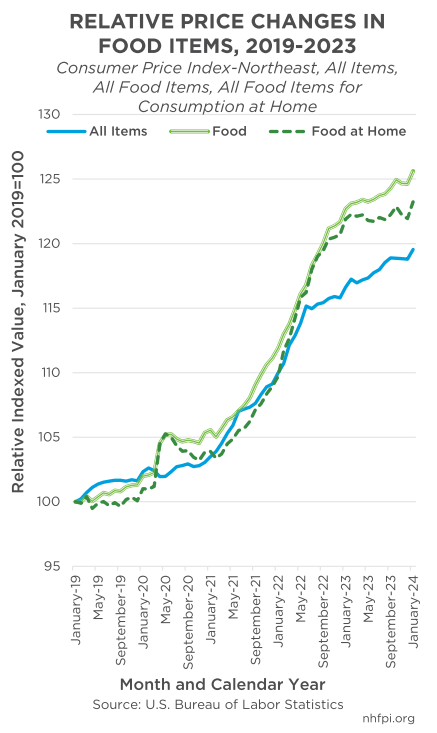
Inflation has been a challenge to financial security for many households, and food prices have risen substantially more than prices overall. While the Consumer Price Index for urban consumers in the northeastern United States estimated prices for all consumer goods and services in January 2024 were about 19.5 percent higher than in January 2019, food prices had risen about 25.6 percent during this five-year period. Prices for “food at home,” which represents groceries and excludes restaurant meals, increased 23.2 percent. While inflation has slowed substantially since early 2022, these increases likely diminished the ability of households with low incomes to remain food secure consistently.36
While detailed, sub-state data are not available directly from the USDA based on this survey, national-level data indicates food insecurity disproportionately impacts certain households and residents. Households with children were less likely to be food secure (food insecurity rate of 17.3 percent in 2022) than households overall (12.8 percent), although children were less likely to be food insecure (8.8 percent) than their households because adults are more likely to reduce the amount they eat than allow children to become food insecure, according to USDA research. Household with children headed by a single female (33.1 percent food insecure in 2022) and a single male (21.2 percent) were more likely to be food insecure than households overall, including households without children (11.0 percent) and married couples with children (10.7 percent). Women living alone, however, were more likely to be food insecure (15.1 percent). Households with adults age 65 and older were less likely to be food insecure (9.1 percent), as were households in suburban areas outside of major cities (10.5 percent). Households with an owner or renter who identifies as Black and non-Hispanic (22.4 percent) or as Hispanic (20.8 percent) also faced higher food insecurity rates, as did households within major cities (15.3 percent) and in rural areas (14.7 percent).37
An analysis from the University of New Hampshire’s Institute on Disability indicated people with disabilities in New Hampshire were substantially more likely to be food insecure than the population overall, based on Household Pulse Survey data collected during 2021 and 2022.38
County and Municipal Food Insecurity
While formal estimates of food insecurity at the substate level do not exist from the USDA’s primary survey, other indicators can provide hints as to the extent of food insecurity within different communities within New Hampshire.
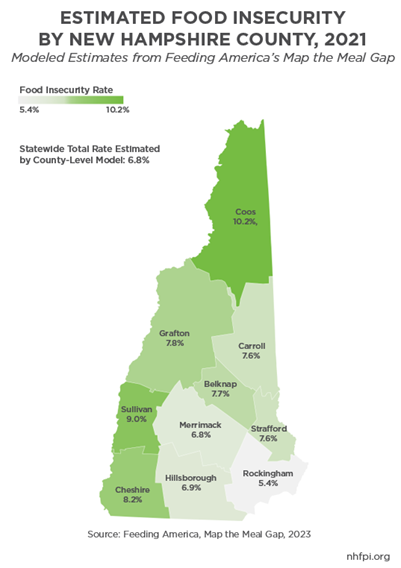
Using information from U.S. Census Bureau surveys and U.S. Bureau of Labor Statistics estimates, Feeding America’s Map the Meal Gap model uses known relationships between key variables to estimate food insecurity at the county level in the United States. The model, which has been refined over more than a decade, considers income, poverty, unemployment, homeownership, race, ethnicity, and disability prevalence statistics for each county to estimate food insecurity rates and the number of people who are food insecure. The model is likely more accurate for counties with larger populations, as areas with few inhabitants mean estimates are more reliant on the modeled assumptions to produce estimates.39
Although directly comparable data are not available, the model estimates a food insecurity rate of 6.8 percent, or about 94,000 people, for 2021, while the USDA’s survey average for the 2020-2022 period is 6.2 percent and 35,000 households. While these figures are different, the average household in New Hampshire had 2.44 people in 2022, and households with children are more likely to be food insecure, suggesting that 35,000 households could constitute 94,000 people, depending on whether all household members are included in counts. The 6.8 percent modeled estimate rate is statistically indistinguishable from the survey data’s estimated 6.2 percent, suggesting these estimates may not contradict each other, despite the gap between midpoint rate estimates.
The most recently published Map the Meal Gap data, representing food insecurity in 2021, show substantial variation between counties in New Hampshire. The estimated food insecurity rate ranged from a high rate of 10.2 percent in Coos County to a low rate of 5.4 percent in Rockingham County, likely reflecting the gap in estimated poverty rates between the two counties. However, Rockingham County’s relatively high population results in that relatively low food insecurity rate reflecting about 17,000 people who are food insecure, behind only Hillsborough County’s estimated 29,000 people who were food insecure, representing approximately 31 percent of the estimated total number of people who were food insecure in the state. Merrimack and Hillsborough counties had the lowest food insecurity rates outside of Rockingham County, while the western counties of Sullivan and Cheshire followed Coos County for the next-highest estimated food insecurity rates in the state.
Enrollment in food assistance programs also provides insights into food security needs. While these data only reflect people who decide to enroll in programs and overcome any barriers to access, they reflect individuals who have sought out assistance to afford food. Eligibility for SNAP is not based on food insecurity status, but is substantially based on low incomes, which correlates with food insecurity.40
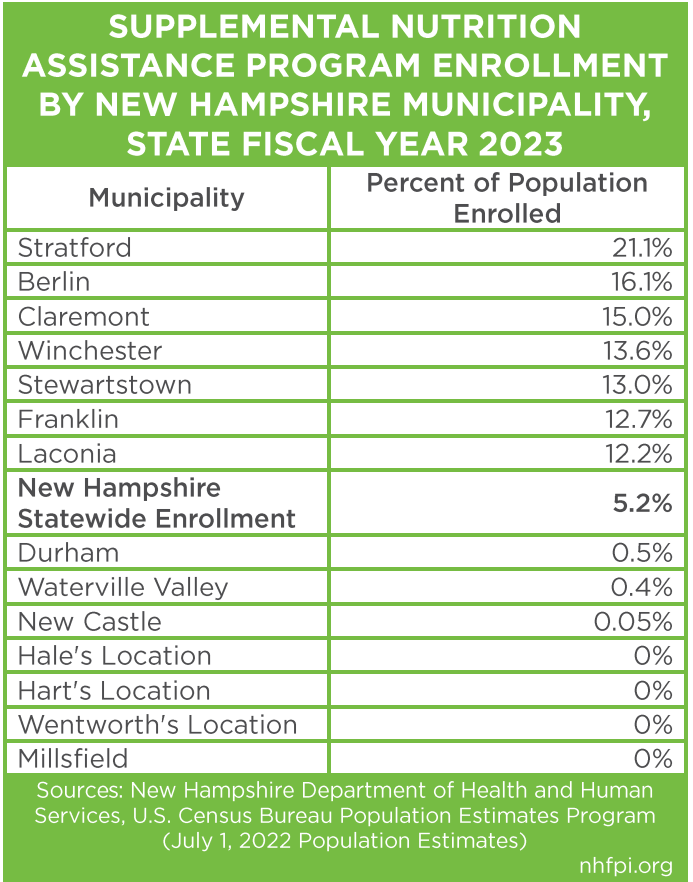
SNAP enrollment varies considerably by municipality in New Hampshire. About one in every five residents in the rural, northern town of Stratford was enrolled in SNAP during State Fiscal Year 2023, as were about one in every six in Berlin, New Hampshire’s northernmost city. Other small cities and rural towns also had high enrollment relative to their populations. Low population towns with amenities or major universities had relatively low SNAP enrollment compared to their populations, including enrollment of less than one in every 200 residents in Durham, Waterville Valley, and New Castle. Several very small, rural communities in northern New Hampshire had no SNAP enrollees.41
Free and reduced-price school meal enrollment also may reflect food insecurity, as enrolled students and their families receive help to afford food in a school setting. Eligibility is also largely dependent on income, rather than a specific food insecurity condition.42
The most recent data available for the 2023-2024 school year suggest that five communities (Stratford, Littleton, Stewartstown, Newport, and Dalton) have free and reduced-price enrollment that included about 60 percent or more of resident students, much higher than the estimated 26 percent enrolled statewide, suggesting potentially higher levels of food insecurity among households in those and other high-enrollment communities. Five communities (Sharon, New Castle, Millsfield, Hart’s Location, and Hale’s Location) had no enrolled students, and another five (Hanover, Greenland, Windham, South Hampton, and Rye) had less than 4 percent of resident students enrolled.43
Food Security and Insufficiency
The U.S. Census Bureau’s Household Pulse Survey, the high-frequency survey developed in response to the COVID-19 pandemic, asks several questions related to food security. The survey does not ask the same set of questions used to determine food insecurity in the USDA’s survey, and instead asks a shorter series of questions that build on each other as warranted based on prior answers.44
The Household Pulse Survey includes two key questions related to food security. The first asks whether there was enough food, or enough of the kinds of food household members wanted to eat, available in the prior seven days. If an adult being surveyed answered that there was often or sometimes not enough to eat, or that there was enough to eat but not always the kinds of food that household members wanted to eat, then that respondent would be considered to be facing “food insufficiency.” The second question asks why a responding adult did not have enough food to eat or what they wanted to eat, and provides answer options that include not being able to afford the food, not being able to physically get to the store, not going to the store due to safety concerns, or some other reason; respondents have the ability to select all that apply.
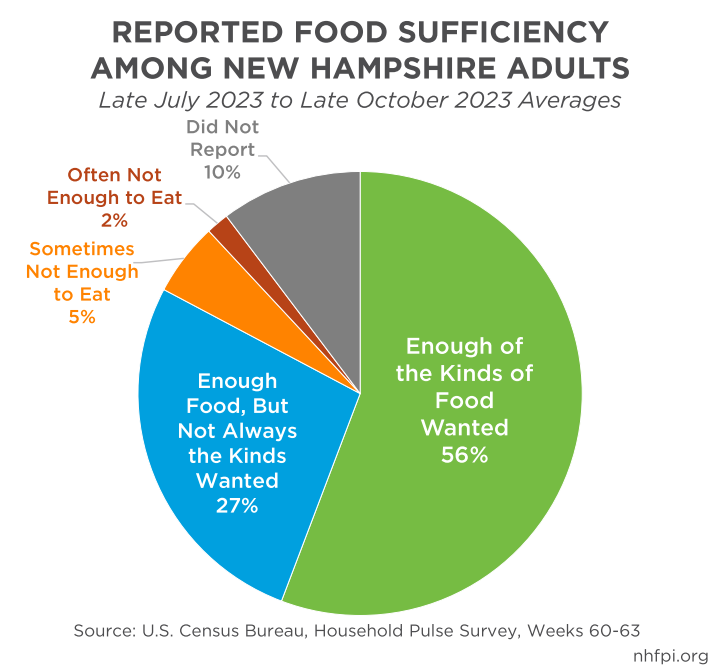
Between late July 2023 and late October 2023, surveys of New Hampshire adults showed that 56 percent reported sufficient food, indicating they had enough of the kinds of food that they and their household wanted to eat in the prior seven days. Of the remaining 44 percent, 10 percent did not report any information, while 27 percent reported there was enough food in total, but not always the kinds of food household members wanted to eat. About 5 percent of respondents reported that there was sometimes not enough food to eat, while 2 percent reported that there was often not enough to eat; that 7 percent total facing food shortages likely most closely reflects the formal food insecurity definition, although many more questions evaluating food availability are asked in that survey.
Within the 2 percent reporting there was often not enough food, about one in five identified transportation, mobility, or health issues prevented them from physically getting to a store, and 85 percent identified cost, with some respondents selecting both items and other issues. Among the 5 percent who identified that there was sometimes not enough to eat, 95 percent identified that they could not afford to buy more food, and about 9 percent identified transportation or health challenges associated with physically getting to the store. For the 27 percent identifying the aggregate amount of food was sufficient but the types of food were not always what was wanted, 53 percent identified the reason for this food insufficiency as cost, saying they could not afford to buy more food. While about 6 percent identified barriers to physically getting to a store, about 39 percent said that none of the reasons offered were why they did not always have what they wanted to eat in the last seven days.
In total, based on the survey data collected during this three month period, an estimated 18,500 adults often did not have enough to eat in the prior seven days, while 59,300 sometimes did not have enough. About 301,600 adults had enough food in total, but did not have enough of the types of food that they wanted to eat, with about 161,000 citing the reason for not having the types of food they wanted as that they could not afford to buy more.
Concluding Discussions
Food insecurity and poverty are key, interrelated challenges facing many individuals and families in New Hampshire. The official definition of poverty, as a measure of income, has key shortcomings as a comprehensive measure of hardship, and falls far short of meeting household needs relative to estimates of living costs in New Hampshire. More comprehensive measures of poverty reflect the role housing costs and other expenditures have in household budgets, rather than simply measuring all expenses relative to food.
Food insecurity provides a direct measure of hardship. A household without enough resources to buy food is likely facing many other financially-driven constraints on their well-being. Concrete survey questions regarding this limitation on health and wellness can likely provide clearer insight into an individual’s or family’s ability to thrive than estimations of income. However, poverty and food insecurity are interrelated, and populations with higher poverty rates are more likely to be food insecure.
Available data showing poverty rates for groups in New Hampshire suggest greater concerns regarding food insecurity may be warranted for specific populations. Single parents, particularly women with related children, face higher poverty rates, as do children overall. Research suggests children can face long-term consequences from food insecurity, likely affecting their future abilities to engage in the workforce. Granite Staters of color, particularly Black and Hispanic residents, have seen a decline in poverty rates, but still have rates twice as high, or more, as the total statewide rate. Individuals with lower levels of formal educational attainment also have substantially higher poverty rates, likely indicating long-term effects from barriers to success in schooling when they were young, which could have included food insecurity.
Federal aid related to the COVID-19 pandemic accelerated the reductions in poverty and food insecurity that had begun during the long, slow recovery from the Great Recession. The expiration of much of this one-time aid appears to be reversing at least some of the progress made to reduce poverty and food insecurity. Longer-term challenges to the financial well-being of households may present opportunities for nuanced, thoughtful, and targeted policy responses to the ongoing risks that poverty and food insecurity pose.
Endnotes
[1] For more discussion of measures of poverty, see the U.S. Congressional Research Service’s March 2017 report An Introduction to Poverty Measurement, the U.S. Census Bureau’s resource The History of the Poverty Measure, and the U.S. Department of Health and Human Services 1997 resource The Development and History of the U.S. Poverty Thresholds – A Brief Overview. For New Hampshire-specific discussions, see NHFPI’s September 2023 blog Latest Census Bureau Data Show Median Household Income Fell Behind Inflation, Tax Credit Expirations Increased Poverty, February 2022 blog Poverty in New Hampshire Was Higher Than Other States When Adjusted for Regional Housing and Other Costs, and June 2022 presentation Financial Vulnerability in New Hampshire.
[2] Poverty thresholds published by the U.S. Census Bureau are available by household size and age composition on the Bureau’s Poverty Thresholds webpage, accessed February 2024.
[3] Unless otherwise noted, all poverty data are derived from the U.S. Census Bureau’s American Community Survey, either the one-year survey data for 2022 or the five-year data for the 2018-2022 period, which the Bureau adjusts for inflation within the five-year averages as necessary. For more discussion of recent data, see NHFPI’s September 2023 blog Latest Census Bureau Data Show Median Household Income Fell Behind Inflation, Tax Credit Expirations Increased Poverty.
[4] See NHFPI’s September 2023 blog Latest Census Bureau Data Show Median Household Income Fell Behind Inflation, Tax Credit Expirations Increased Poverty.
[5] See the U.S. Census Bureau’s web page, Poverty in the United States: 2022, SPM Thresholds by Metro Area: 2022, accessed February 2024. The Manchester-Nashua Metropolitan Statistical Area is coterminous with Hillsborough County, and nonmetropolitan New Hampshire is described here as “rural New Hampshire.”
[6] For more information on housing costs in New Hampshire, see NHFPI’s August 2023 blog post Housing Shortage Continues to Increase Costs for Granite Staters and NHFPI’s October 2023 Fact Sheet Housing in New Hampshire: Shortage Raises Costs.
[7] For additional discussion and comparisons, see NHFPI’s September 2023 blog Latest Census Bureau Data Show Median Household Income Fell Behind Inflation, Tax Credit Expirations Increased Poverty and NHFPI’s February 2022 blog Poverty in New Hampshire Was Higher Than Other States When Adjusted for Regional Housing and Other Costs. For explanations of statistical significance, see NHFPI’s October 2017 blog Interpreting the Significance of the October County Census Data Release.
[8] To access these data, see the U.S. Census Bureau’s webpage Strategies to Counter 2021-Specific Challenges in Producing the Supplemental Poverty Measure in the American Community Survey, June 13, 2023.
[9] For more discussions of the Supplemental Poverty Measure and increases in the SPM poverty rates between 2021 and 2022, see NHFPI’s September 2023 blog Latest Census Bureau Data Show Median Household Income Fell Behind Inflation, Tax Credit Expirations Increased Poverty. For more discussions of expanded tax credits and other benefits associated with COVID-19 pandemic-related federal legislation, see NHFPI’s March 2022 Issue Brief Expansions of the Earned Income Tax Credit and Child Tax Credit in New Hampshire, February 2022 Issue Brief Public Benefit Navigators Can Help Granite Staters Access Federal Assistance and Support the Economy, June 2020 blog CARES Act Economic Impact Payments May Not Automatically Reach 9,900 Eligible Granite Staters, September 2022 blog Federal Tax Credits and Economic Stimulus Helped Boost New Hampshire Median Incomes, Offset Child Poverty Increase in 2021, and March 2021 blog Federal American Rescue Plan Act Directs Aid to Lower-Income Children, Unemployed Workers, and Public Services. The U.S. Census Bureau has begun publishing one-year American Community Survey-based SPM measures by state, but has not yet published those data for 2022, and appears to have identified challenges with the 2021 and 2020 data; for more information, see the Bureau’s June 2023 working paper Strategies to Counter 2021-Specific Challenges in Producing the Supplemental Poverty Measure in the American Community Survey.
[10] Figures from the Massachusetts Institute of Technology’s Living Wage Calculator for New Hampshire, updated February 2024. Learn more about the Living Wage Calculator’s methodology in the Living Wage Calculator, User’s Guide/Technical Notes, 2022-2023 Update, the Living Wage Benchmark Series – 2024 Technical Documentation – February 2024, and the Living Wage Calculator Methodology page, published by the Department of Urban Studies and Planning at the Massachusetts Institute of Technology.
[11] Figures from the Economic Policy Institute’s Family Budget Calculator, accessed February 2024. For more information about the methodology, see The Economic Policy Institute’s Family Budget Calculator – Technical Documentation, January 30, 2024.
[12] For more information about the history of this survey and data collected over time, including the questionnaires themselves, see the U.S. Census Bureau’s web page Household Pulse Survey: Measuring Emergent Social and Economic Matters Facing U.S. Households, accessed February 2024.
[13] For more discussion of these Household Pulse Survey data over time in New Hampshire, see NHFPI’s July 2023 blog Affording Household Expenses Remains Challenging for Many Granite Staters.
[14] For more discussion of structural barriers to success, see NHFPI’s August 2021 Issue Brief Greater Investments Key for Students Facing Inequities Across New Hampshire, specifically including the citations in endnotes 10 and 12. For additional discussions of structural barriers to financial success, see the 2023 book Poverty, By America authored by Princeton University Professor Matthew Desmond, as well as the Urban Institute’s April 2022 analysis Boosting Mobility and Advancing Equity Through Systems Change and February 2021 discussion Poverty Results from Structural Barriers, Not Personal Choices. Safety Net Programs Should Reflect That Fact.
[15] All poverty rates discussed in this section are Official Poverty Measure, and are based on the U.S. Census Bureau’s American Community Survey five-year estimates, accessed in December 2023.
[16] See the U.S. Census Bureau’s web page Guidance for Disability Data Users, accessed February 2024.
[17] These data were accessed through tables S1701 and S1501 of the U.S. Census Bureau’s American Community Survey for New Hampshire during 2018 to 2022.
[18] See NHFPI’s February 2024 Issue Brief The State of Child Care in New Hampshire: End of One-Time Federal Investments May Reduce Industry Stability and NHFPI’s October 2023 Fact Sheet Child Care in New Hampshire: High Price, Low Supply.
[19] Estimates for single-male households with no spouse present were calculated using U.S. Census Bureau American Community Survey Table B17010.
[20] Estimates for single households with no spouse present were calculated using U.S. Census Bureau American Community Survey Table B17019.
[21] For comparisons to data from the 2014-2018 data, see NHFPI’s June 2020 Issue Brief Inequities Between New Hampshire Racial and Ethnic Groups Impact Opportunities to Thrive.
[22] For more analysis of this geographic trend, see NHFPI’s August 2018 Issue Brief Measuring New Hampshire’s Municipalities: Economic Disparities and Fiscal Capacities, and NHFPI’s July 2020 presentation Examining Local Economic Conditions and Fiscal Capacities.
[23] To learn more about the labor force constraint in New Hampshire, see NHFPI’s August 2023 Issue Brief Granite State Workers and Employers Face Rising Costs and Significant Economic Constraints.
[24] For more information about the definitions and measures of food insecurity, see the U.S. Department of Agriculture’s October 2023 report Household Food Security in the United States in 2022.
[25] To see the specific survey questions, see page 5 of the U.S. Department of Agriculture’s October 2023 report Household Food Security in the United States in 2022.
[26] For more details and references, see the U.S. Department of Health and Human Services, Office of Disease Prevention and Health Promotion, Healthy People 2030 Food Insecurity Literature Summary, accessed February 2024.
[27] See the U.S. Department of Health and Human Services, Office of Disease Prevention and Health Promotion, Healthy People 2030 Food Insecurity Literature Summary, accessed February 2024. See also the U.S. Department of Agriculture’s October 2023 report Household Food Security in the United States in 2022.
[28] For more details, see The Journal of Nutrition, Household Food Insecurity is Associated with Adult Health Status, June 2004; Food Insecurity in Older Adults, June 2022; Earlier and Concurrent Food Insecurity Are Associated with Suboptimal Parenting in Early Childhood, March 2020; Food Insecurity and Poor Sleep: Another Consequence of Food Insecurity in the United States, January 2015; Food Insecurity Affects School Children’s Academic Performance, Weight Gain, and Social Skills, September 2005. See also the U.S. Department of Agriculture’s October 2017 research Adults in Households With More Severe Food Insecurity Are More Likely To Have a Chronic Disease, the Indian Journal of Medical Research November 2007 article The Negative Effects of Poverty and Food Insecurity on Child Development; U.S. Department of Health and Human Services, National Institute on Minority Health and Health Disparities, accessed February 2024; Health Affairs, Food Insecurity and Health Outcomes, November 2015; American Journal of Health Promotion, Food Insecurity and Mental Well-Being Among Low-Income Families During COVID-19 Pandemic, 2022, Vol. 36(7); Journal of Health Economics, Bounding the Effects of Food Insecurity on Children’s Health Outcomes, September 2009; and Policy Insights from the Behavioral and Brain Sciences, Food Insecurity: What Are Its Effects, Why, and What Can Policy Do About It? July 2021.
[29] For this research and the associated literature review, see The Journal of Children and Poverty, Understanding the Link between Poverty and Food Insecurity among Children: Does the Definition of Poverty Matter? , January 2014.
[30] For more discussions, see the Journal of the American Academy of Child & Adolescent Psychiatry, Poverty, Food Insecurity, and the Behavior for Childhood Internalizing and Externalizing Disorders, May 2010; Public Health Reports, Food Insecurity: A Public Health Issue, August 2016; Applied Economic Perspectives and Policy , The Economics of Food Insecurity in the United States, August 2011, available in manuscript form through Iowa State University.
[31] For more information and the source of these and other official food insecurity data used in this analysis, see the U.S Department of Agriculture’s October 2023 report Household Food Security in the United States in 2022.
[32] See NHFPI’s September 2022 blog Declines in Food Insecurity Among Granite Staters Aided by Federal Pandemic Assistance Programsand December 2020 publication Food Insecurity and Economic Conditions in New Hampshire and the Nation.
[33] For more information on changes in food assistance programs in response to the COVID-19 pandemic, see NHFPI’s March 2021 blog Federal American Rescue Plan Act Directs Aid to Lower-Income Children, Unemployed Workers, and Public Services, November 2021 blog Federal Increases to SNAP Benefits May Aid the Recovery from the COVID-19 Crisis More in Rural Areas, December 2021 Issue Brief The Special Supplemental Nutrition Program for Women, Infants, and Children: Enrollment Before and During the COVID-19 Crisis and September 2022 blog Declines in Food Insecurity Among Granite Staters Aided by Federal Pandemic Assistance Programs.
[34] Statistical testing performed at the 90 percent confidence level. For the original data, see the U.S Department of Agriculture’s October 2023 report Household Food Security in the United States in 2022.
[35] Average household size published by the U.S. Census Bureau’s American Community Survey One-Year Estimates for 2022 in Table S1101.
[36] For more information about inflation and household budgets in New Hampshire, see NHFPI’s September 2023 blog Latest Census Bureau Data Show Median Household Income Fell Behind Inflation, Tax Credit Expirations Increased Poverty, July 2023 blog Affording Household Expenses Remains Challenging for Many Granite Staters, February 2024 presentation New Hampshire’s Economy and the Financial Well-Being of Granite State Households, and October 2023 presentation Household Finances and the Cost of Living in The Granite State. See also the U.S. Bureau of Labor Statistics information release Consumer Price Index, Northeast Region – January 2024 and Glossary resource.
[37] For these data and additional discussions, see the U.S Department of Agriculture’s October 2023 report Household Food Security in the United States in 2022.
[38] See the University of New Hampshire, Institute on Disability’s 2023 Needs Assessment: Food Security & Disability.
[39] For more information on Feeding America’s methodology, see Feeding America’s Map the Meal Gap 2020 and Map the Meal Gap 2023 Technical Brief. See also the University of Wisconsin Population Health Institute’s County Health Rankings and Roadmaps: Food Insecurity.
[40] For an explanation of SNAP eligibility, see NHFPI’s October 2019 Issue Brief The Potential Impacts of Proposed SNAP Eligibility and Work Requirement Changes on Food Insecurity and the New Hampshire Department of Health and Human Services New Hampshire Bureau of Family Assistance (BFA) Program Fact Sheet, January 1, 2024.
[41] Calculations performed using monthly SNAP enrollment data supplied by the New Hampshire Department of Health and Human Services and the U.S. Census Bureau’s Population Estimates Program July 1, 2022 estimates of municipal populations.
[42] To learn more about eligibility for free and reduced price school meals, see NHFPI’s November 2021 presentation Measuring Student Hardship by Municipality: Free and Reduced-Price School Meal Eligibility and Other Metrics for Understanding Local Poverty and Income.
[43] To access the data used to calculate these municipal-level estimates, see the New Hampshire Department of Education’s State Adequate Education Aid spreadsheets; these calculations used estimates from November 15, 2023.
[44] For the survey questions and associated data, see the U.S. Census Bureau’s Household Pulse Survey Technical Documentation and Household Pulse Survey Data Tables websites, accessed February 2024.