Fueled by accumulated savings and federally-funded economic stimulus, the national and New Hampshire economies have rebounded quickly from the recession caused by the COVID-19 pandemic. Despite forecasts of another recession in 2022 or early 2023, the national and state economies largely remained resilient and have avoided a downturn.[1]
However, the expansion of the state’s economy has been limited by workforce constraints. The number of Granite Staters who are employed or looking for work is lower than it was in 2018 and 2019, before the pandemic. The number of employed Granite Staters has dropped even while job openings per unemployed resident has increased to more than three unfilled positions per unemployed worker in 2023, nearing the historically high levels reached in 2022. The size of the state’s economy, as measured by Gross State Product, did not increase in 2022 relative to 2021. While the economy in New Hampshire rebounded faster than neighboring states in 2021, these other economies continued to grow in 2022.
The labor force constraints on New Hampshire’s economy have likely been caused, in part, by more older workers leaving employment. The constraints have been further exacerbated by the high costs and limited availability of housing and child care, which are two of the largest costs households with children face in New Hampshire. Fewer housing opportunities limit workers’ ability to move to New Hampshire. Approximately 16,800 adults were out of the labor force during the last year due to child care needs unfulfilled by school or child care services. Inflationary increases in prices overall have also put more pressure on household finances, as the average hourly wage in the most recent 12 months in New Hampshire remained below 2021 levels, after adjusting for inflation.
This Issue Brief provides insight into the well-being of workers in the New Hampshire economy, and the constraints employers face when seeking to hire more residents.
Favorable National Economic Conditions
The burst of economic activity coming out of the recession triggered by the COVID-19 pandemic generated both rapid economic growth and mixed signals for the sustainability of such prosperity. After experiencing significant layoffs in key industries, wages for lower-income workers began rising considerably faster than they did following the long, slow recovery from the Great Recession. This increase was largely driven by the limited availability of workers, and minimum wage increases in many states also contributed to the boosts in wages among lower income workers.[2]
Federal policymakers, including both legislators and monetary policy decision-makers at the U.S. Federal Reserve, provided very significant support to the economy in 2020 and 2021. Economic relief and stimulus through fiscal policy came through federal legislation, and the Federal Reserve kept target interest rates down to help maintain a relatively low cost for borrowing. With inflation rising and shifting from being sector-specific to more widespread in late 2021, the Federal Reserve began raising interest rates, and the U.S. Congress did not enact additional major short-term economic stimulus.[3]
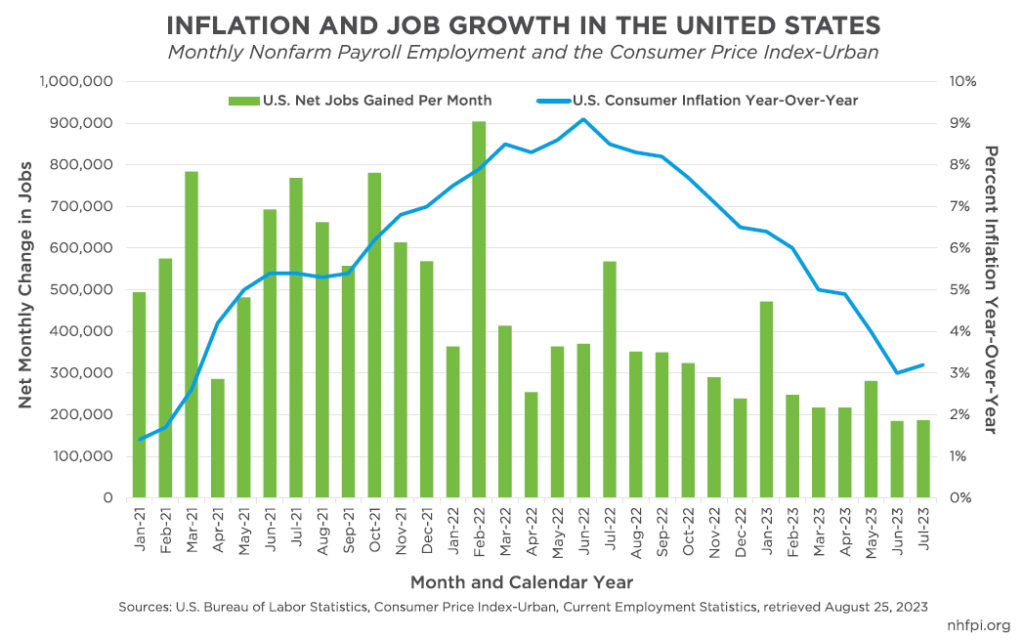
Decisions to increase interest rates were designed to slow the economy and reduce inflation. However, even as the cost of borrowing has increased, national job growth has remained robust while inflation has declined. The resilient job market suggests the economy is not in recession, nor is it about to enter one, even as it slows from the immediate post-pandemic growth and rising interest rates. National employment is higher than both their pre-pandemic levels and key employment projections made before the pandemic.[4] Some of the causes of inflation, including supply chain shocks, temporary shifts in consumer expenditures spurred by the pandemic, and spending boosts enabled by household savings and federal fiscal stimulus, have been fading since mid-2022.[5] These trends do not preclude an external shock, such as a major geopolitical or economic event, from derailing economic growth and the financial security of households and families.
New Hampshire and Neighboring State Economies
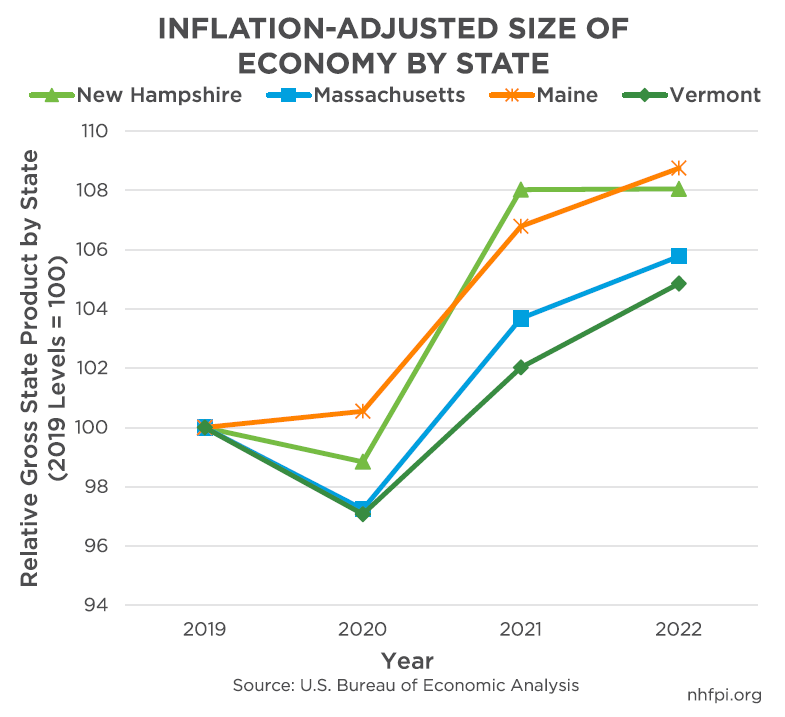
According to several key metrics, the economies of New Hampshire, its neighboring states, and the nation overall have recovered robustly from the COVID-19 pandemic. Generally, the pandemic reduced economic output in 2020. While New Hampshire and bordering states Massachusetts and Vermont saw their economies contract in 2020 relative to 2019, as measured by Gross State Product, Maine’s economy proved more resilient and grew in 2020, potentially aided by an influx of new residents.[6] Relative to 2019 levels, New Hampshire’s economy grew faster between 2020 and 2021 than its three neighboring states, but growth stalled in 2022. Growth continued in neighboring states, and while the Massachusetts and Vermont economies had not expanded as much relative to 2019 as New Hampshire, Maine’s economy appeared to reach similar levels of relative expansion by 2022.
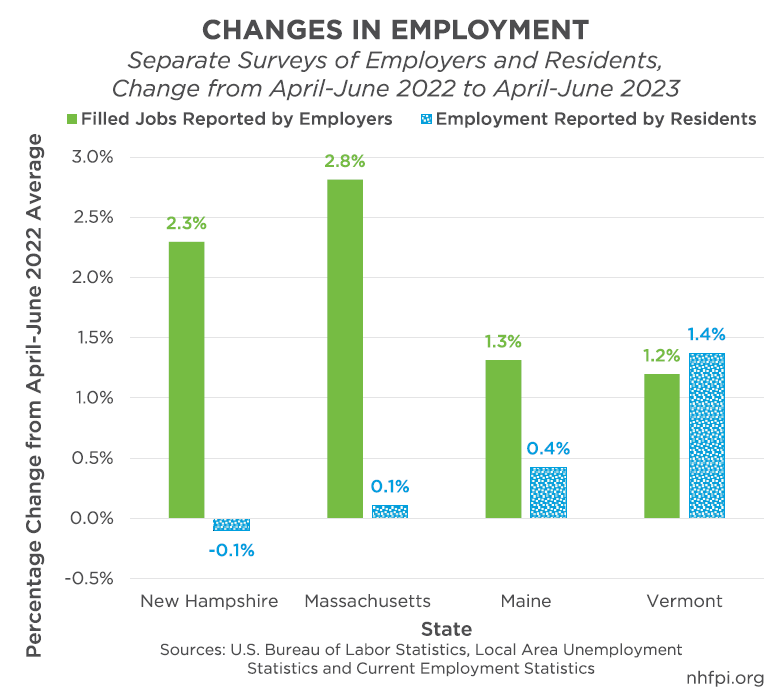
New Hampshire’s growth was likely slowed by workforce limitations. Between the second quarters of 2022 and 2023, the number of residents reporting that they were employed declined by about 740 people (0.1 percent). Massachusetts also saw very limited changes in the number of residents who reported that they were employed, with an estimated increase of 3,950 (0.1 percent) between the April to June 2022 average and the same period in 2023. Maine (2,800, 0.4 percent) and Vermont (4,590, 1.4 percent) saw faster percentage increases in the number of residents reporting they had a job.
However, a separate survey asking employers based in each state about the number of filled positions suggests much more robust growth in New Hampshire, Massachusetts, and Maine. New Hampshire employers reported about 15,700 (2.3 percent) more jobs during this time period, even while the number of residents reporting they had a job declined. Employers based in Massachusetts reported 102,900 (2.8 percent) more jobs, while the growth rates in Maine and Vermont were lower. This gap in New Hampshire, Massachusetts, and Maine could be due to data collection differences and may be revised over time, but may also reflect that more workers are commuting from out-of-state, or that more workers are choosing to remain within their home state for work. Alternatively, each resident may be more likely to be working multiple jobs, as employers are counting the number of filled jobs to compile these data, while residents are reporting if they are employed without necessarily indicating whether they are working one job, or multiple jobs.
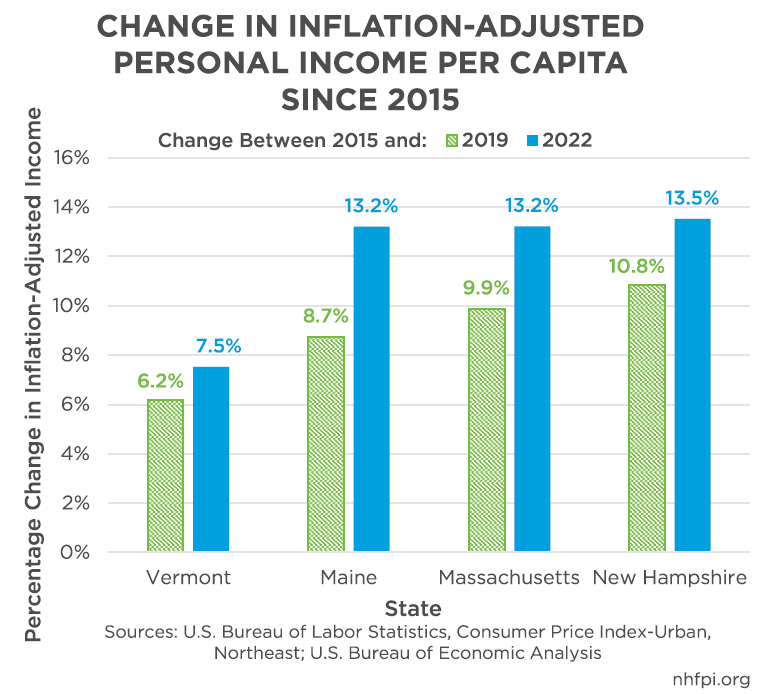
Over a longer time period, inflation-adjusted personal incomes per person have grown at a similar pace in New Hampshire, Massachusetts, and Maine between 2015 and 2022. Adjusting for overall inflation in prices that consumers faced in the Northeastern United States, personal incomes per capita rose faster in New Hampshire than its neighbors between 2015 and 2019, but both Maine and Massachusetts closed almost all of the gap in percentage growth between 2019 and 2022, while Vermont continued to lag further behind New Hampshire.[7] Notably, personal income per capita may be disproportionally impacted by individuals with higher incomes, as this average measure may be shifted by upper income growth relative to measures designed to represent the middle of economic well-being, such as median household income.[8]
Little change in the number of employed residents and more limited increases in personal income likely reflects the slower economic growth in New Hampshire since the initial recovery from the COVID-19 pandemic. Much of the limitation on economic growth is likely from the severe workforce constraint.
New Hampshire’s Recovery Slowed by Workforce Constraints
Relative to the years immediately preceding the COVID-19 pandemic, a smaller number of New Hampshire residents report they are working or actively seeking work. While the average size of the labor force, or the number of Granite Staters working or looking for employment, was about 780,540 in 2019, it fell during the pandemic-impacted years of 2020 and 2021, but only recovered to approximately 766,672 in 2022. Data collected thus far in 2023 suggest the workforce has not grown since 2022, with about 14,720 (1.9 percent) fewer residents in the labor force thus far in 2023 than were participating in 2019. Year-to-date 2023 data also suggest about 11,650 (1.5 percent) fewer residents were in the labor force relative to 2019.
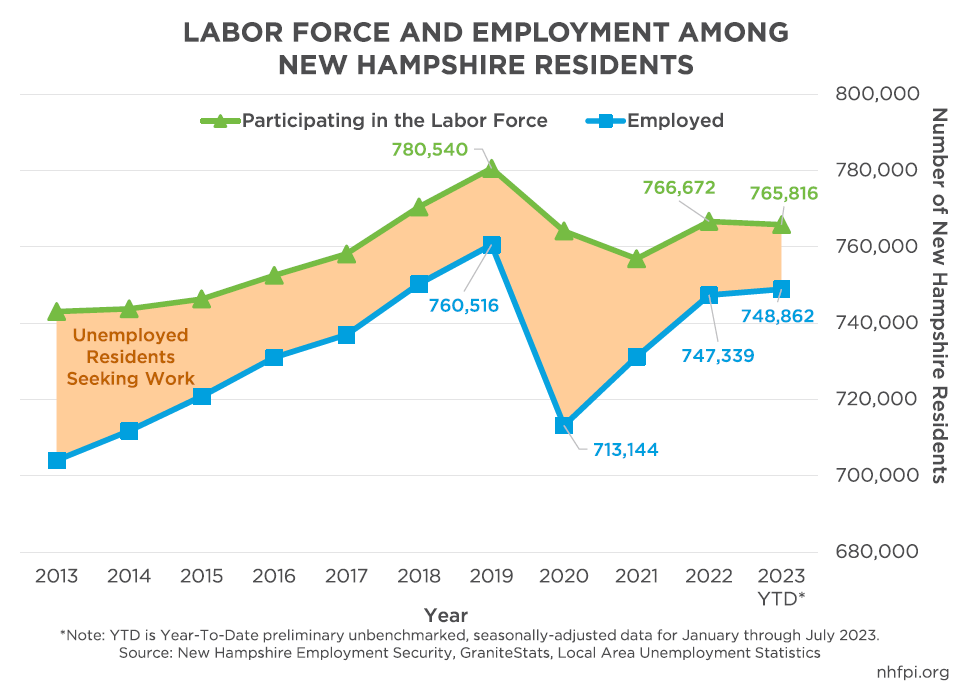
The number of unemployed Granite Staters, which are those not employed but actively seeking work, has declined from an average of about 25,490 people in 2015 to 20,020 in 2019, and a seasonally-adjusted average of 16,950 during the first seven months of 2023. The monthly unemployment rate for July 2023 was an estimated 1.7 percent, representing about 13,100 people, according to preliminary data.[9] This 1.7 percent was both the lowest state-level unemployment rate in the country during that month and a record low for New Hampshire; Maryland and Vermont, each with 1.8 percent, tied for second lowest state rate that month, and also set new record lows, as did 13 other states.[10]
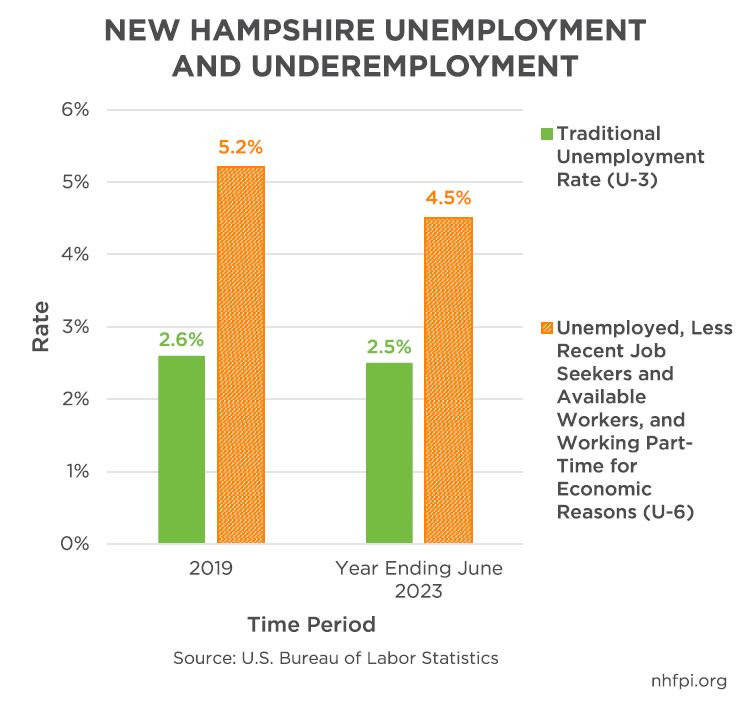
However, these data do not reflect certain potential workers. A separate measure related to unemployment provides a more expansive perspective on worker engagement and underemployment. Workers traditionally considered unemployed have looked for work in the last four weeks. This expanded measure includes the traditional unemployed, as well as those who are working part-time for economic reasons, such as not being able to find full-time work; it also includes workers who are available for work and have looked in the last year, but not as recently as the last four weeks, and those discouraged by the job market. In the year ending June 2023, 4.5 percent of Granite State workers were in this broader underemployment category.[11]
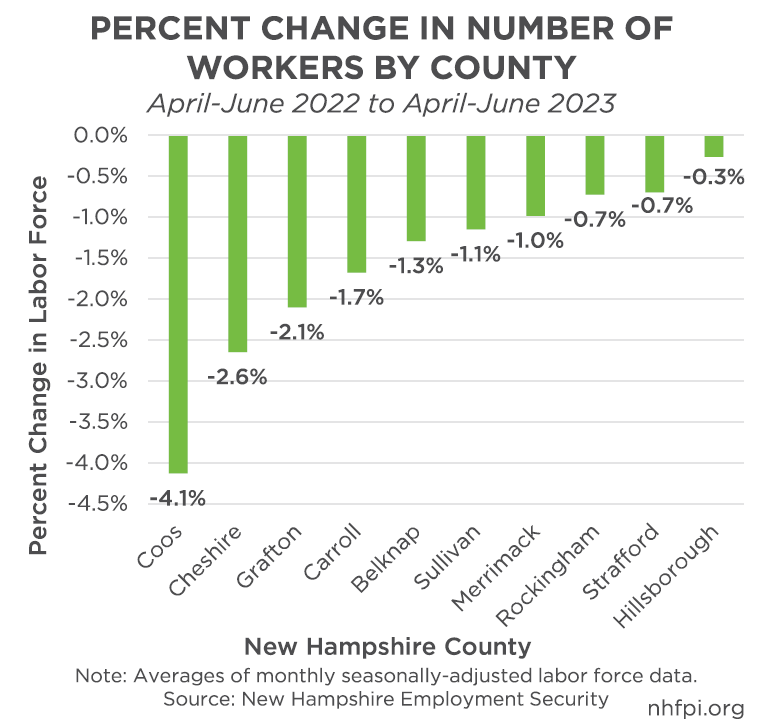
Labor force participation also did not decline evenly across New Hampshire. Between the second quarters of 2022 and 2023, the number of people reporting they were employed or actively looking for work declined. The size of the workforce declined the most, in percentage terms, in Coos County (4.1 percent). Other rural counties also saw relatively large declines, including Cheshire (2.6 percent) and Grafton (2.1 percent) counties, while the state’s four southeastern counties had the smallest percentage decreases.
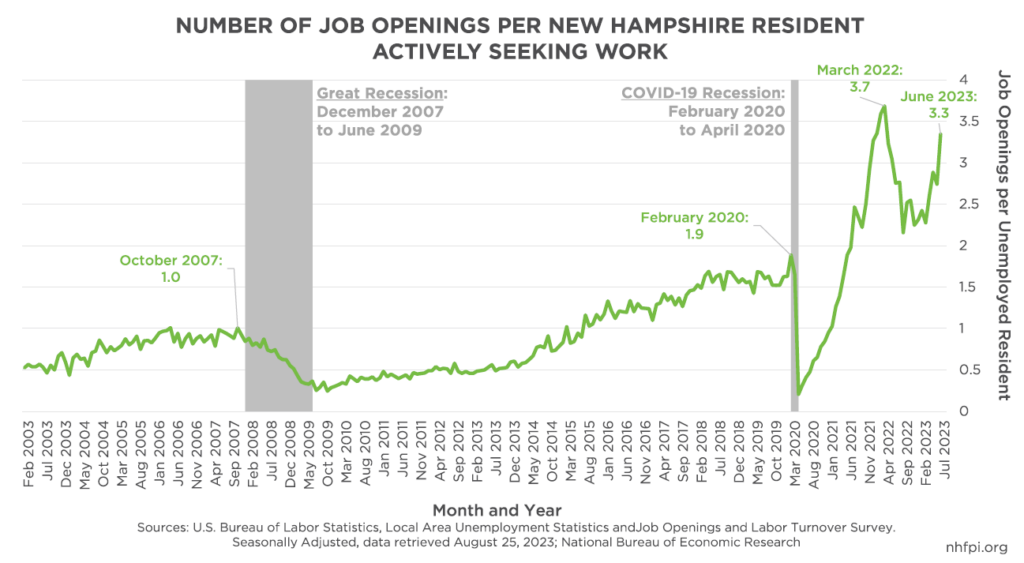
The reduced number of Granite Staters available for work, combined with the growing economy, has created a widening gap between the number of open jobs in the state and the number of unemployed residents to fill them. Two months before the beginning of the Great Recession in December 2007, there was approximately one job opening for every unemployed worker in the state. That figure had dropped below half a job opening for every unemployed worker, or more than two unemployed workers for each open job, by the end of the Great Recession. The number of unemployed workers in the state did not keep pace with the growth in job openings, however, and in February 2020, just before the pandemic’s worst economic effects reached New Hampshire, there were 1.9 job openings for every unemployed worker. Following a spike in the number of unemployed workers during the pandemic, job openings per Granite Stater actively seeking work started to rapidly increase, peaking at 3.7 jobs per worker in March 2022. After dipping, the number has again risen to 3.3 jobs per unemployed worker in June 2023.[12]
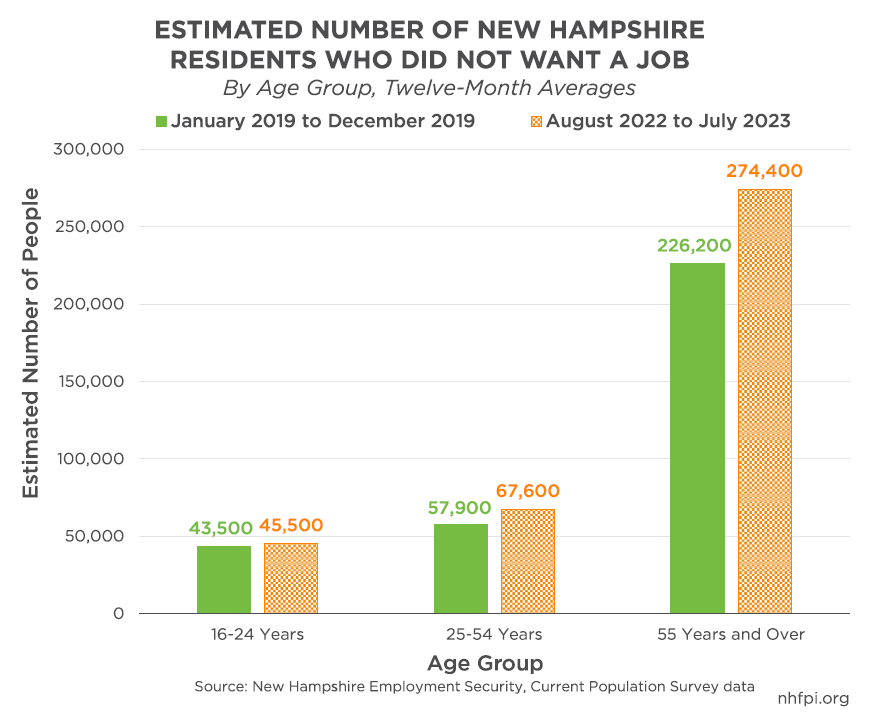
The COVID-19 pandemic appears to have had a lasting effect on the labor force, and likely accelerated trends that were ongoing, particularly relative to the state’s age demographics.[13] Survey data show the largest increase by age group, between 2019 and the year ending July 2023, in the number of people who say they do not want a job is among Granite Staters 55 years old or older. These data suggest retirements have increased as the state’s population ages, and correspond with estimates from the U.S. Federal Reserve that 2.2 million more retirements have occurred than would have been expected without the COVID-19 pandemic.[14]
While more profound for some groups, labor force participation among almost all groups of Granite Staters has decreased since 2019. The participation rate has increased for 16- to 19-year-olds, but the added number of workers from that group is quite small (340 people) compared to the total reduction of approximately 16,990 workers, corresponding with a 4.3 percentage point decline in the labor force participation rate, between 2019 and the year ending July 2023. The largest percentage decline in the participation rate among age groups was among 20- to 24-year-olds (6.2 percentage points), while the largest reduction in the size of the labor force was among 45- to 54-year-olds (37,800 fewer workers).
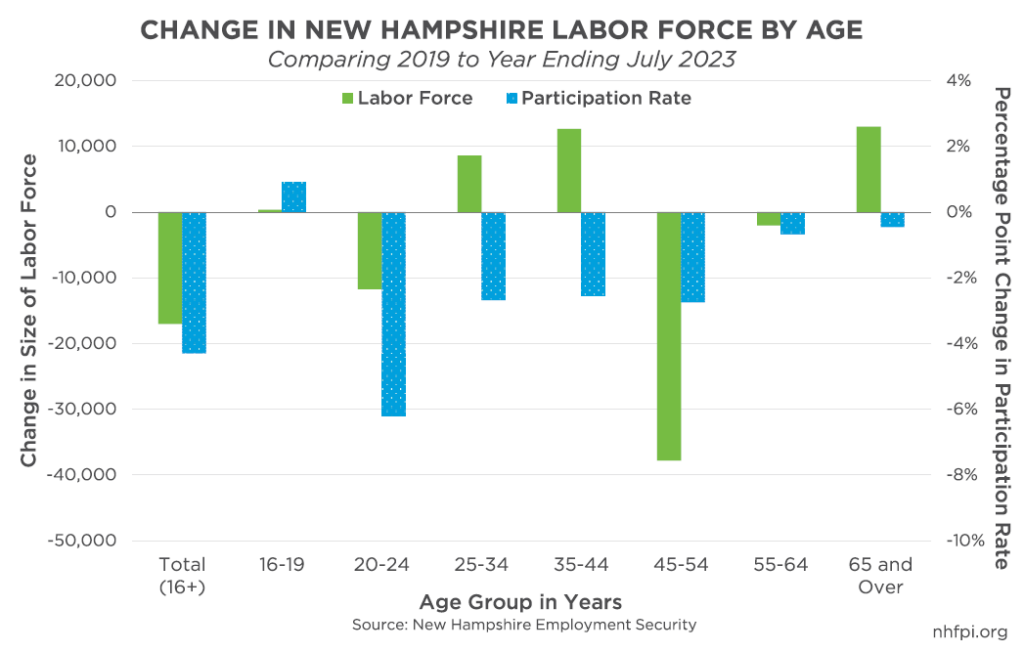
Between 2019 and the year ending in July 2023, many workers likely aged into different brackets; for example, the increase in workers in the 25-44 and 65 years and over age groups, even as their labor force participation rates fell, may be due in part to younger workers aging into these demographic groups. Also, older workers planning to retire permanently may have rejoined the labor force in response to rising costs. Many workers across age groups may have been kept out of the labor force in New Hampshire by increasing costs for housing and child care.
Lack of Child Care and Housing Access Limit Workforce Growth
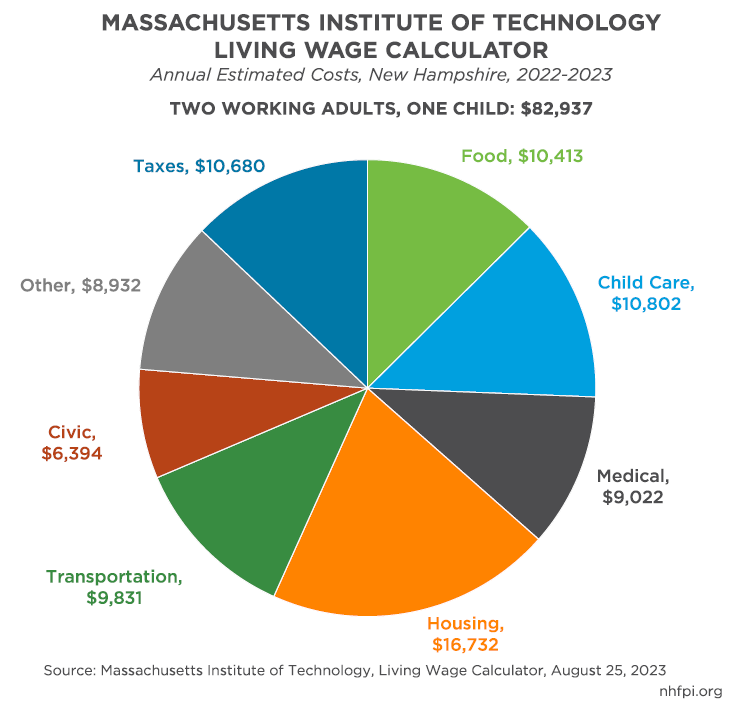
Lack of access to child care and housing has restricted the size of the labor force in New Hampshire, limiting the ability of businesses to find workers to hire. According to the Massachusetts Institute of Technology’s Living Wage Calculator, child care and housing are the two largest expenses families with children are likely to face in New Hampshire.[15] However, the Living Wage Calculator cost estimates for child care are lower than other key approximated average prices for child care in New Hampshire. The organization Child Care Aware of America estimated the average 2022 price of residential home-based family child care prices were $10,140 per year for an infant and $10,400 for a toddler in New Hampshire, while center-based annual child care prices averaged $14,235 for a toddler and $15,340 for an infant.[16]
High child care costs, or difficulty accessing affordable child care due to geographic distances, may be causing more families to choose to curtail or forgo paying for child care and instead reduce their working hours or remain outside of the labor force.[17] Estimates based on survey data collected by the U.S. Census Bureau between mid-September 2022 and early August 2023 suggest an average of approximately 16,800 New Hampshire adults were not in the labor force because they were caring for a child who was not in school or child care.[18] While some of these adults were likely choosing to care for children and not work for non-economic reasons, this figure does not include adults who reduced their work hours or otherwise altered their employment situation to accommodate child care needs.
Workforce growth and household finances have also been constrained by the high cost and limited availability of housing. In March 2023, the New Hampshire Housing Finance Authority estimated the state had 23,500 fewer housing units than were needed to meet demand.[19] Both the inventories of new houses and condominium units available for purchase and the rental unit vacancy rate remain very low in 2023. Inventories have increased slightly since 2022, although prices have remained high or increased.[20] The very limited supply hinders the ability of potential new residents to move into the state. New Hampshire has historically relied on people moving to the state for robust population and workforce growth.[21] Fewer affordable housing opportunities likely limits the ability of employers to attract workers from other states, or other parts of New Hampshire, to their open positions.
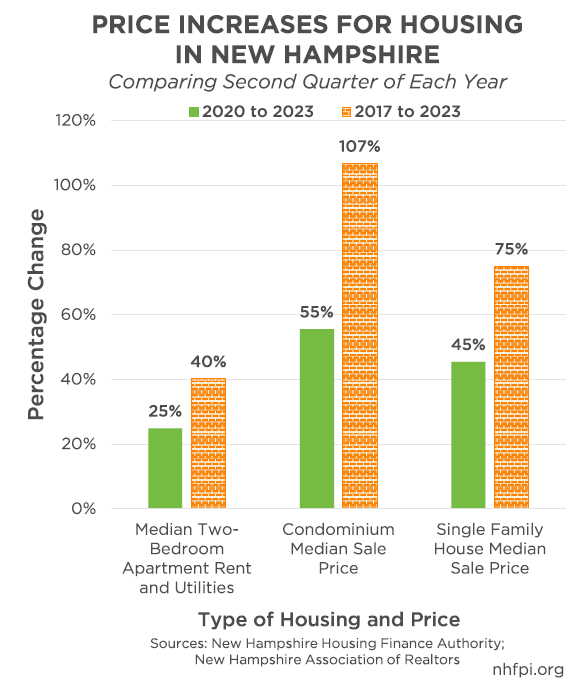
Rising housing costs strain the budgets of workers and households in New Hampshire generally. Limited supply has pushed median two-bedroom apartment monthly rent and utility costs up 40 percent statewide since 2017 and 25 percent since the beginning of the pandemic, totaling $1,764 per month in Spring 2023.[22] Home purchase prices have risen even faster, with the average monthly median single-family house sale prices averaging 75 percent higher in April to June 2023 than in the same period in 2017, and 45 percent higher than the same period in 2020. The statewide median single family home sale price in June 2023 was $499,450. Condominium prices rose even faster, with a 55 percent increase between the second quarters of 2020 and 2023, and a total increase of 107 percent from the same periods in 2017 to 2023.[23]
With both rental and purchase prices this high, many Granite State individuals and families are cost-burdened by housing, and other may choose to move elsewhere if they cannot find or afford housing in New Hampshire.[24]
High Costs and Reduced Federal Supports Impact Household Finances
While housing and child care shortages constrain workforce growth due to both lack of accessibility and high costs, increases in costs overall have reduced the financial security of households generally.
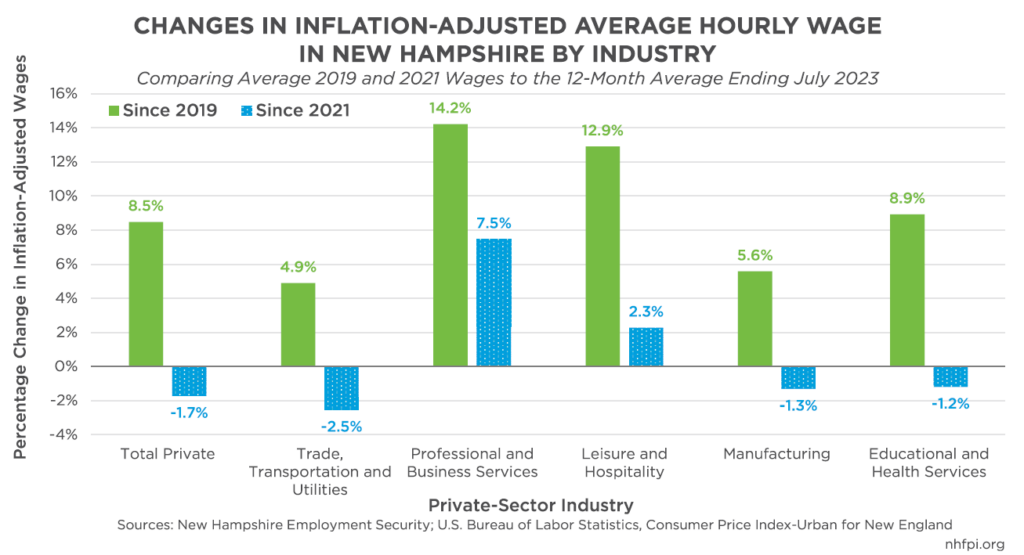
Inflation-adjusted average private sector wages in New Hampshire have increased across all major industry sectors since 2019. However, the relatively high rates of inflation following the recovery from the COVID-19 pandemic recession have reduced the purchasing power of the average wage in New Hampshire. For the twelve months ending July 2023, the average private sector wage was 1.7 percent lower, after adjusting for inflation, than it was in calendar year 2021.[25] In the most recent 12 months, average private sector wages fell behind inflation relative to 2021 in the Manufacturing, Educational and Health Services, and Trade, Transportation, and Utilities industries. Professional and Businesses Services, which had the highest average hourly wage, also experienced the largest average inflation-adjusted hourly increase, while Leisure and Hospitality, with the lowest average wages, also increased relative to 2021 after adjusting for inflation. Leisure and Hospitality employers may have had to raise wages faster than other sectors to attract more workers in an economy with relatively few people actively looking for work.
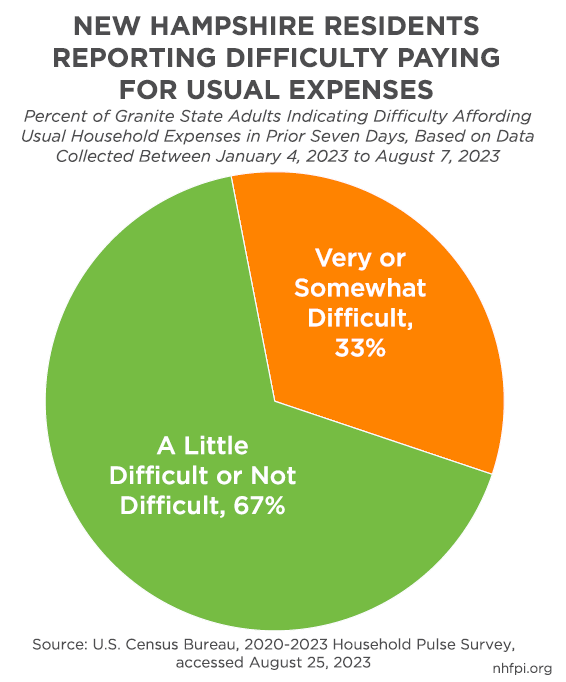
Lower purchasing power means more individuals and families likely must pull from longer-term savings or struggle financially to meet their regular household costs. In survey data collected between early January 2023 and early August 2023, one out of every three New Hampshire adults reported that affording usual household expenses had been somewhat or very difficult in the prior seven days. While these data were collected starting in 2020, precluding a pre-pandemic comparison, this percentage of adults has been approximately the same since the price increases immediately following the Russian invasion of Ukraine, while only one in five New Hampshire adults reported similar levels of difficulty during the Summers of 2020 and 2021.[26]
Savings built up during the COVID-19 pandemic due to changes in spending patterns and federal fiscal stimulus have also started to erode. In mid-2022, the U.S. Federal Reserve estimated that U.S. households across the income spectrum had more savings than would have been anticipated without the pandemic’s impacts; about half of these savings were among households with incomes in the top 25 percent.[27]
Subsequent research from both the U.S. Federal Reserve and the Federal Reserve Bank of San Francisco suggests that most, if not all, of these additional savings have been spent.[28] Households are also indicating directly that their savings may be more constrained. An October 2022 survey found that 37 percent of U.S. adults would not pay for an unexpected $400 expense with cash, savings, or a credit card to be paid at the end of the month. This figure suggests that more than one in three adults would go into debt, sell something, or be unable to pay an unplanned $400 expense, such as a car repair or medical bill. That proportion matched the 2019, pre-pandemic figure of 37 percent, which dropped to 36 percent in 2020 and 32 percent in 2021. These data suggest households, particularly those with few assets, may not have any remaining additional post-pandemic financial capacity from accumulated savings.[29]
These more difficult financial situations follow the expiration of key fiscal supports to New Hampshire households following the pandemic, including the end to enhanced food assistance for households, emergency rental assistance, continuous enrollment in public Medicaid health coverage, and the Earned Income Tax Credit, Child Tax Credit, and Child and Dependent Care Credit expansions enacted for Tax Year 2021 and provided on 2022 returns.[30]
Post-Pandemic Employment Shifts
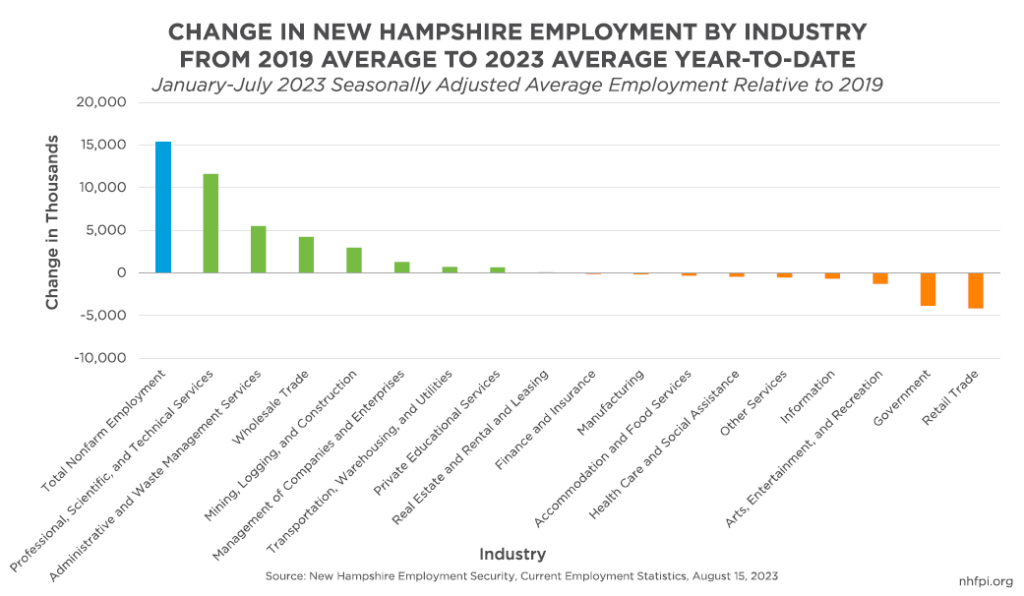
The employment recovery from the COVID-19 pandemic has been uneven. Certain industries in the state have recovered their employment losses since 2019 and increased jobs in their sectors beyond those levels. In 2023 so far, employment at New Hampshire establishments is substantially higher in the Professional, Scientific, and Technical Services industry, as well as in Administrative and Support Services and Waste Management, Wholesale Trade, and Mining, Logging, and Construction. However, total employment levels in Retail Trade, which includes in-person storefront staff, as well as Government and the Arts, Entertainment, and Recreation industries are still lower thus far in 2023 than they were in 2019. Retail Trade is the second-largest employment sector in the New Hampshire economy. Employment in Health Care and Social Assistance, the largest industry by employment, still remains below 2019 levels, as does Accommodation and Food Services employment.[31]
Concluding Discussions: Supporting Future Prosperity
Additional labor force growth in New Hampshire is very likely to be a prerequisite to advancing overall economic growth. Sectors of the economy that are likely to expand, such as health care and social assistance as more of the state’s population ages, will need to add workers to meet service needs.[32] Having a robust, well-educated workforce will likely be key for the growth of pre-existing employers and businesses in the state and for attracting new ones.[33]
While a significant portion of New Hampshire’s workforce constraint is likely due to residents who have reached a traditional retirement age leaving the labor force, the lack of access and affordability of both child care and housing are key constraints that can be more readily addressed by policy, such as some of the initiatives in the recently-enacted State Budget.[34] However, these constraints are significant, and will likely remain without further significant investment. Housing availability is key to continuing New Hampshire’s long-term strategy of importing workers from other states to support population and economic growth. Fulfilling child care needs may be keeping more adults from participating more fully in the workforce, and current estimates suggest the number of Granite State adults out of the workforce to care for children is larger than the total number of individuals who are unemployed and looking for work.
The economic health of households is critical to the economy. New Hampshire household financial security eroded at the same time that overall economic growth stalled in 2022. Key national metrics suggest savings accumulated during the pandemic are being, or have been, depleted. The average wage in the state appears to have fallen behind inflation relative to 2021 in the most recent annualized data. With a third of Granite State adults surveyed reporting that paying for usual household expenses is somewhat or very difficult, economic growth may be more likely to remain slow despite the favorable national environment. Providing targeted supports and making investments to expand opportunities for households to access key needs, including child care and housing, has the potential to substantially help New Hampshire’s residents and economy thrive.
Endnotes
[1] For more information about previous forecasts showing a recession, see New Hampshire Employment Security’s January 11, 2023 presentation Entering 2023: The Outlook for the New Hampshire Labor Market and Economy, slide 37. See also NHFPI’s February 24, 2023 webinar Examining the State Budget: Unpacking the Governor’s Proposal, slide 10 and the U.S. Congressional Budget Office’s July 26, 2023 report An Update to the Economic Outlook: 2023 to 2025.
[2] For more detail on these trends nationally, see the Economic Policy Institute’s March 2023 report Low-Wage Workers Have Seen Historically Fast Real Wage Growth in the Pandemic Business Cycle and the National Bureau of Economic Research March 2023 working paper The Unexpected Compression: Competition at Work in the Low Wage Labor Market. For longer-term considerations for income inequality, see the August 2022 U.S. Bureau of Labor Statistics working paper The Impact of COVID-19 on Labor Markets and Inequality.
[3] See the Congressional Research Service’s May 2022 report U.S. Economic Recovery in the Wake of COVID-19: Successes and Challenges. See also, generally, The Brookings Institution April 2022 book Recession Remedies: Lessons Learned from the U.S. Economic Policy Response to COVID-19. The Infrastructure Investment and Jobs Act and the Inflation Reduction Act, enacted in 2021 and 2022, respectively, also provide longer-term economic stimulus, but are not part of the relief and stimulus packages included in the federal response to COVID-19.
[4] For more information about the national economy in the summer of 2023, see the Center on Budget and Policy Priorities’ August 3, 2023 report Economy Remains Resilient Mid-Year.
[5] See the Federal Home Loan Bank of Boston’s Economic Update presentation to the New Hampshire House and Senate Ways and Means Committees on January 12, 2023. See also the Federal Reserve Bank of New York’s Global Supply Chain Pressure Index for July 2023.
[6] For more information on migration between states and counties in 2020 and 2021, see the U.S. Census Bureau’s March 24, 2022 resource New Data Reveal Continued Outmigration From Some Larger Combined Statistical Areas and Counties.
[7] The Northeastern United States includes Northeast region includes Connecticut, Maine, Massachusetts, New Hampshire, New Jersey, New York, Pennsylvania, Rhode Island, and Vermont. Starting in December 2017, the U.S. Bureau of Labor Statistics began to calculate an index for only the six New England states, including Connecticut, Maine, Massachusetts, New Hampshire, Rhode Island, and Vermont. Due to comparisons to 2015, this analysis uses the Northeastern Consumer Price Index-Urban, which dates to 1984. To learn more about this measure of inflation, see the U.S. Bureau of Labor Statistics’ resource page Consumer Price Index Overview Table – Northeast.
[8] For an explanation of median household income, see NHFPI’s June 28, 2018 interactive Municipal Median Household Incomes Compared to the State Median Household Income.
[9] These data may be revised in subsequent months, including after the annual benchmarking process is completed for Calendar Year 2023 in early 2024. See New Hampshire Employment Security’s data portal GraniteStats for access to these data and the Labor Force and Unemployment webpage for information about benchmarking.
[10] See the U.S. Bureau of Labor Statistics, The Economics Daily publication for August 25, 2023 titled 16 States Were at All-Time Low Unemployment Rates in July 2023.
[11] For more explanation of these different, expanded measures of unemployment, see the U.S. Bureau of Labor Statistics Table A-15, Alternative Measures of Labor Utilization and Alternative Measures of Labor Underutilization for States, Third Quarter of 2022 Through Second Quarter of 2023 Averages. For 2019 New Hampshire data, see Alternative Measures of Labor Underutilization for States, 2019 Annual Averages.
[12] For more details about these measures and examples of other uses, see the U.S. Bureau of Labor Statistics Job Openings and Labor Turnover Survey and the economic news release graphic Number of Unemployed Persons Per Job Opening, Seasonally Adjusted. Seasonally-adjusted data were also used in this analysis.
[13] To see more data detailing age demographics and the labor force, see NHFPI’s June 15, 2023 presentation Labor Force Trends in New Hampshire.
[14] For more information, see the Board of Governors of the Federal Reserve System’s March 3, 2023 Monetary Policy Report. In earlier, related research, U.S. Census Bureau data collected in 2021 did not show a significant net impact from the pandemic on retirement plans, although effects varied by group; see the U.S. Census Bureau’s September 19, 2022 publication Pandemic Disrupted Labor Markets but Had Modest Impact on Retirement Timing.
[15] For the full array of estimates for New Hampshire, see the Massachusetts Institute of Technology’s Living Wage Calculation for New Hampshire, which provides breakdowns by family size and composition. See also the technical documentation for the Living Wage Calculator 2022-2023 update.
[16] For New Hampshire costs, see Child Care Aware of America’s 2022 fact sheet Child Care Affordability in New Hampshire. To see Child Care Aware of America’s estimation methods, access the CCAoA’s Research Methodology webpage. See the definitions of family and center-based child care used in this analysis on Child Care Aware of America’s webpage Types of Child Care.
[17] For more on factors impacting child care and family decisions regarding access to child care, see the University of New Hampshire Carsey School of Public Policy April 12, 2023 webinar Coffee & Conversation: Challenges and Opportunities for NH Childcare Sector.
[18] To access the data used in these calculations, see the U.S. Census Bureau’s Household Pulse Survey Data Tables. The 16,800 figure is based on an average of New Hampshire data for weeks 49 through 60.
[19] See the New Hampshire Housing Finance Authority’s 2023 New Hampshire Statewide Housing Needs Assessment.
[20] For more information on the housing market in New Hampshire, see NHFPI’s August 10, 2023 post Housing Shortage Continues to Increase Costs for Granite Staters.
[21] See NHFPI’s February 21, 2020 presentation New Hampshire’s Demographics, Economy, and Access to Opportunity. See also Chart 3 in the University of New Hampshire Carsey School of Public Policy’s What is New Hampshire publication website, and the August 21, 2021 Fact Sheet New Census Data Reveal Modest Population Growth in New Hampshire Over the Past Decade.
[22] See the New Hampshire Housing Finance Authority’s July 2023 publication New Hampshire 2023 Residential Rental Cost Survey Report for more details.
[23] For more data on house and condominium sale prices, see the New Hampshire Association of Realtors FastStats data portal and NHFPI’s August 10, 2023 post Housing Shortage Continues to Increase Costs for Granite Staters.
[24] Read NHFPI’s August 10, 2023 post Housing Shortage Continues to Increase Costs for Granite Staters for more information on the state’s housing shortage.
[25] These data were collected from New Hampshire Employment Security’s GraniteStats portal, which offers private sector average wage estimates on a monthly basis for total nonfarm employment and high-level industry categorizations. Inflation-adjustments were completed using the U.S. Bureau of Labor Statistics Consumer Price Index-Urban for New England, which includes the six U.S. states directly east of New York State.
[26] For more information on these and other data, see NHFPI’s July 21, 2023 post Affording Household Expenses Remains Challenging for Many Granite Staters.
[27] See the Board of Governors of the Federal Reserve System, FED Notes October 21, 2021 publication Excess Savings During the Pandemic and NHFPI’s January 17, 2023 presentation New Hampshire State Revenues and the Economy.
[28] See the Board of Governors of the Federal Reserve System, FED Notes June 23, 2023 publication Accumulated Savings During the Pandemic: An International Comparison with Historical Perspective and the Federal Reserve Bank of San Francisco’s August 16, 2023 post Excess No More? Dwindling Pandemic Savings.
[29] For more information about household finances in New Hampshire, see NHFPI’s July 21, 2023 post Affording Household Expenses Remains Challenging for Many Granite Staters.
[30] To learn more about program changes, see the U.S. Department of Agriculture, Changes to SNAP Benefit Amounts – 2023; U.S. Department of Agriculture, State Guidance on Pandemic EBT; New Hampshire Department of Health and Human Services, Regular Medicaid Eligibility Operations Resume; New Hampshire Housing Finance Authority, Update on the NH Emergency Rental Assistance Program 6.15.2023; and NHFPI’s March 16, 2022 webinar Earned Income Tax Credit and Child Tax Credit: Impacts and Access in New Hampshire and March 4, 2022 Issue Brief Expansions of the Earned Income Tax Credit and Child Tax Credit in New Hampshire.
[31] Data drawn from the Current Employment Statistics survey of employers, accessed through New Hampshire Employment Security’s GraniteStats portal on August 25, 2023. For definitions of what is included in each of the sectors, see the U.S. Bureau of Labor Statistics webpage Industries at a Glance.
[32] For more information on care for older adults in the New Hampshire economy, see NHFPI’s July 18, 2022 publication Long-Term Services and Supports in New Hampshire: A Review of the State’s Medicaid Funding for Older Adults and Adults with Physical Disabilities.
[33] For additional discussions of business moves across borders, see NHFPI’s August 2, 2023 Issue Brief State Business Tax Rate Reductions Led to Between $496 Million and $729 Million Less for Public Services.
[34] For more information about the State Budget, see NHFPI’s June 9, 2023 post Senate Modifies State Budget Proposal, House Concurs with Senate Changes and Sends Budget to Governor and NHFPI’s June 12, 2023 webinar Examining the State Budget: Reviewing the Senate’s Proposal.