New data released on September 15 by the U.S. Census Bureau show that median household incomes rose and official poverty held steady in New Hampshire in 2021 compared to just before the pandemic. These data also show that more than one in four households had incomes below $50,000 in 2021, and that child poverty increased in New Hampshire relative to 2019, based on the official measure for poverty. However, a separate, more detailed dataset released by the Bureau on September 13 indicated that tax credits and other assistance, which are not accounted for in the official poverty calculations, helped cut the national child poverty rate nearly in half between 2020 and 2021. Combined, these two datasets suggest the impacts of the pandemic on lower-income households with children were significant and continued into 2021, but that pandemic-era income support programs and federal tax credits likely substantially helped families that otherwise would have been in poverty.
New Hampshire Child Poverty Rises Relative to Pre-Pandemic Levels
Poverty is measured based on income, and the U.S. Census Bureau calculates new official poverty thresholds each year, adjusting for inflation and the size and composition of a household. In 2021, the poverty rate for a single individual under 65 years old was $14,097 per year, while for a household with two adults and one child, annual income must be below $21,811 for the household to be in poverty.
Approximately 97,000 Granite Staters were in poverty in 2021, and the statewide official poverty rate was 7.2 percent. New Hampshire’s official poverty rate in 2021 remained statistically unchanged from 2019, the most recent year for which directly comparable data are available due to pandemic disruptions affecting 2020 data collection for this survey.
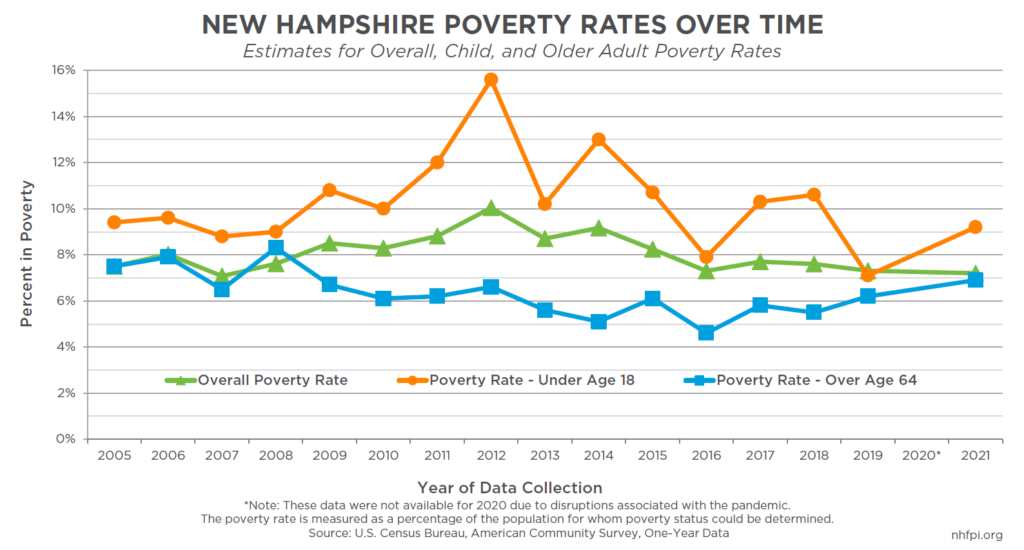
However, the child poverty rate increased between 2019 and 2021, rising from about 7.1 percent in 2019 to 9.2 percent in 2021. About 23,000 Granite Staters under 18 years old lived in poverty.
About 18,000 older adults in New Hampshire were in poverty in 2021 as well. Although the point estimate for the poverty rate for adults age 65 years and older edged up from 6.2 percent to 6.9 percent between 2019 and 2021, the change was not statistically significant, meaning there are not enough data collected in the survey to say with a high degree of confidence that there are actually more older adults in poverty in 2021 than in 2019.
Median Household Incomes Outpace Inflation in New Hampshire
Median household income in New Hampshire rose in 2021 relative to 2019, even after adjusting for inflation between the two years. Median household income in New Hampshire, or the amount at which half of households in the state have lower incomes and half have higher incomes, was estimated to be about $88,500. This increase is substantial relative to the estimated 2019 median household income of $77,900, which would be about $82,000 in inflation-adjusted 2021 dollars.
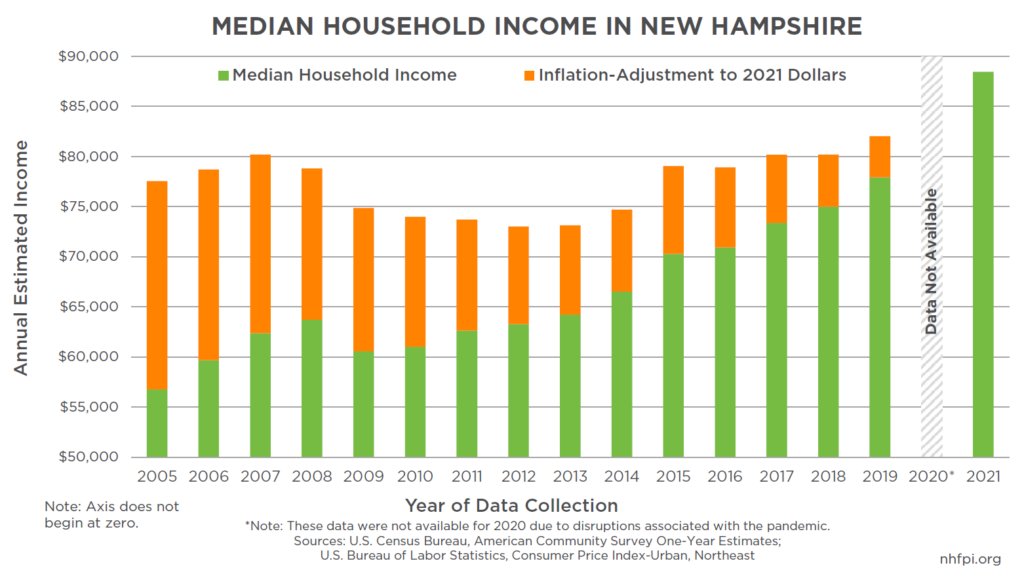
This increase shows the recovery from the pandemic is reaching more middle-income households much faster than the long, slow recovery from the Great Recession, likely due in part to significant public supports both directly for people and for the economy overall since the pandemic began.
However, even with this boosted median income, more than one in six New Hampshire households had annual incomes below $35,000 in 2021, and more than one in four had incomes below $50,000. The average income for households in the bottom 20 percent of households sorted by income was about $21,300, up about 12.1 percent from $19,000 in 2019 without adjusting for inflation, while the top 20 percent of households saw their average incomes rise from $241,900 to $264,300, or about 9.3 percent, in the same time period.
National Data Provide Insights Into Changes
On September 13, two days earlier than the state-level data release, the U.S. Census Bureau also published the results of a separate dataset, collected through a different survey, that offers more insights into the reasons for changes in income and poverty at the national level. While these detailed data are not available for New Hampshire specifically for 2021, some of those national trends likely reflect factors in the shifts in state-level data, particularly those related to federal policies. Accounting for these federal policies, poverty fell substantially nationwide in 2021 relative to 2020, and the child poverty rate was nearly cut in half.
The U.S. Census Bureau publishes two poverty estimates. One estimate, the Official Poverty Measure (OPM), is rooted in research from the 1950s and 1960s and is calculated based on income relative to the cost of food. This measure is adjusted for inflation annually, but is unadjusted for income resulting from tax refunds and certain other support programs, such as food assistance.
Since 2011, the U.S. Census Bureau has also been publishing the Supplemental Poverty Measure (SPM). The SPM takes into account income from tax credits, food assistance programs, housing subsidies, and other assistance, as well as expenses such as certain child care, housing, utility, and health care costs. The Bureau has SPM estimates dating back only to 2009, and only limited state-level data for the SPM.
Based on the OPM, both the poverty rate and the number of people in poverty nationally were statistically unchanged between 2020 and 2021, with the 2021 estimates showing 37.9 million U.S. residents in poverty, an estimated 11.6 percent of the population. However, the national poverty rate for children did change in a statistically significant manner between 2020 and 2021, falling 0.7 percentage points to 15.3 percent; it increased for adults age 65 years and older, rising 1.4 percentage points to 10.3 percent, while remaining the same for adults age 18 to 64 years.
However, the national SPM data show very substantial changes. The overall SPM poverty rate declined for the third year in a row, falling to 7.8 percent, the lowest on record for the SPM. The SPM child poverty rate fell 4.5 percentage points, from 9.7 percent to 5.2 percent. That 46.4 percent reduction in the child poverty rate results from about 3.367 million fewer children in poverty nationwide than the 7.196 million children estimated to be in poverty in 2020, based on the SPM. There were also approximately 58.6 percent fewer children in poverty by this measure in 2021 than in 2019.
Refundable tax credits, including the Child Tax Credit, comprised the largest single contributor to the reduction in child poverty for children. The SPM estimated that about 5.3 million people, including 2.9 million children and specifically 1.0 million children under age 6, were lifted out of poverty by the Child Tax Credit in 2021. About 2.1 million children were kept out of poverty specifically by the expansion to the Child Tax Credit created by the American Rescue Plan Act. The Child Tax Credit also boosted incomes for households with children who were near poverty.
The Economic Impact Payments of $1,400 per individual below certain income thresholds funded by the American Rescue Plan Act also contributed significantly to the decline in poverty as measured by the SPM, which would not have been directly incorporated into the OPM.
Nationally, median household income was statistically unchanged between 2020 and 2021 after adjusting for inflation, with the median household income estimated to be $70,784 in 2021. However, pre-tax income inequality increased between 2020 and 2021. This increase was primarily driven by a relative drop in incomes for households with lower incomes, relative to 2020, while higher income households retained their incomes, after adjusting for inflation. However, the change in income inequality was no longer statistically significant after taxes, including refundable tax credits, were incorporated into the calculations. According to the U.S. Census Bureau, this increase in pre-tax income inequality was the first statistically significant increase since 2011, and also shows the extent to which the tax code can help alleviate income inequality.
Federal Aid Helped Offset Pandemic Impacts
While detailed data provided by the national-level SPM analysis are not available for New Hampshire, the Bureau does estimate topline SPM poverty rates at the state level by aggregating three years of data. New Hampshire’s SPM dropped between the pre-pandemic 2017-2019 period and the 2019-2021 period data, from 8.3 percent to 5.5 percent. Across those same periods, the OPM held steady in data collected from the same survey, suggesting that public policies during the pandemic helped reduce New Hampshire’s SPM as it did nationally.
Such impacts were forecast after the enactment of the expanded Child Tax Credit, including the advance monthly payments made in 2021. Two separate analyses estimated that either about 8,000 or 11,000 Granite State children would be lifted out of poverty by the expanded, but currently expired, Child Tax Credit.
The estimated increase in the child poverty rate in New Hampshire between 2019 and 2021 based on the OPM, which did not account for key aid programs and tax credits, suggests that financial hardship for children would have increased without these programs. This key, targeted relief likely provided critical assistance to Granite Staters in 2021, lifting children out of poverty and helping New Hampshire families make ends meet.
– Phil Sletten, Research Director