The official estimate of poverty at the state-level indicated that New Hampshire had the lowest rate of poverty in the nation in 2019. While disruptions from the pandemic resulted in insufficient data collected to provide reliable official state poverty estimates for 2020, comparisons between different measures of poverty from before the pandemic indicate that, when accounting for region-specific challenges such as higher housing costs, New Hampshire may not have had the lowest levels of poverty in the nation. Alternate measures of poverty account for a wider array of expenses and sources of income, while the official measure of poverty was developed to estimate poverty by comparing an individual’s or family’s income only to the cost of food expenses.
How Official Poverty is Measured
The formal estimate of the number of people in poverty, as measured and defined by the United States Census Bureau, is the Official Poverty Measure (OPM). This estimate was developed in the 1960s and measured poverty by comparing the cost of food to the income of an individual or family. The threshold for poverty was set as an individual’s or family’s pre-tax income of less than three times the total food cost of a minimum diet, as determined by the United States Department of Agriculture, when the measure was established in 1965. Since then, adjustments have been made yearly to account for inflation using the Consumer Price Index for all items. The poverty thresholds are adjusted for the size of a family as well. While it is the official measure, this poverty metric does not account for geographic differences within the contiguous United States, other sources of support through public assistance, or other expenses beyond food.
At the state-level, data used to calculate the official estimate of poverty are collected by the United States Census Bureau’s American Community Survey (ACS). Due to challenges in collecting sufficient data during the pandemic, the traditional estimates calculated from the ACS for 2020 will not be released. In 2019, the official estimated level of poverty in New Hampshire was 7.3 percent, which was lower than any other state in the nation, based on state-level estimates from the ACS.
At the national level, data to calculate the official poverty level is compiled through the United States Census Bureau’s Current Population Survey, Annual Social and Economic Supplement (CPS-ASEC). The CPS-ASEC asks a broader range of questions about income and provides more comprehensive data from which to draw estimates. This survey is also typically conducted with live interviews over the phone or in person. However, this survey has a smaller sample size in each state, resulting in the recommendation from the United State Census Bureau to use the ACS for official state-level estimates and comparisons for a single year period. In 2019, the national estimate for the official poverty level was 10.5 percent using the CPS-ASEC.
Alternate Measures of Poverty at the State Level
The methodology behind the official measure of poverty relies heavily on income relative to the cost of food. While food expenses were the most significant cost facing families during the 1960s, other expenses make up more significant portions of the budgets of individuals and families today. The Supplemental Poverty Measure (SPM) utilizes a different estimation methodology and includes additional factors and adjustments when compared to the official measure of poverty.
The SPM was developed in 2011, and factors in additional sources of income and in-kind support, along with additional expenses beyond food. The SPM also broadens the definition of a family beyond those only related by birth, marriage, or adoption, and includes unrelated children living in the same residence, foster children, and unmarried partners and their relatives. The SPM factors income and benefits from sources beyond employment income, and includes other forms of income or aid such as nutritional assistance, housing subsidies, and energy assistance. Moreover, the SPM factors in additional expenses, including taxes, expenses related to work, child care, child support payments, shelter costs, utilities, and medical expenses. There are also regional adjustments as well, accounting for the variations in housing expenses in different parts of the county and within states.
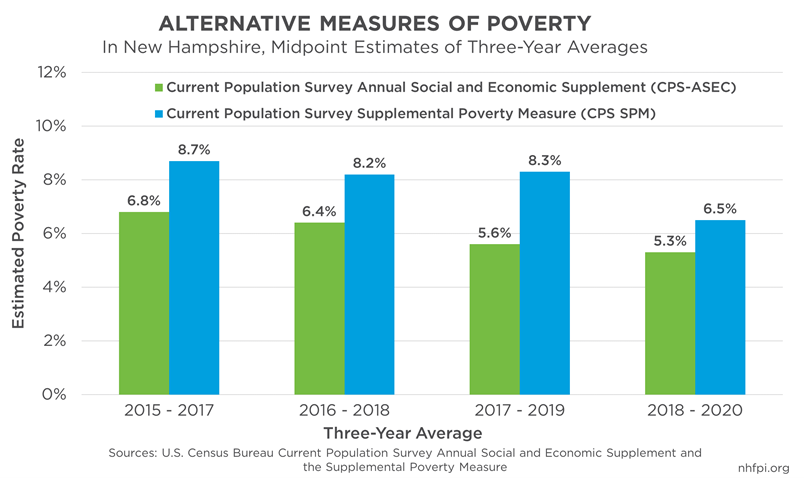
The SPM is derived from the more detailed data provided by the CPS-ASEC. To compensate for the smaller sample sizes of the Current Population Survey, three-year estimates must be used when analyzing or comparing SPM estimates at the state-level, especially for smaller states. During 2017-2019, the three-year period before the COVID-19 pandemic, the SPM estimate for New Hampshire was 8.3 percent. The most recent data covering the years of 2018-2020 saw a significant decrease in the New Hampshire SPM to 6.5 percent, likely due to this measure capturing significant additional aid that families and individuals received during the pandemic. The CPS-ASEC can also be used to estimate poverty at the state-level using the official estimate methodology, and must be averaged over a three-year period as well.
Comparing Measures of Poverty
The methodology implemented by the SPM results in slightly different poverty estimates compared to those calculated via the official poverty measure. Since the more recent inception of the SPM, measures of the official state-level estimate through the ACS, the three-year state-level estimates through the CPS-ASEC, and the three-year state-level estimates of the SPM have all trended in a similar manner over time. However, the SPM estimates a slightly higher level of poverty nationally and in New Hampshire before the pandemic. This adjustment is not directionally the same in all areas of the country. In some states, the SPM estimate is lower than the official estimate, while in others it is higher. In New Hampshire, the most recent pre-pandemic estimates show that the SPM calculated a higher level of poverty than the traditional official rate. Additionally, when comparing estimates of the SPM at the state-level, New Hampshire did not have the lowest level of poverty in the nation prior to the pandemic. Six other states, including Iowa and Minnesota, had lower midpoint estimates for levels of poverty according to the SPM. This difference is likely due to geographic adjustments for housing in the SPM and inclusion of other expenses, which are designed to provide a more complete and current estimate of poverty at the state-level.
Accounting and adjusting for other significant costs that individuals and families face shows that New Hampshire’s lowest poverty rate in the nation may not reflect the relative cost of living for people with very low incomes or with more limited means. Analysis of poverty, and comparisons of poverty between regions and states, should consider a variety of estimates that factor additional types of expenses, and regional differences in those expenses, to develop a more complete view of the magnitude of poverty in New Hampshire and other states.
– Michael Polizzotti, Policy Analyst