NHFPI recently published a Fact Sheet showing the U.S. Census Bureau’s American Community Survey (ACS) estimates for counties and municipalities in New Hampshire. These one-year data provide snapshot estimates of economic indicators in the state’s counties for data collected in 2016. As they are only one-year data and rely on small sample sizes, they are less reliable than other samples, including data covering a five-year window to be released in December, at providing an accurate estimate for key indicators. However, these data provide more timely estimates of people’s income and poverty status in different parts of the state, and offer insights into the directions these indicators are moving and areas of concern. These data also offer continued evidence of some longstanding economic disparities in the state, with pockets of both potentially good and troubling news, which will require more research to confirm but deserve highlighting for researchers and policymakers to monitor. This post seeks to highlight some of the key takeaways from these one-year estimates and explain some of the technical details, particularly around margin of error, that are important for interpreting these data.
Key Themes from the October Release
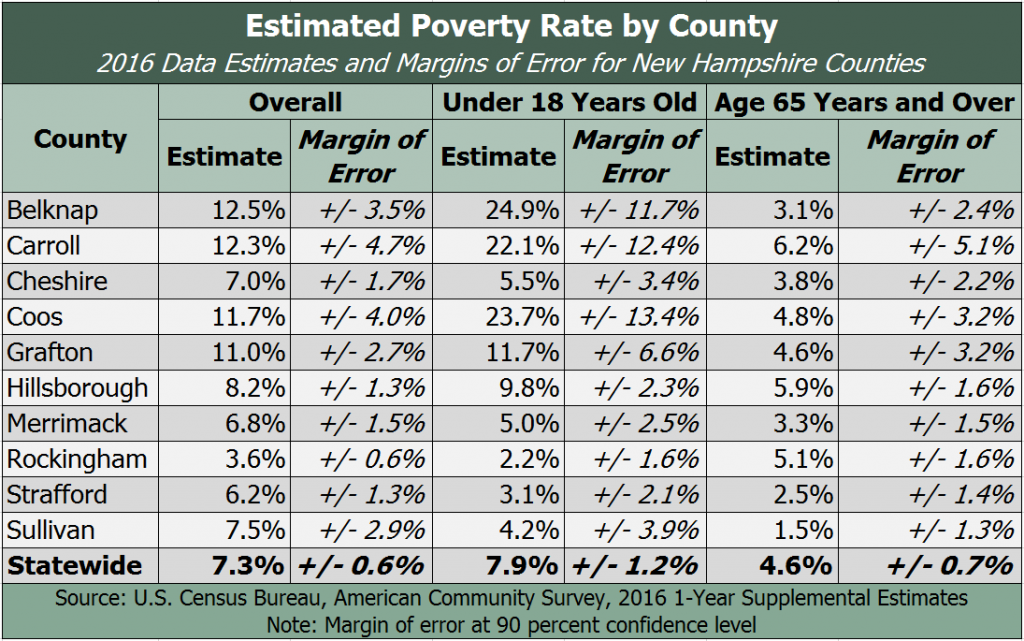
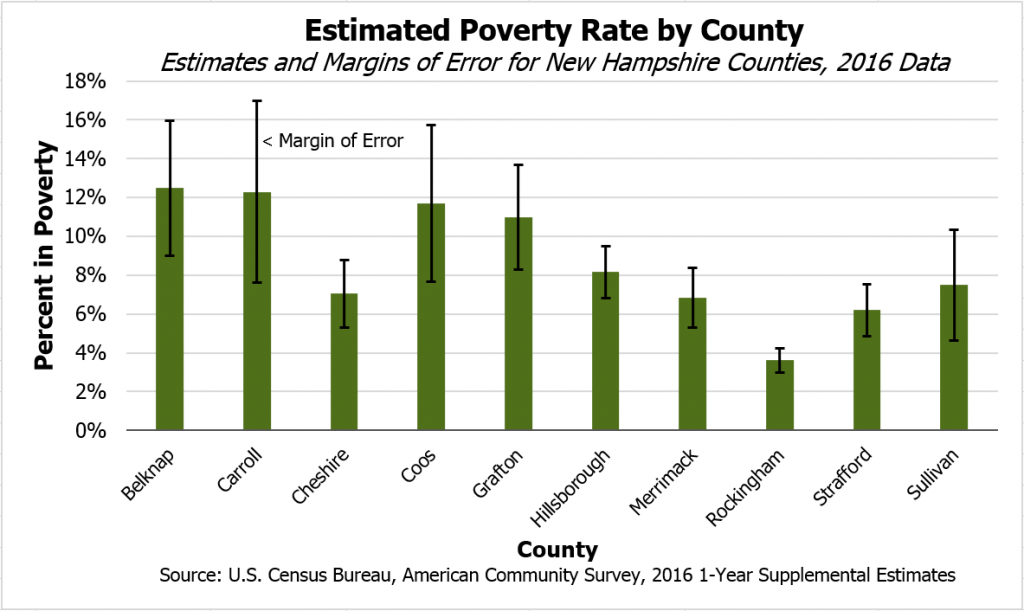
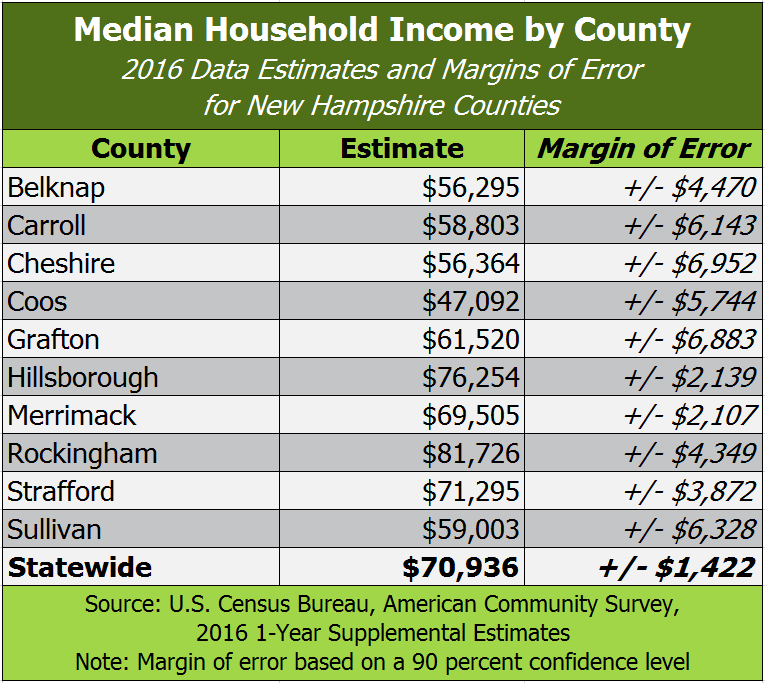
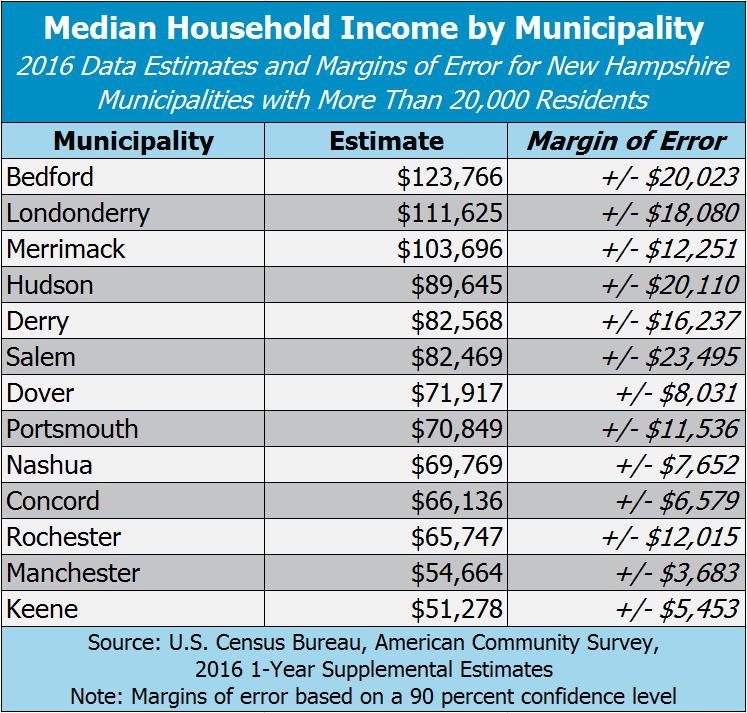
The broadest theme of these county-level ACS data is the disparity between the southeastern portion of the state, particularly the more urban counties, and the rest of the state. The wide gap in estimated median household income, particularly between Rockingham County’s $81,726 and Coos County’s $47,092, should continue to be of concern. The difference in estimated poverty rates, such as between Rockingham County’s 3.6 percent and Belknap County’s 12.5 percent, indicate additional broad disparities that have implications for state policy. These data also provide general insight into the health of the economy in different regions of the state, as the four northernmost counties have the highest estimated poverty rates. Although these estimates all have margins of error around them, the relatively large differences that are well outside of the margins of error and are statistically significant should be the most noteworthy items from this release. (For more on margin of error and statistical significance, please see the subsequent sections.) These differences across counties also mask differences among municipalities; Bedford and Manchester, neighboring municipalities within Hillsborough County, have very different estimated median household incomes, at $123,766 and $54,664, respectively. Again, while margins of error exist around these estimates, the disparities are quite large, and have potential implications for public policy. These one-year estimates provide more evidence that Granite Staters in different counties, or even neighboring municipalities, may have vastly different economic experiences and opportunities.
At an individual county level, a key takeaway is that more areas of the state are continuing to benefit from the economic recovery, but the benefits appear to be uneven. The 2016 data sample appears to offer good news for Coos County, with a statistically significant increase in median household income relative to the 2015 data, and a statistically significant decrease in the poverty rate. While the news may be good for Coos County, Belknap County saw a statistically significant increase in its poverty rate and a statistically significant decrease in median household income. Note that, even with these statistically significant changes, there is still a chance these changes shown in data are due only to differences in the sample and are not actual changes in the true median household income or poverty rates in Coos or Belknap Counties. However, these are the best data currently available from the ACS, and they may also indicate real changes in the economic well-being of the population.
The following sections offer critical information about these data and how to best understand and use them.
Margin of Error
The ACS samples households throughout the year on an annual basis, and uses those samples to provide estimates about the entire population. During 2016, the ACS sampled 23,555 individuals and 10,787 housing units in New Hampshire. While this is a much larger sample than is usually employed in public opinion polling (although they are not directly comparable for a variety of reasons), it is not a census, and thus the averages and medians presented are only estimates of the true average or median for the population. As the sample size shrinks, the confidence that the true average or median for the population is near to the average or median calculated using the sample declines. That confidence is expressed by a margin of error, which is larger if the sample size is smaller, as the researchers are less confident that the sample captured enough of a population to accurately reflect the true average or median for the population.
For example, NHFPI’s September 28 statewide data Fact Sheet using data from the ACS identifies median household income in New Hampshire at $70,936. The margin of error is plus or minus $1,422. The ACS uses a confidence interval of 90 percent to calculate the margin of error, so researchers can be 90 percent confident that the actual median household income in New Hampshire is between $69,514 and $72,358. (Note that different samples also have different potential nonsampling error, and different surveys can produce a wide variety of estimates; see NHFPI’s blog post on differing estimates of median household income for more.)
However, as shown in NHFPI’s October 19 county data Fact Sheet, smaller jurisdictions with fewer sampled households are subject to wider margins of error. Belknap County has an estimated median household income of $56,295 based on the 2016 ACS data, but a wider margin of error of plus or minus $4,470, giving the reader an estimated 90 percent confidence that Belknap County’s actual median household income was between $51,825 and $60,765. A smaller geography with lower population, such as Bedford, shows wider still margins of error; Bedford had an estimated median household income of $123,766, but we can only say with 90 percent confidence that the true median household income for Bedford is between $103,743 and $143,789.
A 90 percent confidence interval shows the range at that level of certainty, but there is still a one in ten chance the actual average or median value falls outside of that range.
Statistical Significance
To compare two different estimated values, the U.S. Census Bureau uses a test of statistical significance to identify differences between geographies and within the same year across geographies. This formula is different than simply using the margin of error, but seeks to provide the same 90 percent confidence that two estimates represent different averages or medians in the underlying population. For example, when measuring any change in the poverty rate in Belknap County between the 2015 data and the 2016 data, the estimate of the poverty rate increased from 8.0 percent to 12.5 percent, while the estimates for Carroll County increased from 7.8 percent to 12.3 percent. The statistical significance test incorporates the margin of error and identifies, with 90 percent confidence, whether the true population average or median shifted in a direction or not. For Belknap County, the change between the 2015 and 2016 survey data indicated that there was a statistically significant increase in the poverty rate, while for Carroll County, even though the estimate change was the same magnitude, the change in the poverty rate was not statistically significant; so, there is not 90 percent confidence, based on these data, that the poverty rate in Carroll County increased.
An additional important note about the data collection: The 2016 data estimates are drawn from the survey data collected throughout the year during 2016. As such, an individual surveyed in January 2016 would provide information on their income from the last twelve months, which would be during 2015, while an individual surveyed in December 2016 would be primarily providing data from 2016.
ACS Data Releases and Tradeoffs
The U.S. Census Bureau offers a wide variety of datasets, and the ACS includes separate data releases. The September one-year estimates release, which NHFPI discussed in an earlier post and statewide data Fact Sheet, provided data for jurisdictions greater than 65,000 people, which included six of New Hampshire’s ten counties and two municipalities. The October one-year supplemental estimates release, discussed in NHFPI’s October 19 county data Fact Sheet, included estimates for geographies with populations greater than 20,000 people, but was based on the same survey data, so it did not offer more accuracy but only more detail.
In December, the ACS five-year estimates will be released. These data will provide estimates for most jurisdictions (including municipalities, county subdivisions, and Census Tracts) and be the most reliable, having the largest sample size of any of the ACS releases. However, while the one-year estimates provide the most recent ACS data available, the five-year ACS releases are the least current; this December’s release will include data from the years 2012 through 2016.
All these datasets have different appropriate uses. The major tradeoff between using one-year estimates and five-year estimates is between timeliness and accuracy. The one-year data provide the most current data, but are not as reliable, because the ACS has only been able to collect data during that year, and the sample sizes are smaller. The five-year data is more reliable and provides smaller margins of error because of five years’ worth of samples collected. However, it is also less timely, and while it shows long-term trends very well, it is not an early indicator of demographic or economic changes. New Hampshire’s economy was substantially different in 2012 than in 2016, for example, but the five-year data release will include data sampled from individuals in 2012.
The one-year data and the five-year data offer different types of insights into the surveyed population of the state. The one-year estimates may help detect demographic trends earlier than the five-year estimates, and the five-year estimates offer more certainty around estimated values, such as median household income or the poverty rate, for the five-year periods they cover. Both are useful, but the limitations on their uses are important for understanding the data.
What Do These Technical Caveats Mean?
While these one-year ACS 2016 data have limitations and only certain levels of confidence associated with them, they provide a snapshot into the demographics and economic well-being of the state. The one-year estimates released this month do not signal paradigm shifts or massive changes with great certainty. However, where statistically significant changes have occurred, observers should be prepared to track additional data and see if the indications seen in these one-year estimates become trends that should help shape policy.