Throughout New Hampshire, children of families facing income challenges have more limited access to many key opportunities than their peers in higher-income households. Free and reduced-price meal programs, which use low household incomes or certain other criteria to determine eligibility, provide detailed data on a local level that offers insight into the financial security of children and their families. Analyzing eligibility and use data for these programs contributes to enhanced understanding of the geographic and demographic characteristics of children likely facing challenges from limited incomes at home. These data can help identify communities and populations that would most benefit from increases in public supports and services, and which investments might best help create more equitable access to opportunity.
Income-based barriers to opportunities are not evenly distributed among New Hampshire’s population, and racial identity correlates with these limitations. U.S. Census Bureau survey data show Black, Hispanic, and multiracial New Hampshire residents have been more likely to be in poverty than white Granite Staters.[1] New Hampshire Department of Education data indicate that inequities found in the overall population persist among children in more recent data, which may have significant implications for students of color. These students constitute a growing portion of the overall student population and are key to New Hampshire’s future workforce.[2] The school-based food assistance program data suggest that Black students and Hispanic students were more than twice as likely to be from households with near or below poverty-level incomes as white students in the year prior to the pandemic. Native American and multiracial students were substantially more likely than white students to experience these low incomes at home as well, and Asian students have a similar likelihood as white students of living in a household with incomes low enough to qualify for this assistance. New Hampshire’s students of color and low-income students are distributed throughout the state geographically. About one in four low-income students were enrolled in the Manchester and Nashua school districts combined, and two-in-five students of color attended those districts, but the remaining students in each of these categories were in communities throughout the rest of the state.
This Issue Brief analyzes New Hampshire free and reduced-price meal eligibility data to provide insight into the geographic and demographic composition of children and families with low incomes in the state. This Issue Brief also discusses changes in student enrollment and determined eligibility during the pandemic. The Issue Brief highlights the potential use of these data to identify areas of need and guide the deployment of public resources, including federal funds made available by the American Rescue Plan Act, to support equitable access to opportunities for all New Hampshire children and to bolster the economic recovery.[3] The analyses offer understanding as to the extent that inequities in opportunity in New Hampshire exist, including variations by geography and race, and indicate key areas of potential investment to support an inclusive recovery from the COVID-19 crisis.
About These Data and Metrics
New Hampshire’s Department of Education and local schools collect student demographic and family income information associated with eligibility for federal programs that support free and reduced-price school meals for students. These programmatic data, which are used in this Issue Brief, differ in scope and methodology from U.S. Census Bureau survey data that rely on statistical sampling and provide estimates for income and demographic data for the entire population. These Department of Education data are based on counts of program participants and those found eligible to participate, rather than a sampling used to generate estimates for a larger population.
Families of students must take some action to be recognized as eligible for these programs, such as applying directly for the assistance or becoming automatically verified due to their participation in another assistance program. Because action is required on the part of individuals to be counted in these data, the data offer an incomplete understanding of student household incomes due to likely undercounts, as eligible families may not apply for the program or make their eligibility known. However, these data provide a significantly higher degree of geographic granularity at the school-district level than the U.S. Census Bureau’s survey data.[4]
The New Hampshire Department of Education measures instances of eligibility determination for students, rather than only enrollment. In the October 1, 2019 student enrollment counts, the Department of Education reported approximately 3.3 percent of students determined to be eligible for free and reduced-price school meals were not enrolled in the programs to receive those meals; however, because school districts were aware that these students were eligible, they were counted as eligible. This Issue Brief refers to all known eligible students, whether they are enrolled or not, as eligible.[5]
To be eligible for free or reduced-price school meals, a student must meet one of the following criteria:
- live in a household with an income below 185 percent of the federal poverty guidelines, or $40,182 for a three-person household in the 2020-2021 school year
- receive benefits through the Supplemental Nutrition Assistance Program (SNAP, also known as the Food Stamp Program in New Hampshire), Temporary Assistance for Needy Families, or a federal food distribution program primarily for households on Native American reservations
- be a foster child under the legal responsibility of a foster care agency or court
- participate in their school’s Head Start program
- match certain program definitions of children who are homeless, runaways, or migrants[6]
As with the free and reduced-price meal program, SNAP’s income eligibility limitation in New Hampshire is 185 percent of the federal poverty guidelines.[7] While students may be directly certified for free and reduced-price meal eligibility due to their participation in other programs such as SNAP, New Hampshire Department of Education data show that, in the 2019-2020 school year, more than 95 percent of students determined as eligible were identified as the result of an application from the parent or guardian, without use of other eligibility pathways, or in combination with direct certification to determine eligibility.[8]
Analyses in this Issue Brief are based on October 1 snapshots of student enrollment and free and reduced-price meal eligibility in 2018, 2019, and 2020, and most analyses are based on 2019 data, prior to the impacts of the pandemic on student enrollment. Racial categories are defined by the Department of Education and are mutually exclusive; unlike U.S. Census Bureau data, no distinction is made between race and ethnicity, and all students are each identified in only one racial category.[9]
Student Free and Reduced-Price Meal Eligibility by Race
Statewide free and reduced-price school meal eligibility show significant differences by race, reflecting variations in the likelihood of a student growing up in a household with a low income. As of October 1, 2019, 24.8 percent of all public school students were identified as eligible for free and reduced-price school meals. The proportion of all students eligible for free and reduced-price school meals was lower for white pupils, with 21.5 percent eligible, and Asian students, with 19.1 percent eligibility.
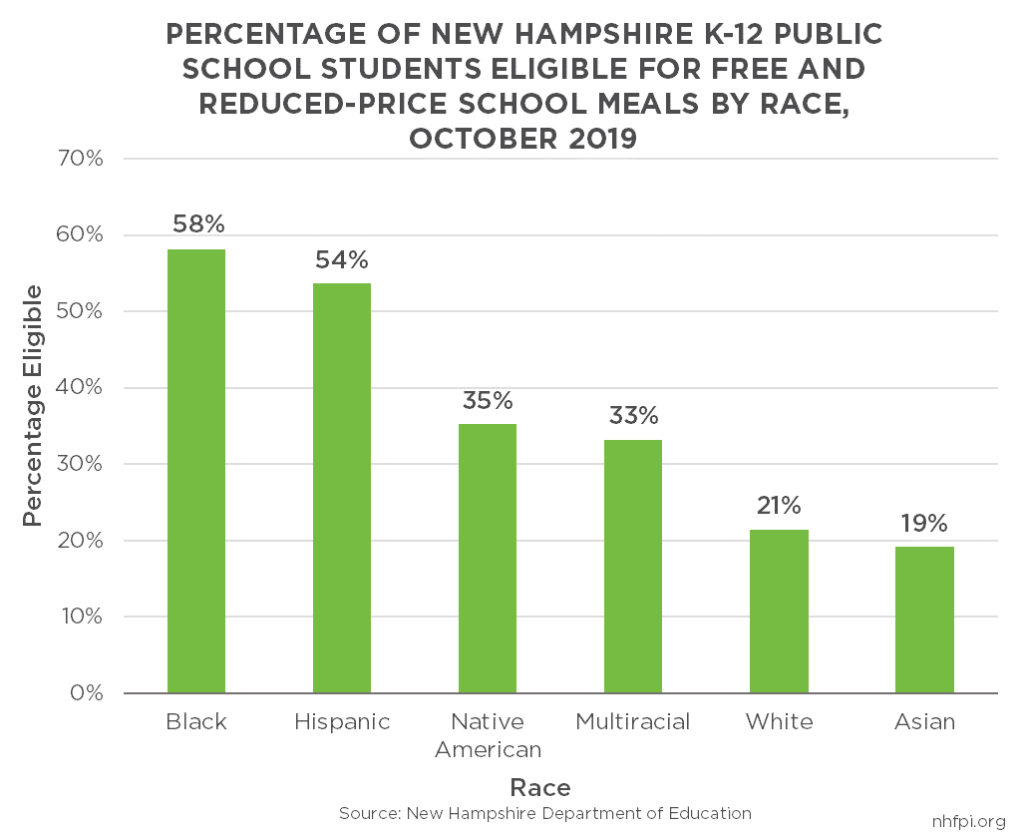
However, the rate of free and reduced-price meal eligibility for other racial groups was substantially higher. About 33.2 percent of multiracial students were eligible for free and reduced-price school meals, and 35.2 percent of Native American students were eligible. Hispanic and Black students statewide had the highest percentages eligible, with more than half of each group eligible for free and reduced-price school meals. About 53.7 percent of Hispanic students were eligible for free and reduced-price school meals statewide, and 58.1 percent of Black students were eligible; these students were more than two-and-a-half times more likely to be eligible than white students.
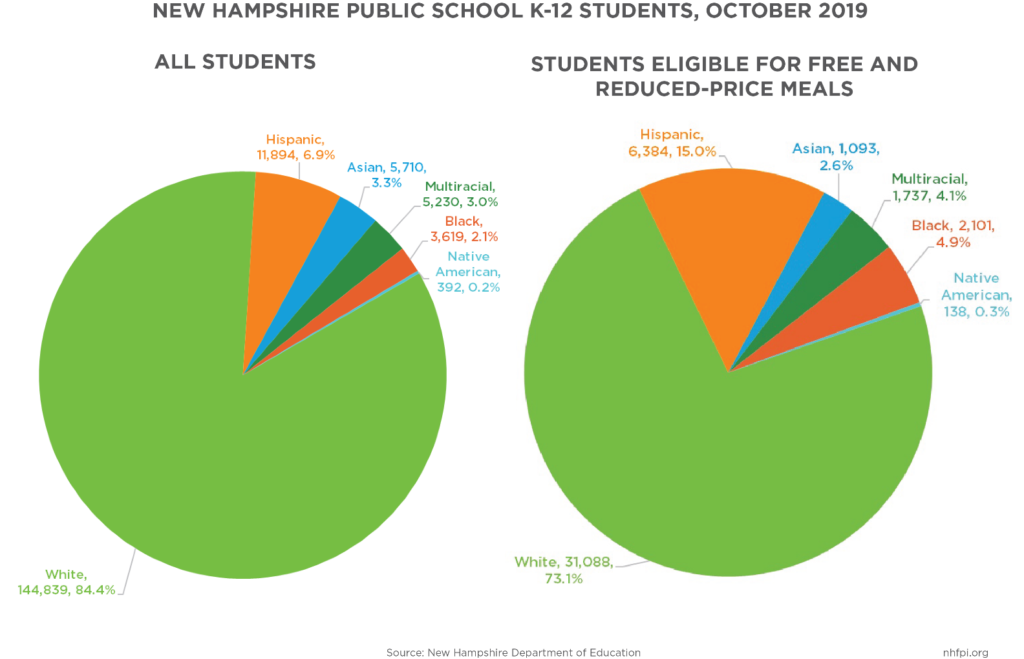
Students of color comprised about 15.6 percent of all students in the October 2019 enrollment data, but were 26.9 percent of all students eligible for free and reduced-price school meals. The percentages of free and reduced-price meal-eligible students who were Black and Hispanic were more than double the percentages of Black and Hispanic students in the populations as a whole. These data indicate that many students of color are disproportionately likely to be disadvantaged due to having low incomes at home relative to white students.[10]
Students Statewide by Race and Geography
New Hampshire’s students of color are geographically distributed throughout the state, as are New Hampshire’s students living in low-income households. The largest school districts included significant percentages of the state’s overall student population, free and reduced-price school meal-eligible students, and students of color. However, majorities of all three groups lived outside of the state’s two largest cities and were dispersed across many other municipalities and school districts; these data suggest both racial and economic diversity are common in both urban and rural school districts.
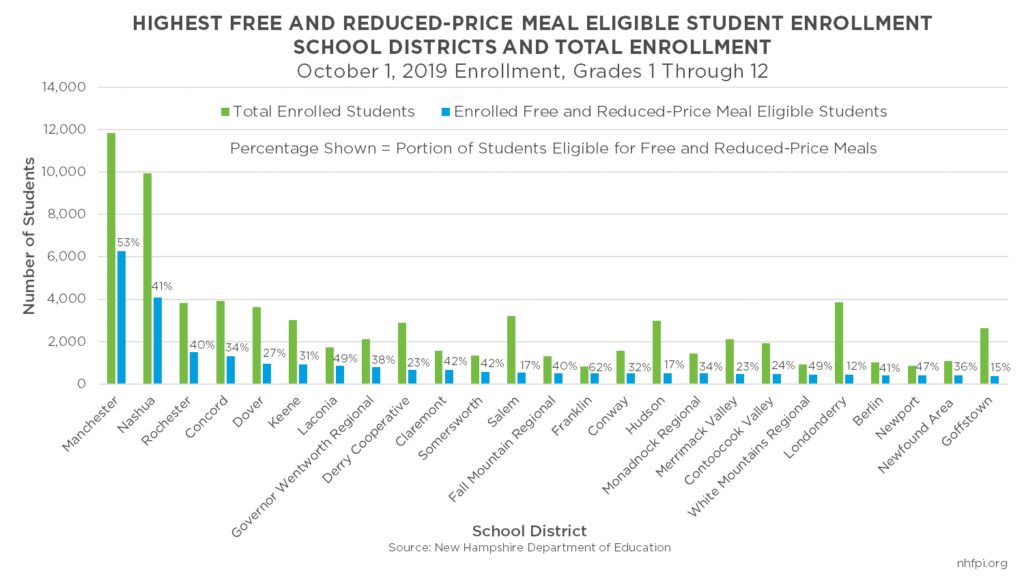
The graph below shows school districts with the highest levels of overall enrollment, as well as the number of students found eligible for free and reduced-price school meals and the percentage of all students eligible for free and reduced-price school meals, ordered with the greatest overall enrollment school district first.[11] The Manchester School District, which serves the largest city in the state, had the highest enrollment of any New Hampshire school district, with 11,831 students enrolled on October 1, 2019, and also had the highest number of free and reduced-price meal eligible students enrolled (6,260 students, or 53 percent of all students). The Nashua School District, serving the state’s second-largest city, had enrollment of 9,925 students on the same date, and 4,076 students (41 percent of all students) eligible for free and reduced-price school meals. A much smaller community, Bedford, had the third-highest enrollment school district with 4,196 students, only 177 (4 percent) of whom were eligible for free and reduced-price school meals. The Concord School District, serving most of the state’s third largest city, had the fourth-highest enrollment, with 3,920 students total and 1,320 (34 percent) eligible for free and reduced-price meals.
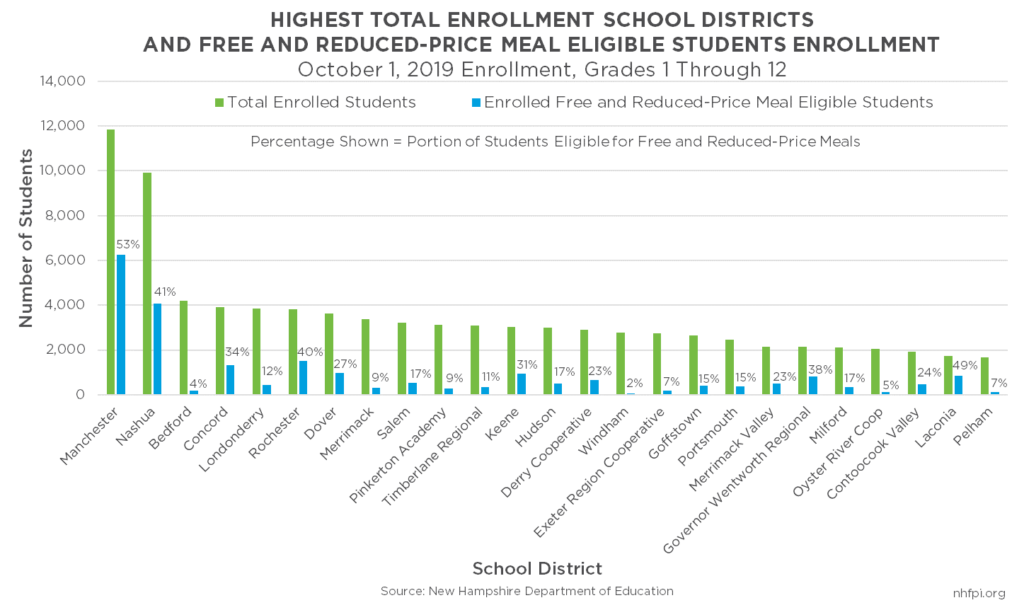
The portion of students eligible for free and reduced-price meals varies widely by school district, with differences between both urban and rural districts. The nine largest school districts in the state directly serve seven of the nine most populous municipalities in the state, and include cities in both the Merrimack River Valley and near to the Seacoast, as well as high-population towns in the more suburban, southern part of the state.
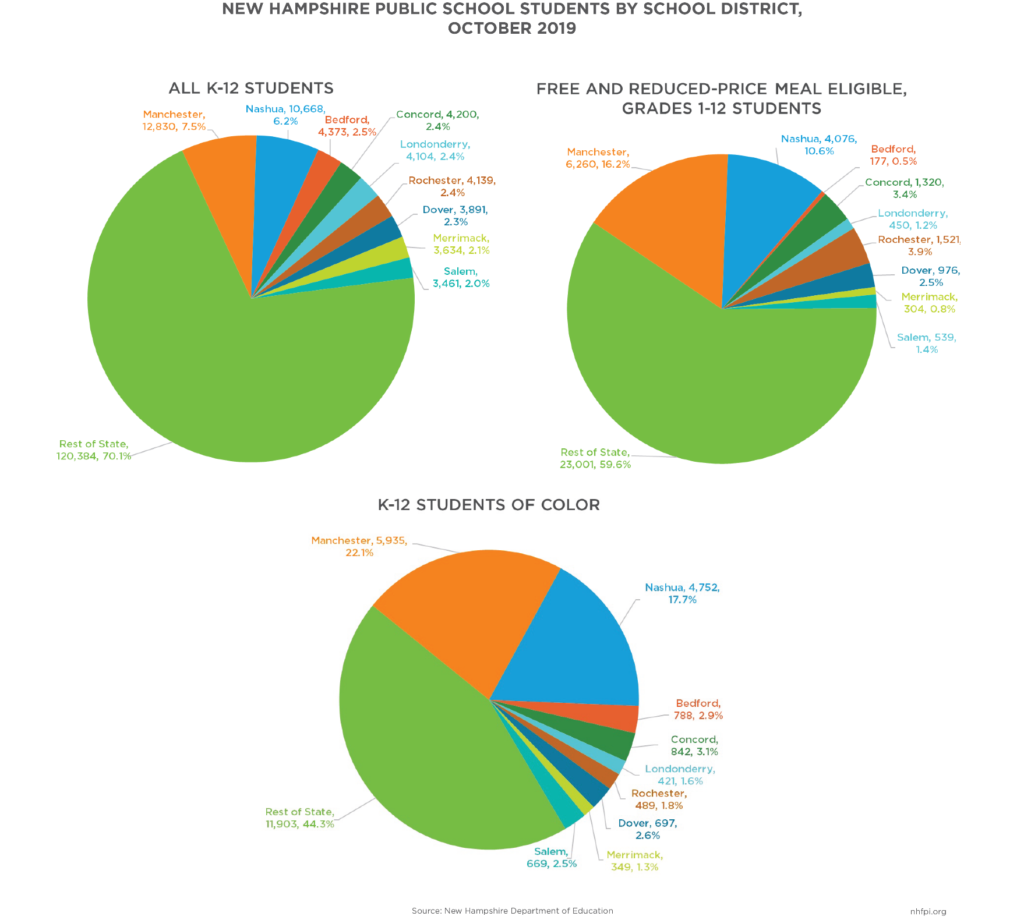
About one in seven students in New Hampshire were enrolled in Manchester and Nashua, the two largest school districts, on October 1, 2019. The remaining seven of the nine largest school districts each had between 2.0 percent and 2.5 percent of all students statewide, and more than 70 percent of all students attended school outside of the nine largest school districts.
About one in four public school students eligible for free and reduced-price school meals attended school in Manchester or Nashua, and the nine largest districts together accounted for slightly more than two out of every five free and reduced-price meal eligible students. Nearly 60 percent of eligible students attended school outside of these nine largest districts.
Students of color were also geographically distributed throughout the state. While nearly two in every five K-12 public school students of color attended school in the Manchester or Nashua districts, another 16 percent were in the next seven largest school districts in the state. More than 44 percent attended school in districts outside of these nine largest school districts throughout the state.
This geographic distribution of students with limited means, including students of color with low incomes at home, suggests that structural obstacles to student success exist in many communities throughout the state.[12] Similarly, these challenges to success are not evenly distributed, with students in some communities more likely to have larger amounts of financial resources at home to provide support, while other communities serve large numbers of students, and disproportionately students of color, with much more limited incomes.
School Districts with Highest Numbers of Eligible Students
Students living in households with limited financial means are geographically distributed throughout the state, but the set of school districts with the highest enrollments from low-income households differs from those with the highest levels of overall enrollment. The graph below shows the school districts with the largest numbers of students found eligible for free and reduced-price school meals in October 2019, ordered beginning with the highest numbers; these data are from the same set employed previously to show the school districts with the largest overall enrollments. While the large districts of Manchester, Nashua, Concord, Rochester, and Dover were among the districts with both the highest overall enrollment and the highest free and reduced-price school meal enrollment, other large districts, including key large towns in the southeastern part of the state, did not appear among the 25 communities with the highest populations of students from households with low incomes. Bedford, Londonderry, and Merrimack ranked much lower, with proportionately smaller numbers of students with low incomes, while districts in smaller cities such as Keene, Claremont, Somersworth, and Franklin appeared relatively high on the list. Rural districts also appeared among the 25 districts with the highest levels of free and reduced-price meal enrollment, including Governor Wentworth Regional in southern Carroll and northern Strafford counties, Fall Mountain Regional in Sullivan and northern Cheshire counties, Monadnock Regional in Cheshire County, and Merrimack Valley in Merrimack County.[13]
The seven school districts with the highest enrollments of free and reduced-price meal eligible students in Grades 1-12 on October 1, 2019, were Manchester, Nashua, Rochester, Concord, Dover, Keene, and Laconia. Together, these districts enrolled 24.3 percent of all grades 1-12 students, and 41.3 percent of students in those grades eligible for free and reduced-price meals statewide. While students with low incomes attended school throughout the state, these and other districts with large proportions or numbers of children eligible for free and reduced-price meals served a disproportionate number of students facing financially-based challenges to their success.
The geographic distribution of students eligible for free and reduced-price meals varies by race, and eligible children of color who live throughout the state. Just under 30 percent of eligible white students attended school in the seven districts with the highest populations of free and reduced-price meal eligible students, with the remaining students distributed throughout the rest of the state. Asian students with low incomes were less geographically distributed, with more than one in five eligible students attending school in Manchester and slightly under one in six attending school in Concord. More than one-third of eligible Asian students lived outside of these seven districts.
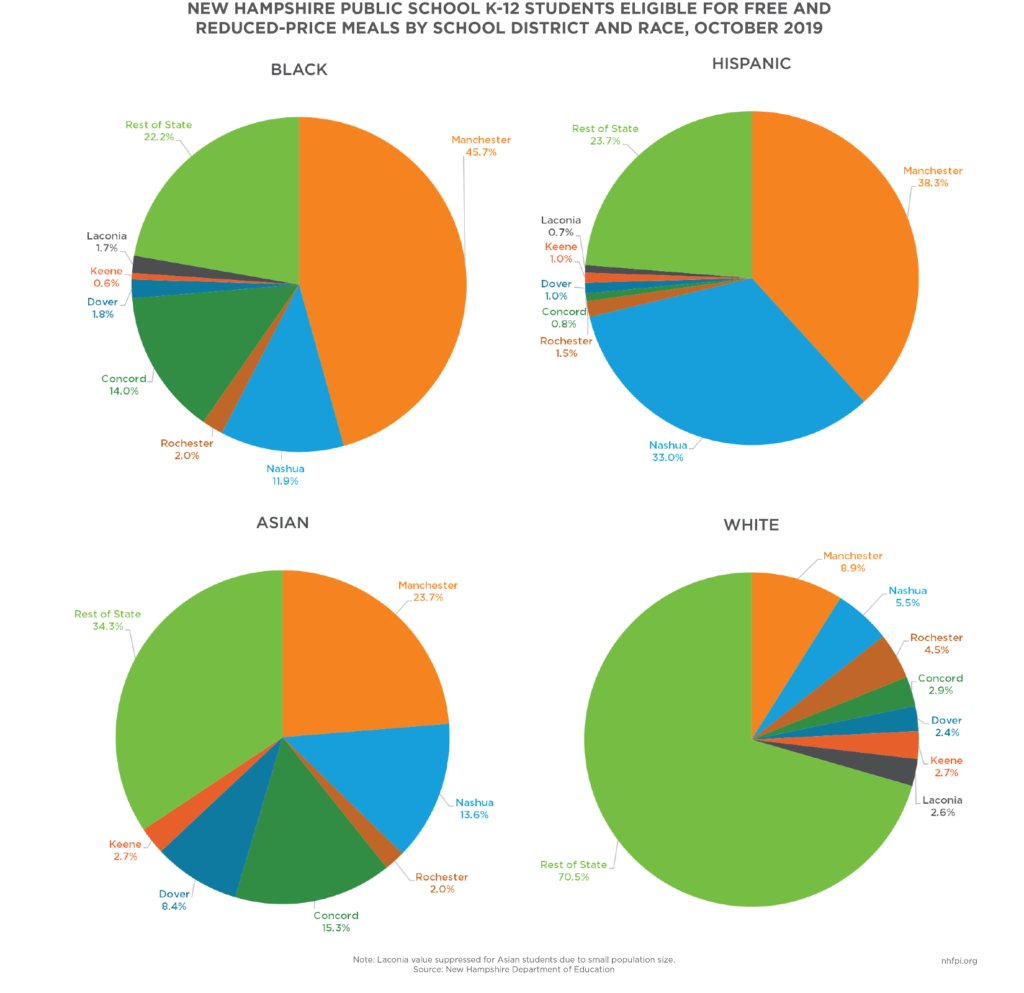
While more geographically concentrated, eligible students identifying as Hispanic and Black are distributed throughout the state as well. Nearly half of Black students eligible for free and reduced-price meals attended school in Manchester, while Concord and Nashua each accounted for more than one-tenth of eligible Black students. However, more than one out of every five Black students lived outside of the seven districts with the highest levels of free and reduced-price meal enrollment. More than two out of every three eligible Hispanic students attended school in either Manchester or Nashua, but more than one in four attended school outside of the seven districts.
These figures suggest that resource-based barriers to student success are a challenge in most areas of the state. While key communities in the state educate students with limited incomes of all races, both focused investments in these communities and geographically widespread efforts to combat structural barriers to student opportunities are needed to effectively improve the well-being of all Granite State students.
Impacts of the COVID-19 Crisis on Enrollment and Eligibility Determination
In response to the COVID-19 crisis, the federal government permitted families to access free and reduced-price school meals without providing the typical documentation. As a result, many families may have accessed the benefits of free and reduced-price meals without enrolling in the program. School districts employed different methods for distributing meals while students were physically away from their school buildings. Additionally, overall student enrollment in schools statewide declined in aggregate in the first school year of the pandemic.[14]
These changes had significant and uneven impacts on free and reduced-price school meal program enrollment and eligibility determination in New Hampshire. Enrollment in free and reduced-price school meal programs had declined for students of most races between the October 1, 2018 and October 1, 2019 student enrollment counts, although it remained essentially unchanged for students identifying as multiracial, and the number of students found eligible declined 10 percent overall. These changes reflect declining enrollments overall in New Hampshire public schools as well as an improving economy and rising wages for lower income workers reaching more households.[15] However, free and reduced-price school meal enrollment was significantly impacted by the pandemic, with October 1, 2020 eligibility falling at least 12 percent for all racial groups and 18 percent overall relative to the number of students found eligible in the October 1, 2019 enrollment counts.
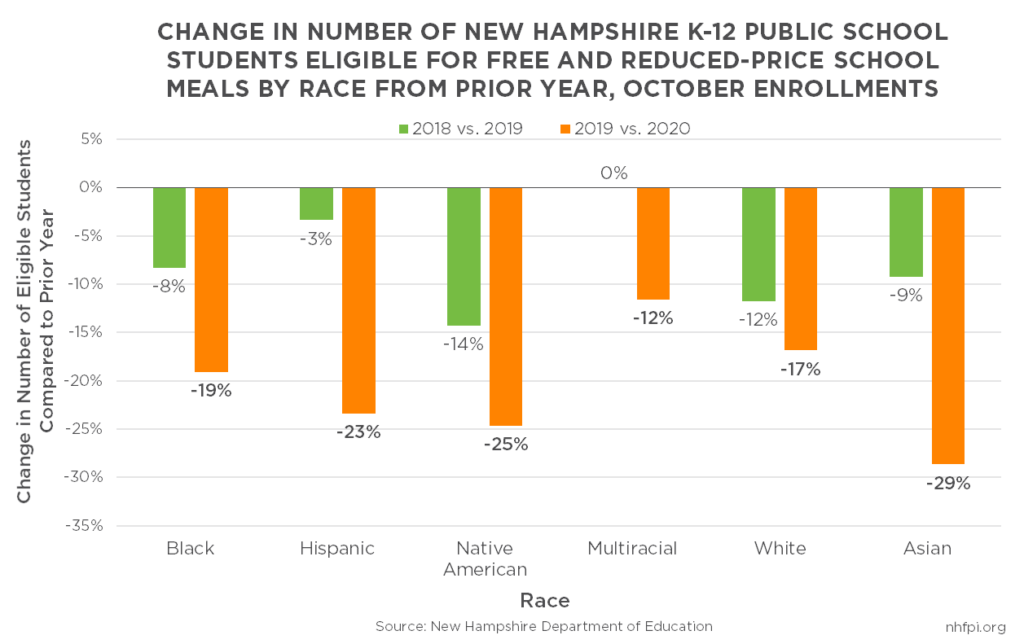
The COVID-19 crisis was disproportionately likely to impact the incomes of workers who already had low wages in New Hampshire.[16] However, determined eligibility dropped more quickly for Black, Hispanic, and Native American students than white students, despite these groups of students being more likely to be economically disadvantaged before the pandemic. These declines were likely due to federal policy changes surrounding enrollment requirements, rather than actual eligibility declining, and potentially other factors associated with being physically away from school. If enrollment and determined eligibility changes were accurately reflecting the economic reality of Granite State families, then enrollment and eligibility would have likely increased among every group of students, and might have increased even more dramatically among these groups. Enrollment also dropped more steeply among Asian students than white students, and did not drop as substantially for multiracial students as for white students.
These differences in enrollment declines suggest that outreach efforts to reenroll students for free and reduced-price meal eligibility may benefit from targeting students who were most likely to experience losses in household income or become disenrolled despite their economic situations.
Conclusion
Many Granite State students face structural barriers to success that can vary by both geography and racial identity in New Hampshire. Almost a quarter of New Hampshire students were eligible for free and reduced-price meals in October 2019, but Black and Hispanic students were more than twice as likely to be eligible for free and reduced-price meals than students overall. While not a comprehensive measurement of the well-being of students, eligibility for free and reduced-price school meals is a key indicator of limited income at home. These data show the families of Black, Hispanic, Native American, and multiracial students were disproportionately likely to have relatively fewer financial resources. The COVID-19 crisis has likely exacerbated many income-related challenges for families that were already struggling. New Hampshire-based research suggests an association between free and reduced-price meal eligibility and student success as measured by test scores, indicating less economic stability at home likely limits a student’s ability to thrive academically and benefit from socioeconomic upward mobility.[17] Additional, targeted investments would help improve access to resources for children from households with low incomes, including children of color and children in both urban and rural areas across New Hampshire.
Federal pandemic-related relief, including the relatively flexible funds available at the state and local levels, can be used to address systemic public health and economic challenges that may have contributed to more severe impacts of the pandemic among low-income communities and populations of color.[18] New Hampshire has a rare chance to use these significant federal funds to support greater access to opportunity for all Granite State children with creative and impactful public policies. Overcoming structural barriers to success will be key to helping create an equitable, inclusive economic recovery that lifts all Granite Staters.
Endnotes
[1] See NHFPI’s January 2021 Fact Sheet Resource Inequities by Population Group.
[2] The data were provided by the New Hampshire Department of Education following a request for these data from NHFPI.
[3] See NHFPI’s May 25, 2021 blog Federal Guidance Details Uses of Flexible Aid for State and Local Governments.
[4] For more discussion of the use of free and reduced-price meal eligibility data when seeking to understand concentrations of households with low incomes, see the National Center for Education Statistics, “Free or reduced price lunch: A proxy for poverty?” NCES Blog, April 16, 2015. For a discussion of data limitations associated with using U.S. Census Bureau American Community Survey data, see NHFPI’s August 2018 Issue Brief Measuring New Hampshire’s Municipalities: Economic Disparities and Fiscal Disparities. For more information on the potential enrollment gaps between the U.S. Census Bureau’s American Community Survey data and means-tested programs among children, see NHFPI’s July 2021 Issue Brief The Supplemental Nutrition Assistance Program: An Overview of Potential Under Enrollment in New Hampshire.
[5] Information provided by the New Hampshire Department of Education to NHFPI on August 19, 2021.
[6] For more information regarding free and reduced-price school meal programs and eligibility, see the New Hampshire Department of Education’s web page Resources, NSLP Application Materials and Memos. The National School Lunch Program eligibility criteria are used by the New Hampshire Department of Education for all free and reduced-price meal program eligibility for New Hampshire students, including programs or parts of programs for school breakfasts, snacks, and milk. Eligibility criteria are provided in the Frequently Asked Questions documentation for parents and guardians interested in free and reduced-price school meals. The referenced federal program providing food on Native American lands is the Food Distribution Program on Indian Reservations. Foster children do not necessarily live in households with low incomes, but are likely a small fraction of total free and reduced-price meal enrollment. According to the New Hampshire Department of Health and Human Services, in September 2019, 939 children were in Family Foster Care Placement; if all 939 children were enrolled in public schools and identified as eligible for free and reduced-price meals, they would have accounted for 2.2 percent of all free and reduced-price meal eligible students on October 1, 2019. Most children enrolled in Head Start and Early Head Start services are from households with incomes below the federal poverty guidelines; those without homes or who are foster children may also be eligible.
[7] For more information on SNAP in New Hampshire, see NHFPI’s Fact Sheet The New Hampshire Food Stamp Program.
[8] Data provided by the New Hampshire Department of Education on July 9, 2020, reflecting all students enrolled in free and reduced-price meal programs, not only those in kindergarten through Grade 12 enrolled through their public schools.
[9] For more information on the U.S. Census Bureau’s methodology for identifying race and ethnicity, see NHFPI’s June 2020 Issue Brief Inequities Between New Hampshire Racial and Ethnic Groups Impact Opportunities to Thrive.
[10] For more information on limitations on a child’s opportunities due to limited incomes at home, see the Center on Budget and Policy Priorities March 2021 report Building an Equitable Recovery Requires Investing in Children, Supporting Workers, and Expanding Health Coverage. See also Timothy M. Smeeding’s May 2016 Article in The Russell Sage Foundation Journal of Social Sciences Multiple Barriers to Economic Opportunity for the “Truly” Disadvantaged and Vulnerable and the Urban Institute’s February 2021 blog Poverty Results from Structural Barriers, Not Personal Choices. Safety Net Programs Should Reflect That Fact.
[11] Private schools are not included in this analysis unless they also serve as public schools for communities within New Hampshire. Entities treated as school districts in the Department of Education data may have overlapping geographies for different grade levels. For example, Pinkerton Academy is a private high school that serves as the public high school for some municipalities, and is identified as a school district by the New Hampshire Department of Education, but has overlapping geographies with school districts serving lower grades in some of the participating towns.
[12] For more information on structural barriers to a child’s success and income, see the Center on Budget and Policy Priorities March 2021 report Building an Equitable Recovery Requires Investing in Children, Supporting Workers, and Expanding Health Coverage. See also Timothy M. Smeeding’s May 2016 Article in The Russell Sage Foundation Journal of Social Sciences Multiple Barriers to Economic Opportunity for the “Truly” Disadvantaged and Vulnerable and the Urban Institute’s February 2021 blog Poverty Results from Structural Barriers, Not Personal Choices. Safety Net Programs Should Reflect That Fact.
[13] To see the geographies of different New Hampshire school districts, see the New Hampshire Department of Education’s New Hampshire School and District Profiles, District/Town Report, and State of New Hampshire School Administrative Units Map.
[14] See the New Hampshire Department of Education’s March 2021 House Finance Committee State Adequacy Aid Documents packet, and the University of New Hampshire Carsey School of Public Policy May 2020 Carsey Perspective Innovation in Food Access Amid the COVID-19 Pandemic.
[15] For more on the New Hampshire economy prior to the COVID-19 pandemic, see NHFPI’s September 2020 Issue Brief Challenges Facing New Hampshire’s Workers and Economy During the COVID-19 Crisis.
[16] For more information, see NHFPI’s Issue Briefs from April 2020, The COVID-19 Crisis in New Hampshire: Initial Economic Impacts and Policy Responses; June 2020, Inequities Between New Hampshire Racial and Ethnic Groups Impact Opportunities to Thrive; September 2020, Challenges Facing New Hampshire’s Workers and Economy During the COVID-19 Crisis; and September 2020, New and Expanded Challenges Facing Vulnerable Populations in New Hampshire. See also the Carsey School of Public Policy August 2020 Issue Brief The Inequities of Job Loss and Recovery Amid the COVID-19 Pandemic and NHFPI’s April 2021 Blog The COVID-19 Crisis After One Year: Economic Impacts and Challenges Facing Granite Staters.
[17] See Reaching Higher NH’s 2020 report The Whole Picture of Public Education in New Hampshire and the New Hampshire Commission to Study School Funding’s 2020 report Our Schools, Our Kids: Achieving Greater Equity for New Hampshire Students and Taxpayers.
[18] See the U.S. Treasury Department’s Interim Final Rule for the Coronavirus State and Local Fiscal Recovery Funds, released May 10, 2021.