This month, the U.S. Census Bureau released two datasets in rapid succession that provide insights into the economic well-being of both Granite Staters and all U.S. residents. These data show that, after accounting for temporary federal government assistance provided through tax credits, poverty rose substantially in 2022 after falling in 2020 and 2021, largely due to federal supports for households and the economy during the COVID-19 pandemic. Nationally, child poverty more than doubled by a key measure, while median household income in New Hampshire and nationally was eroded by inflation, between 2021 and 2022.
The Current Population Survey (CPS) data released September 12 and the American Community Survey (ACS) data released September 14 provide estimates based on surveys of households conducted during 2022. Generally, the CPS provides more detailed data, but includes a smaller number of households, making most of the data provided only useful at the national level. The ACS samples a larger number of households, and thus can provide more granular state-level data, but does not give all the details the CPS does with regard to some key measures, particularly poverty.
Two Poverty Rates Provide Different Insights
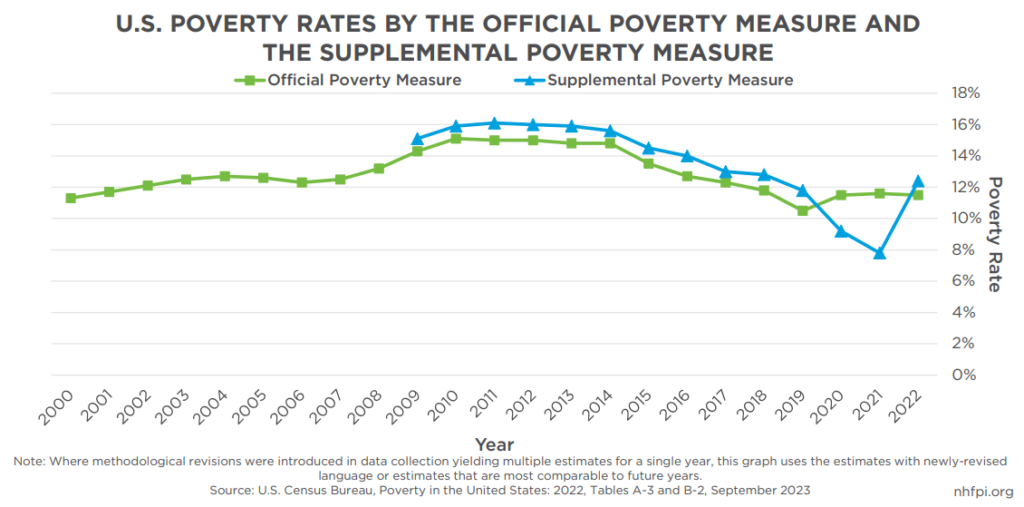
The poverty rate represents the portion of the population with very limited incomes. Both the CPS and the ACS calculate poverty rates based on the Official Poverty Measure (OPM), but only the CPS calculates the Supplemental Poverty Measure (SPM). These two measures are substantively different. The OPM uses pre-tax income and is calculated based on research published in 1955; the OPM estimates the cost of a certain federally-defined food plan and multiplies that cost by three. The SPM uses ongoing survey data to estimate expenditure costs for food, clothing, utilities, and housing costs that account for regional variation, and includes taxes and tax credits, nutrition and energy assistance, work and medical expenditures, child support payments, and child care costs. The SPM is a much newer measure, with data only calculated back to 2009, while the OPM has been estimated for each year since 1959.
From 2009 to 2019, the SPM stayed somewhat higher than the OPM nationally, with some variation between states and across years. However, in 2020 and 2021, the SPM dropped dramatically below the OPM. This change was largely due to the introduction of federal assistance, in response to the COVID-19 pandemic, that came in the form of tax credits; those credits included the Economic Impact Payments, which were sometimes called “stimulus checks,” and the American Rescue Plan Act’s expansions to the Child Tax Credit, the Earned Income Tax Credit, and the Child and Dependent Care Credit. These tax credits are accounted for in the SPM, but not in the OPM, yielding substantially different poverty rates while the credits were in effect. Between 2021 and 2022, the national SPM poverty rate increased from 7.8 percent to 12.4 percent, or 4.6 percentage points (a 59 percent increase), as key aid expired and prices for goods and services, including housing and energy, increased.
The increase in SPM poverty was particularly significant for certain groups. The expanded Child Tax Credit, especially the Advance Child Tax Credit payments, substantially reduced poverty for children as measured by the SPM. The expiration of that temporary tax credit resulted in a rebound in child poverty, which rose from 5.2 percent to 12.4 percent, or a 7.2 percentage point (138 percent) increase, between the SPM rates calculated for 2021 and 2022. This change was much larger than the rate increases for adults, showing the effectiveness of the targeted tax credits at reducing poverty specifically among children.
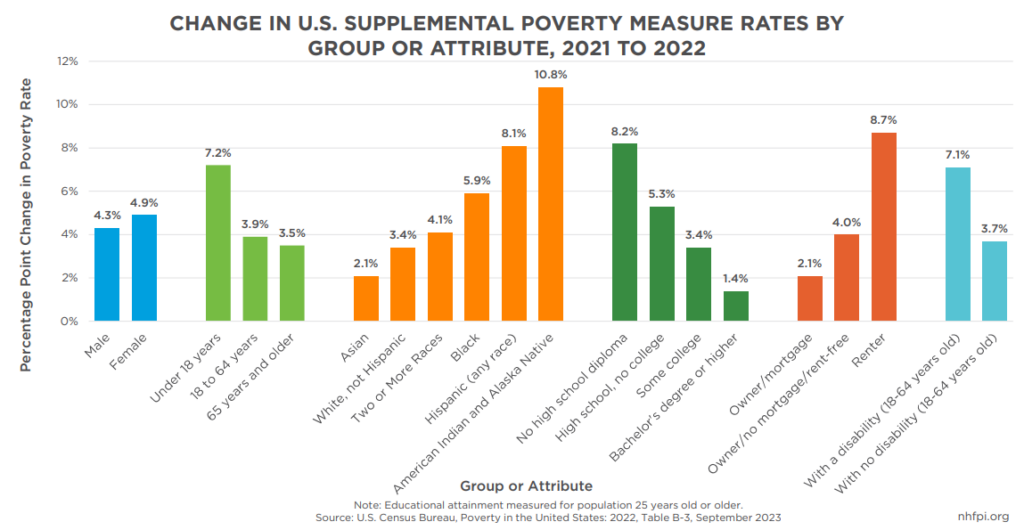
Certain structurally underserved groups, including racial and ethnic minority groups, also experienced significant increases in SPM poverty. Poverty among Native Americans increased an estimated 10.8 percentage points, approximately double the 2021 rate, while poverty rose 8.1 percentage points for Hispanic residents and 5.9 percent for Black residents. Lower levels of educational attainment correlated with higher increases in poverty, including an 8.2 percentage point increase in the poverty rate for people age 25 years and older who did not have a high school diploma. For adults age 18 to 64 years living with a disability, the poverty rate increased 7.1 percentage points, while individuals without a disability saw an increase of 3.7 percentage points.
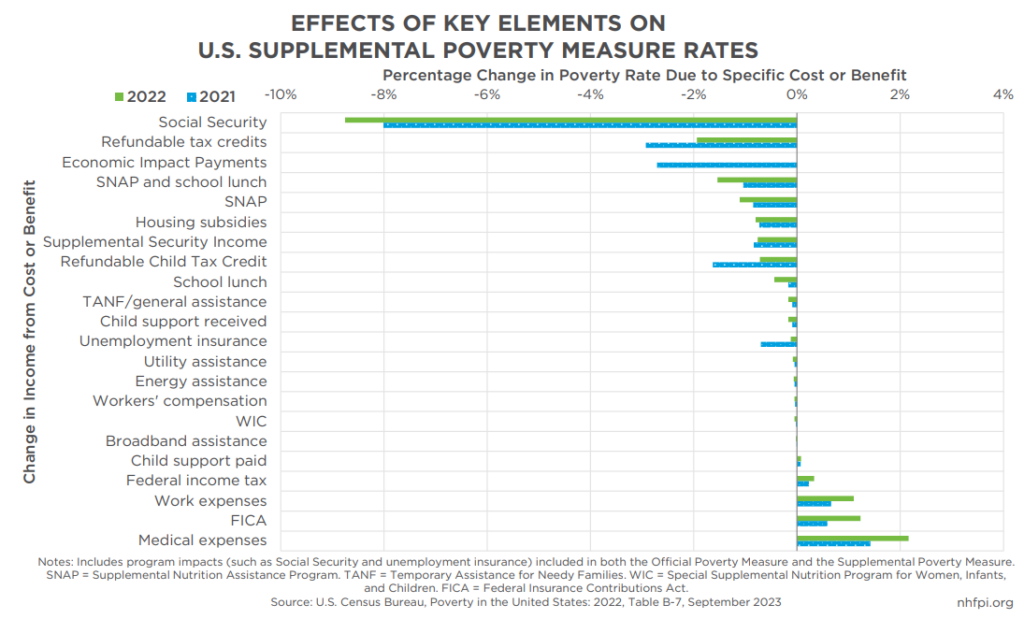
The CPS allows for a granular understanding of the impacts of key elements on poverty, including public policies, at the national level. For example, Social Security has a substantial impact on poverty rates by supplying income to large numbers of older adults who might not otherwise have income; in 2022, an estimated 28.9 million more U.S. residents would have been in poverty without Social Security, including 20.1 million more adults age 65 years and older. During 2021, Economic Impact Payments reduced the SPM poverty rate by 2.7 percentage points, and refundable tax credits reduced it by 2.9 percentage points. The Economic Impact Payments were not repeated in 2022, and as a result had no effect, while the impacts of refundable tax credits dropped to a 1.9 percentage point reduction in the SPM poverty rate. Unemployment insurance payments, which impact both the SPM and OPM rates, were also a much smaller factor in 2022 than in 2021, when more people were receiving unemployment compensation. Medical and work expenses, as well as federal income tax payments, increased poverty more in 2022 than in 2021.
Measuring Poverty at the State Level
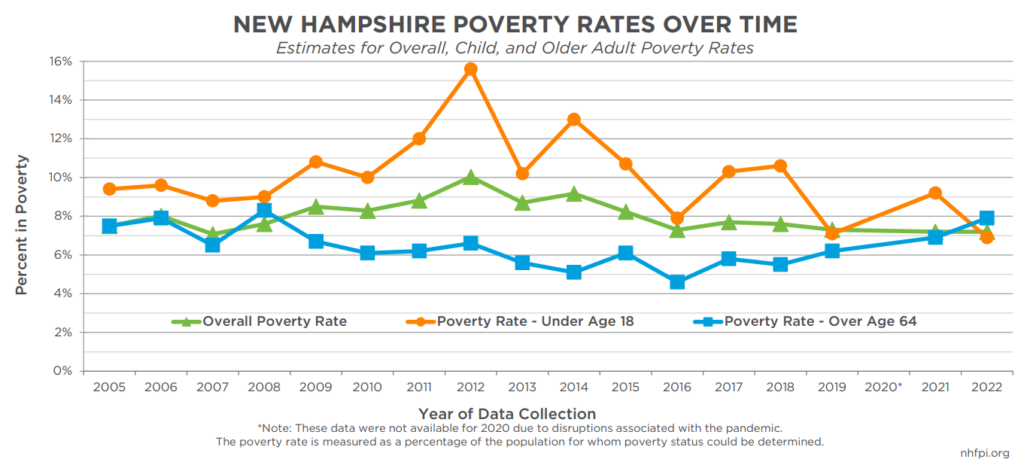
In New Hampshire, neither the ACS nor the CPS, the two surveys that were the source of the U.S. Census Bureau’s data release, provided detailed SPM poverty estimates. Poverty at the state level is typically measured with the OPM, using ACS data, on a year-over-year basis. As a result, the significant reductions in poverty caused by federal tax credit enhancements are not shown in the New Hampshire data by subgroup, as those tax credits do not count in the ACS calculation of household incomes. The OPM poverty rate for children actually declined in New Hampshire between 2021 and 2022, dropping to an estimated 6.9 percent, while the poverty rate for the population overall remained at 7.2 percent in 2022, the same estimated rate as in 2021.
The OPM is set for common levels among the 48 contiguous U.S. states and is based on family size. The OPM poverty-level annual income threshold for 2022 is $15,225 for an individual less than 65 years old, and $23,556 for a family of three with one child. About 98,000 Granite Staters lived in poverty, which is approximately the estimated 2022 populations of Claremont, Concord, Laconia, and Portsmouth combined. Approximately 48,000 people lived at less than half of poverty-level income, while an estimated 247,000 people, nearly one in five residents, lived with less than twice poverty-level incomes.
Some discrepancies exist between different population groups in New Hampshire. While the data for 2022 only offer limited insights into populations and geographies within the state due to limited data collected, the poverty rate for Hispanic or Latino Granite Staters was about twice as high as the rate for all residents in 2022. ACS data aggregated over 2017-2021, which will be updated with 2022 data in December 2023, show longer-term differences with more reliable detail; the poverty rate for Black or African American Granite Staters is about 2.5 times higher than for white residents, while rates are about twice as high for Hispanic or Latino residents and elevated for Asian residents or Granite Staters identifying as two or more races relative to white residents, reflecting both historical and present-day barriers to opportunity that hinder upward mobility for racial and ethnic minority groups in New Hampshire.
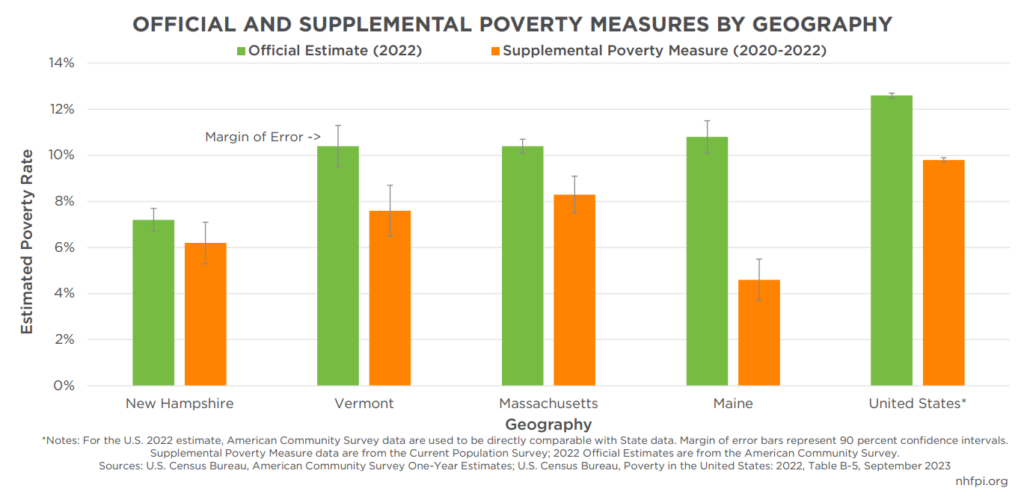
Compared to other states, New Hampshire had the lowest OPM poverty rate in 2022, as measured by the ACS. Utah’s 8.2 percent was the next closest OPM poverty rate to New Hampshire’s 7.2 percent, a statistically significant difference. However, New Hampshire did not have the lowest SPM poverty rate in the latest data. The U.S. Census Bureau does not release any detailed SPM poverty rates about population groups within states, but does aggregate three years of data to produce overall SPM rates for each state. For the 2020-2022 period, New Hampshire’s SPM poverty rate was 6.2 percent, which was higher than Maine’s 4.6 percent even after accounting for statistical uncertainty in the data. Seven other states have lower estimated SPM poverty rates than New Hampshire, but those differences are not statistically significant, indicating the poverty rates are indistinguishable from one another.
New Hampshire Median Incomes Did Not Keep Up with Inflation
The purchasing power of median household income declined both nationally and in New Hampshire in 2022. The median household income in the state, which is the amount earned by the household in the middle of the income distribution, was estimated at $89,992 in the data collected in 2022, which was not significantly different from the $88,465 estimated for 2021.
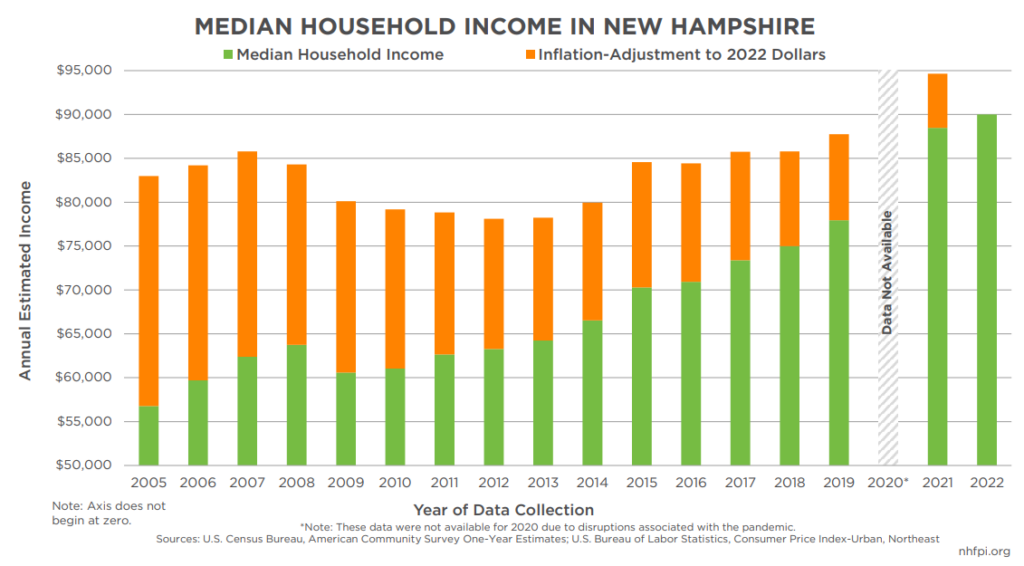
However, after adjusting for inflation, the median New Hampshire household saw a decline of about $4,600 in purchasing power, which was larger than the single-year decline of approximately $4,200 between 2008 and 2009, during the Great Recession.
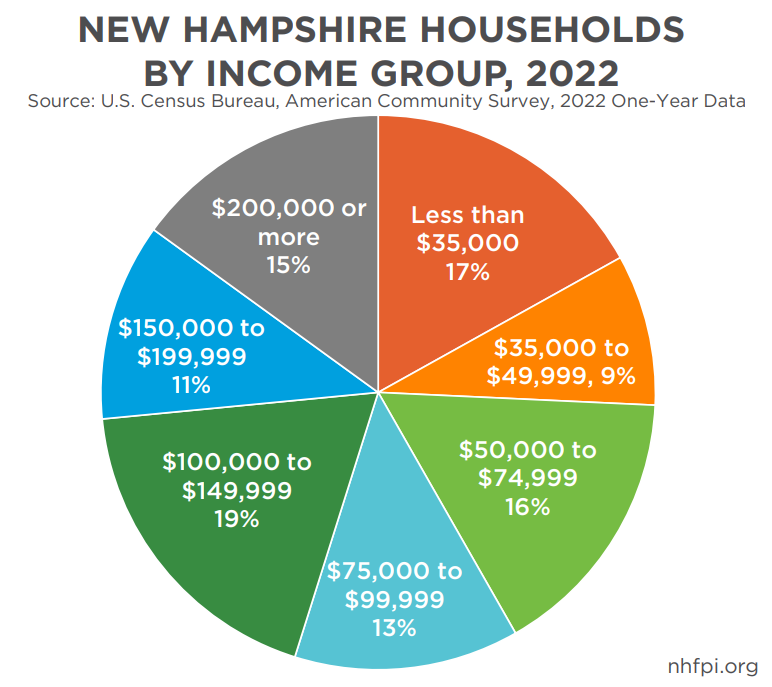
About one in four Granite State households reported income of less than $50,000 per year in the 2022 data collection. About one in six had incomes below $35,000 per year, and more than half of all households had incomes below $100,000 per year.
Looking Back and Ahead
These new data from the U.S. Census Bureau reflect the next chapter in understanding the impacts of pandemic-era public assistance programs on the well-being of Granite Staters and residents around the United States. While the 2021 data showed a massive and meaningful decline in child poverty, the expiration of temporary policies designed to support households with children appears to have led to poverty rates rebounding in 2022, despite a stronger economy overall. These data emphasize the ability of public policy to reduce financial hardships for households.
Slowing inflation during 2023 suggests household incomes may again begin to outpace cost increases. A strengthening economy may also help reduce poverty, and low unemployment rates could continue to help enhance economic opportunity by boosting wages, particularly for workers with lower incomes. However, a limited workforce and rising costs for housing and child care have held back economic growth in New Hampshire during the recovery from the COVID-19 pandemic. Additional data, scheduled to be released in December, will provide more insight into the communities and regions of New Hampshire that have had the greatest difficulty recovering from the pandemic’s economic impacts.
– Phil Sletten, Research Director