
The U.S. Census Bureau released its annual assessment of state-level poverty and income late last month, after a delay caused by a change in the data privacy practices of the Bureau.
The latest American Community Survey data show that the financial well-being of Granite Staters improved in 2025. The poverty rate, after remaining statistically unchanged since 2016, fell by a percentage point, and median household income increased to approximately match the 2021 amount, which was previously the inflation-adjusted highest level recorded since these data started being collected. National-level data show New Hampshire was not alone in having an increase in income or a decrease in poverty by these measures.
Despite these topline improvements, the data show that many Granite Staters continue to face high living costs relative to their incomes. Nearly half of New Hampshire renters spent more than 30 percent of their incomes on housing in 2025, a similar proportion to recent years. Poverty rates for children and older adults did not change significantly from last year. The estimated 85,000 Granite Staters in poverty had incomes well below the estimated amounts needed to afford a modest but adequate standard of living.
The new data practices implemented by the U.S. Census Bureau ahead of this data release generated concern, both because they created a temporarily undefined delay in the release of the American Community Survey data and because they could result in less detailed data about certain populations. However, while the full potential effects of these data changes are not known, initial reviews have found no conclusive evidence of systemic changes that would compromise data availability or relative accuracy.
Poverty Rate Drops for Overall Population After Holding Steady for Years
New Hampshire’s estimated poverty rate held steady through some particularly tumultuous economic periods. While consistent data were not available for 2020 due to data collection challenges, the Official Poverty Measure, which compares pre-tax income to a specific multiple of estimated food costs based on a household’s size, held fairly steady across the COVID-19 pandemic; the poverty rate was 7.3% in 2019 and 7.2% in 2021, a statistically insignificant change.
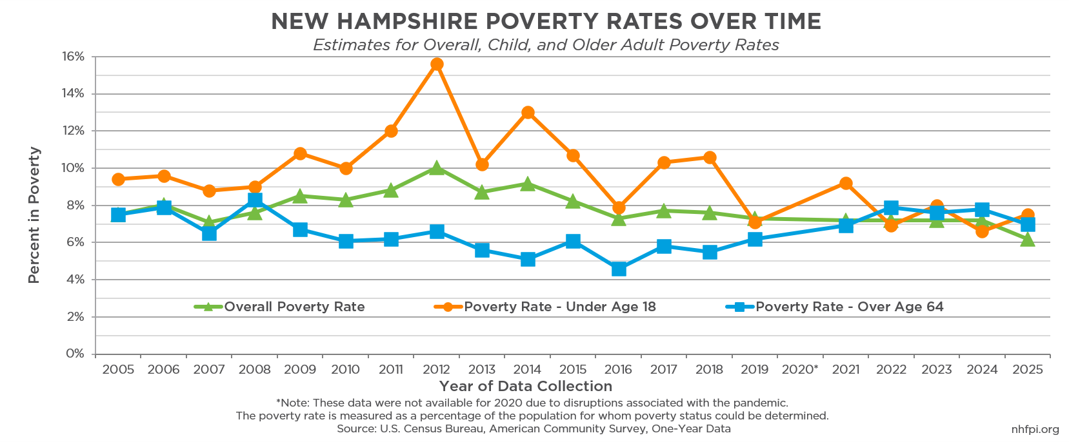
The pandemic punctuated a remarkably steady period for the poverty rate in New Hampshire. The last statistically significant change in the overall poverty rate in New Hampshire was between 2015 and 2016, when the poverty rate was still dropping following the slow recovery from the Great Recession of 2007-2009. Since that year, the poverty rate has not been statistically different across the entire 2016 to 2024 period (with no data available for 2020), and held at an estimated 7.2% for all four years from 2021 to 2024.
However, the 2025 data, released late October 2026, included a surprise break from that holding pattern. The poverty rate declined to 6.2%, a statistically significant change. The number of people in poverty in New Hampshire dropped from approximately 99,000 to about 85,000. Even after the drop, that figure still indicates nearly the same number of people live in poverty in New Hampshire as live in the cities of Claremont, Lebanon, Portsmouth, and Rochester combined.
Poverty Threshold Remains Well Below Estimated Living Costs
The federal poverty threshold, which is purely based on pre-tax income for different household sizes and not adjusted for living costs across the contiguous 48 states, was $16,750 annually for a single individual under 65 years old in 2025, $22,190 for a single younger parent with one child, and $25,913 for a two-parent household with one child.
These poverty thresholds continue to be substantially lower than estimated costs of living. The average household size in New Hampshire was approximately 2.39 people in 2024. The Massachusetts Institute of Technology estimated the living wage income for a two-person household in New Hampshire in early 2026 was $71,614 for two adults, $96,954 for one adult with one child, and $109,290 for two working adults with one child. The Economic Policy Institute estimated the income a family needed in 2025 for a “modest but adequate lifestyle,” which does not include costs such as paying for student loans or for homeownership as well as for any form of entertainment, ranged from $79,364 to $104,383 for a household with two adults and one child, depending on where they lived in New Hampshire. That range suggests that in New Hampshire’s least expensive county, Coos County, a family of two adults and one child with poverty-level incomes would be earning less than a third of the amount estimated to afford these living costs.
The Supplemental Poverty Measure, which adjusts for additional costs including regional variations in housing costs, was not published for states based on American Community Survey data in this release. Those data have previously shown child poverty rates rebounding after dropping substantially in 2021 during the one-year expansion of the federal Child Tax Credit, and poverty rates for older adults rising as well.
Poverty Rates for Children, Older Adults Did Not Change Significantly
By the Official Poverty Measure, the child poverty rate in New Hampshire was statistically unchanged, and did not shift down with the overall poverty rate. While the estimates are within the margin of error of each other and cannot show anything conclusive about changes in poverty from year-to-year, the estimated child poverty rate did not trend with the overall rate, landing at 7.5% in 2025 after the estimated 6.6% in 2024 and 8.0% in 2023. The number of children estimated to be in poverty in 2025 was 18,000, while it had been 16,000 in 2024.
Within the Official Poverty Measure data for New Hampshire, 2025 continued to show certain longstanding differences in economic hardship between groups, reflecting both historical and present-day barriers to opportunity that hinder upward mobility. While data limitations prevent a reliable, comprehensive analysis of 2025 data, Granite Staters identifying as Black or African American faced a higher estimated poverty rate than the overall population, and Hispanic or Latino Granite Staters experienced a higher poverty rate than Granite Staters who are White and not Hispanic or Latino. Additional data from the American Community Survey, which is typically released in December but has also been delayed, will provide more reliable, in depth insights into the well-being of certain groups and geographies within the Granite State.
Poverty for older adults was also statistically unchanged between 2024 and 2025, but the estimated poverty rate trended in the same direction as the overall poverty rate. The poverty rate for residents 65 years and older in 2024 was estimated to be 7.8%, while it was 7.0% in the 2025 data. Those data suggest about 22,000 older adults were in poverty in New Hampshire during 2025, which is nearly as many people as the number who lived in Keene that year.
New Hampshire’s Decline in Poverty Not Unique, Outpaced by Rhode Island
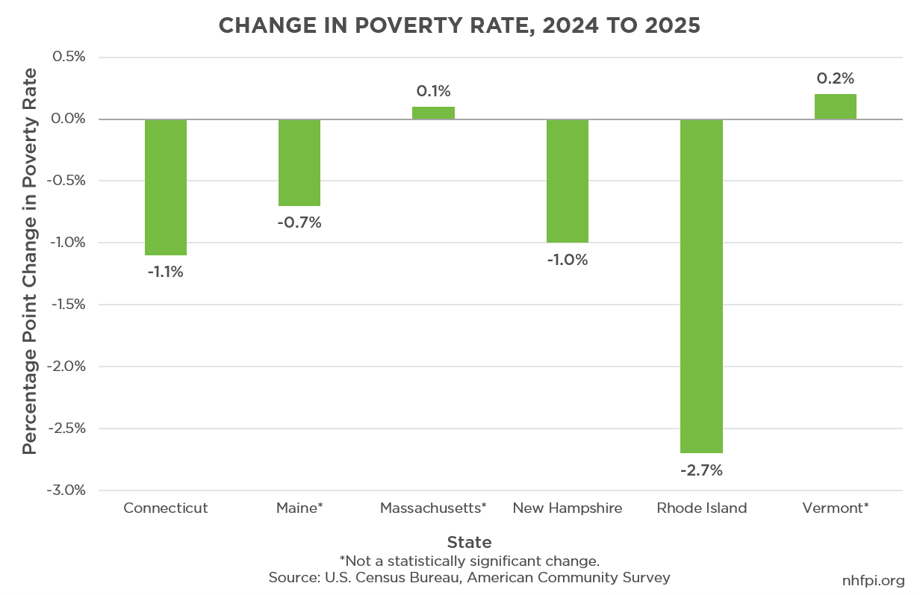
Nationally, the poverty rate dropped in 11 states and increased in only one state, South Dakota, while remaining statistically unchanged in all other states. The national poverty rate was 11.8%, and New Hampshire’s official poverty rate was the lowest in the country, followed by Utah, New Jersey, North Dakota, Minnesota, Connecticut, Colorado, and Vermont. Among New England States, the poverty rate dropped in Rhode Island (by 2.7 percentage points) and Connecticut (by 1.1 percentage points) between the 2024 and 2025 data.
New Hampshire has held the lowest official poverty rate in the country previously. However, other measures of hardship, such as the federal Supplemental Poverty Measure, have indicated New Hampshire does not have the lowest poverty rate by all measures, with state such as Maine, Minnesota, Utah, and Iowa often competing for the lowest poverty rates across multiple measures.
Median Household Income Returns to Post-Pandemic High After Years Behind Inflation
Median household incomes in New Hampshire, after adjusting for inflation, peaked in 2021 and then slipped behind inflation in 2022 relative to that high mark. The relatively robust early recovery from the COVID-19 pandemic, resulting from accumulated savings and fiscal stimulus, generated higher household incomes in 2021 before inflation, driven in part by geopolitical energy shocks, eroded those gains.
The 2025 data indicate median household income in New Hampshire grew to an estimated $106,759 last year, an increase from 2024’s estimate of $99,782, without adjusting for inflation. After adjusting available estimates to 2025 dollars, the 2025 total of $106,759 is statistically indistinguishable from the 2021 total of $104,395 in 2025 dollars, suggesting that real 2025 incomes finally outpaced inflation enough to make up for the losses from prior years, and potentially a positive trajectory beyond a recovery. However, faster inflation during 2026 may offset these gains in the next year’s data.
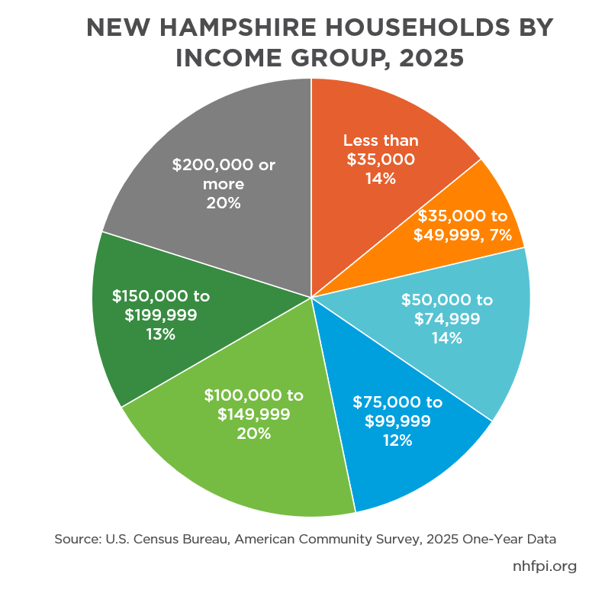
About 20% of households in New Hampshire had incomes over $200,000 during 2025. At the other end of the income scale, a similar proportion, just over one in five households, had incomes below $50,000. About 10% of households regardless of size, had incomes below $25,000.
Housing Costs Continue to Be Significant
A limited supply of housing units in New Hampshire is contributing to both higher rental costs and increased sale prices for single-family houses across the state, making purchasing a home, and associated wealth-building opportunities, more difficult to access for those who currently rent.
In 2025, the estimated median income for households that owned their home was $127,915. Renters’ median household income that same year, however, was estimated to be $58,715, about half of the median income of owner households.
Lower incomes increase the likelihood of being cost-burdened by housing costs, including rent and utilities. Cost-burdened is a term the U.S. Department of Housing and Urban Development has used to describe households that pay more than 30 percent of their income toward housing. In 2025, approximately 48 percent of New Hampshire renters met the criteria of being housing cost-burdened compared to about 28 percent of owner households paying a mortgage and about 18 percent of owner households without a mortgage.
Other Key Data in This and Future Releases
Other data in the release provide additional information about living in the Granite State. About 14 percent of workers age 16 and over commuted out of state for employment. Another approximately 14 percent worked from home, which may indicate a slight decline from the post-pandemic average. Income inequality, as measured by the Gini Index, is not higher than it was last year, but is higher than it was in 2010. New Hampshire, alongside Maine and Vermont, were the states with the highest percentages of homes that were connected to septic tanks, rather than to municipal or other sewer systems.
As more data are released in the coming months and more clarity about these data are available, continued insights into the lives and well-being of Granite Staters can help guide public policy during the next Legislative session.