
KEY POINTS
-
- Employment growth in NH improved relative to 2025. Nonfarm employment rose 1.1% from January through July 2026. National employment rose 0.2%.
- Unemployment claims indicate a low-hire, low-turnover labor market in 2025, as NH-based employment declined that year.
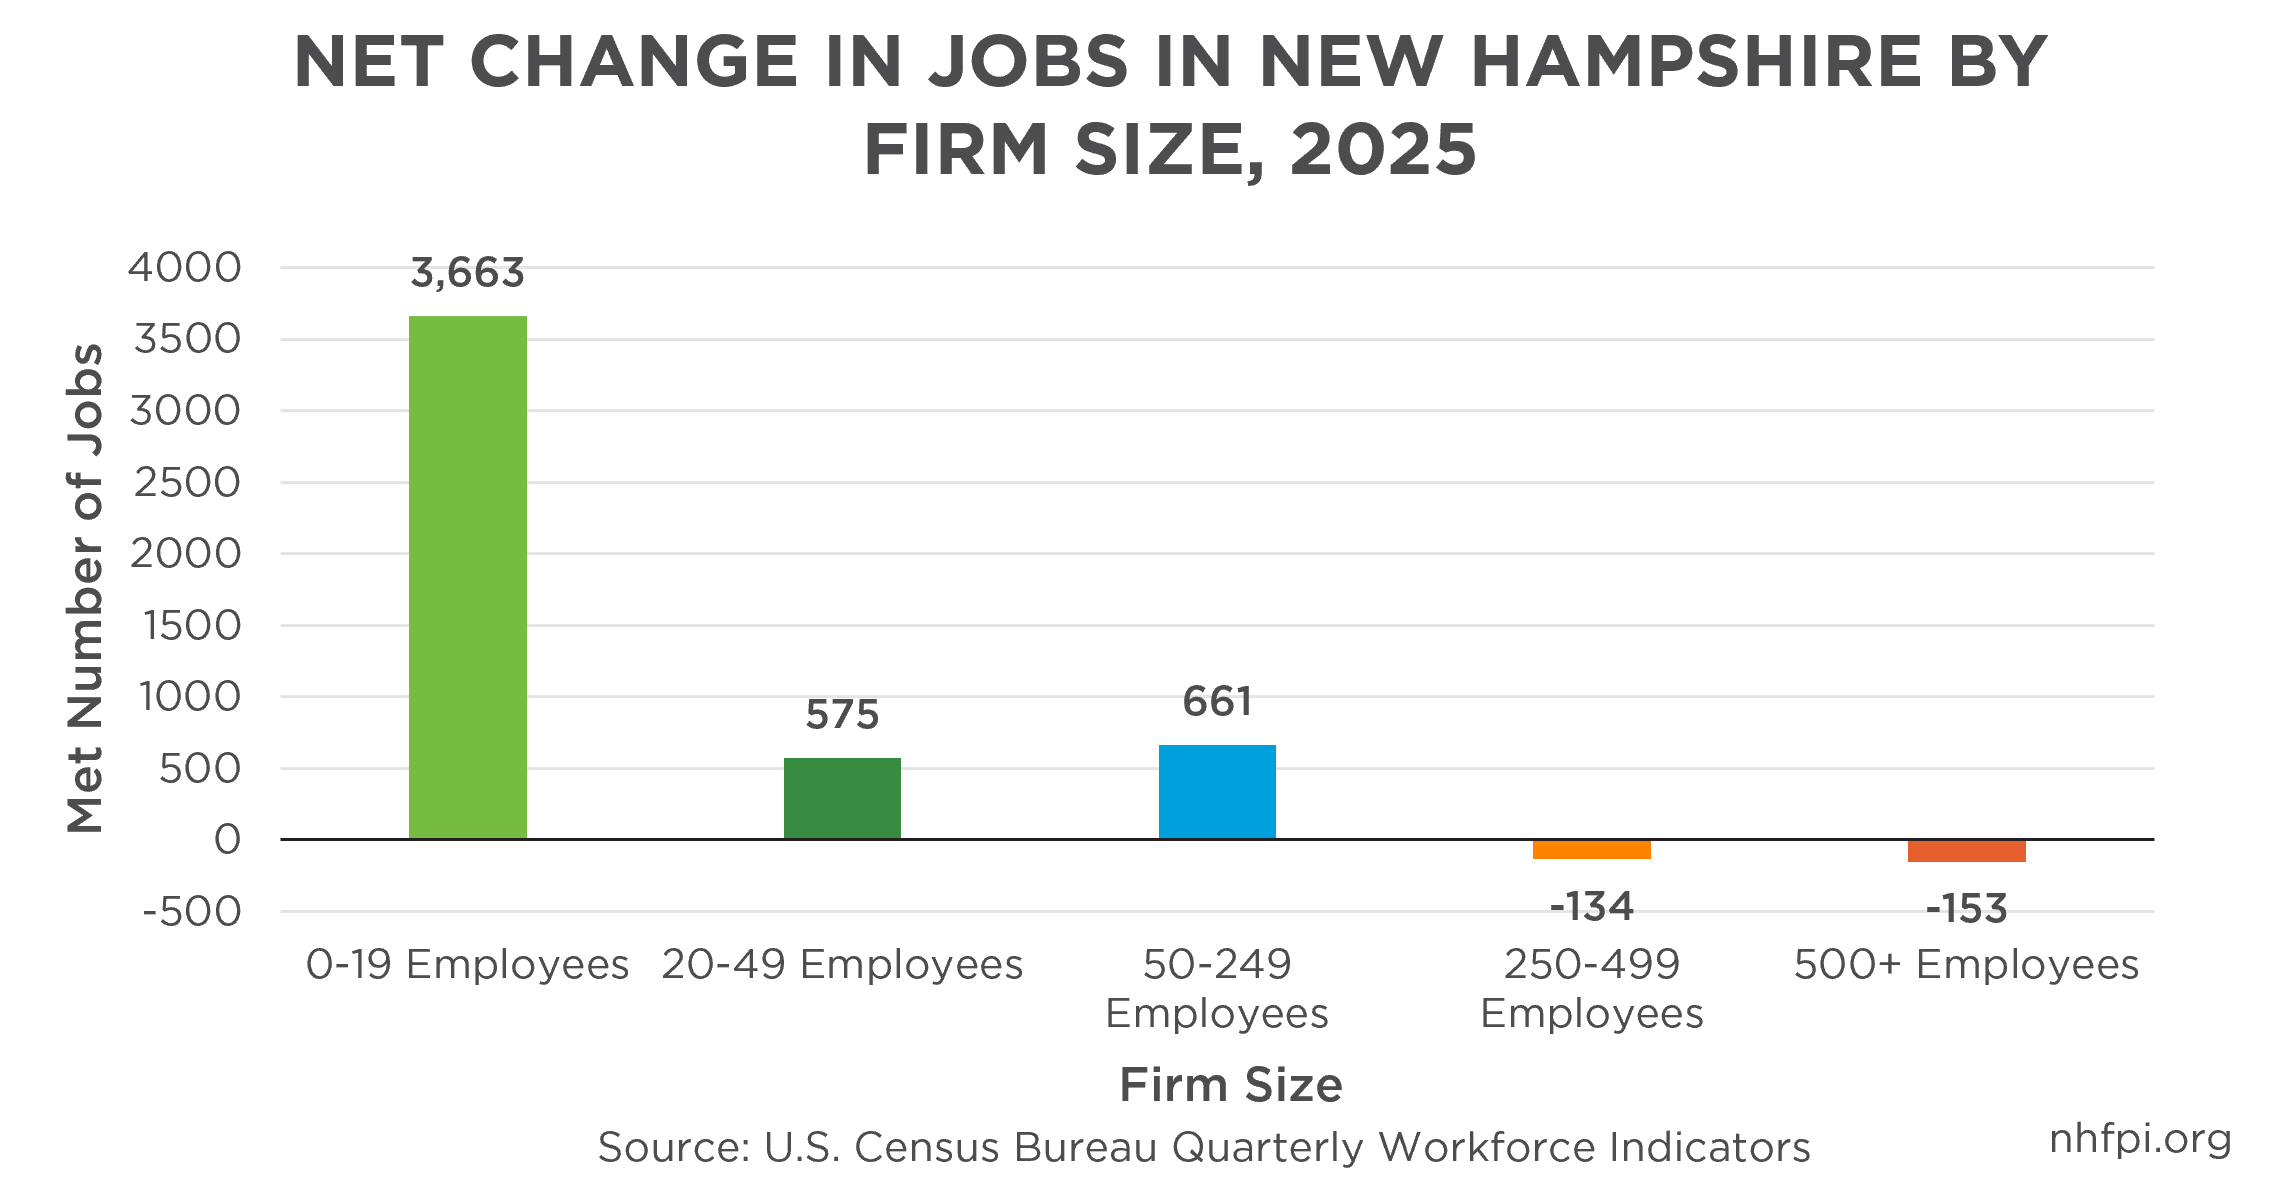
- Small companies contributed most of the net job growth in the state. Companies with fewer than 20 employees added 3,663 jobs in 2025, 79% of all net private-sector job growth.
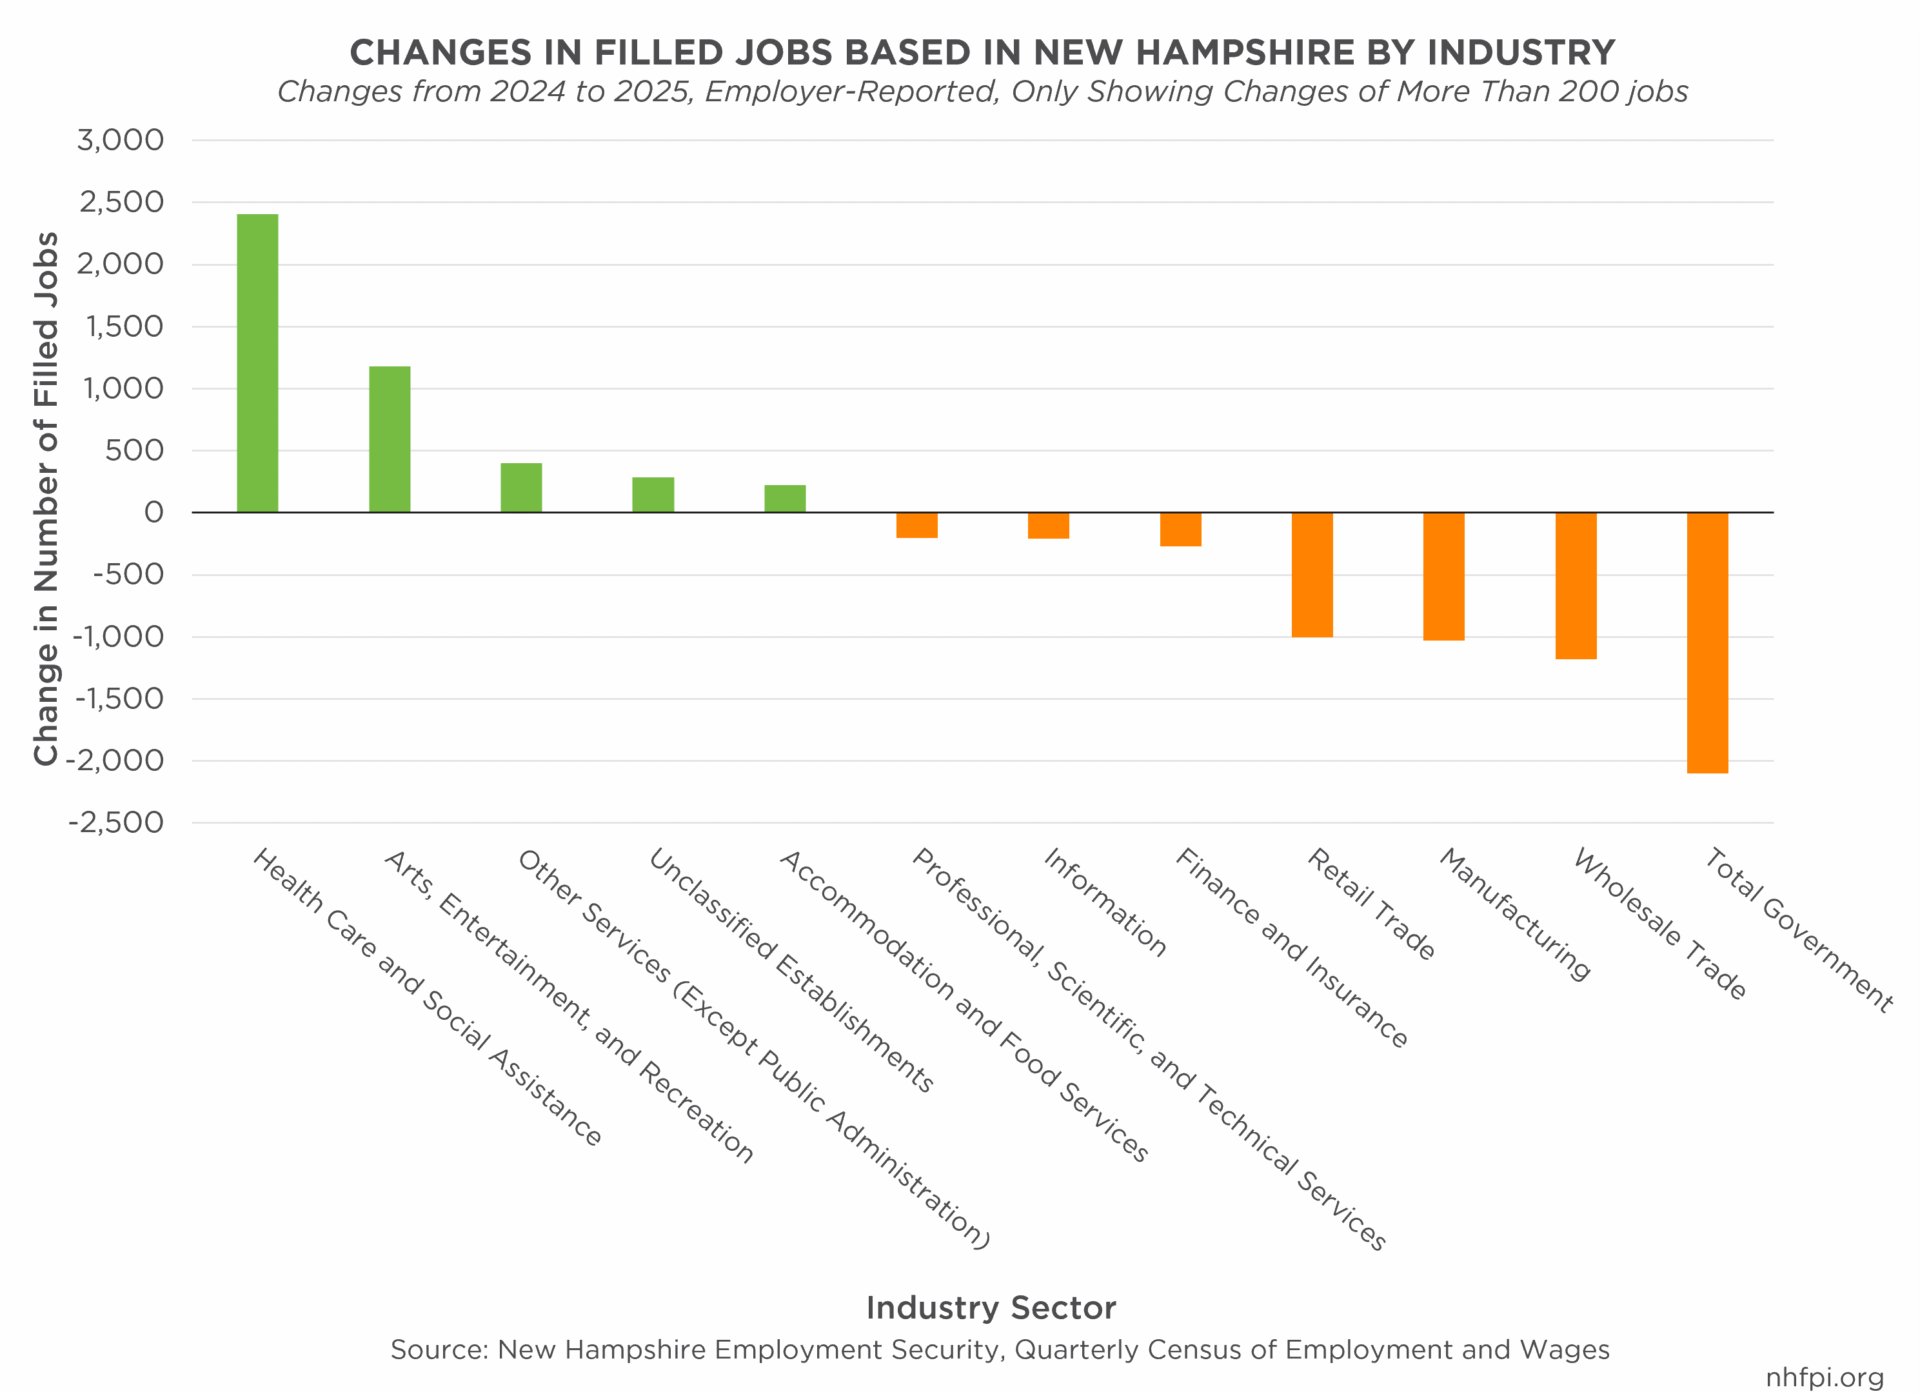
- Health care and social assistance continues to grow as New Hampshire’s largest industry by employment, while wholesale trade, manufacturing, and retail trade declined.
- Labor constraints have eased as the labor force has grown, but participation fell among people ages 20 to 34, with older workers increasing their share.
- Average wage growth continues to lag behind inflation, and productivity continues to grow faster than compensation.
- The impact of artificial intelligence remains unclear, but may affect entry-level employment first.
New Hampshire’s labor market regained momentum in the beginning of 2026 after hiring and employment weakened in 2025. Preliminary data show that there has been growth in the labor force, the number of residents employed, and the number of jobs reported by employers. However, these gains are not evenly distributed across industries and remain subject to data revisions in the future.
New Hampshire’s employment grew in 2026, while national job growth remained nearly flat. Seasonally adjusted nonfarm employment increased 1.1% in New Hampshire between January and July 2026, compared with 0.2% national growth. However, this improvement in state-level employment follows a much weaker 2025, when New Hampshire employment decreased by 1.1% between January and December 2025, while national employment grew by 0.1%. The early 2026 gains, therefore, appear to be primarily a recovery from earlier losses. This improvement in state-level employment occurred while the national economy experienced slower job growth, persistent inflation, and uncertainty stemming from federal trade policy.
New Hampshire’s Gross State Product accounts for only a small share of the United States’ Gross Domestic Product, and changes in consumer demand, prices, and business decisions outside the state can have large effects on the livelihoods of Granite Staters.
Household and employer surveys show stronger employment conditions in 2026. Unemployment claims indicate that slower hiring caused much of the slowdown seen in 2025, rather than any widespread layoffs. In 2025, smaller companies with fewer than 20 employees generated most of the State’s net job growth. Additionally, health care and social assistance continued to be a leading industry for employment, while manufacturing, retail, and wholesale trade all declined in employment.
New Hampshire’s labor force continued to grow; it was the only state in New England with labor force growth during the 12 months ending June 2026. New Hampshire’s underemployment and labor underutilization declined during the same period. An expanded available workforce helped ease labor constraints seen over the last few years. Employers were able to find workers for more unfilled positions, as the number of job openings more closely matching the number of unemployed people, rather than substantially outpacing the number of available workers, which was the case four years ago.
The improving employment conditions have not produced the same wage gains that workers received in 2021. Labor productivity in New Hampshire has continued to outpace inflation-adjusted hourly compensation, and average private-sector wage growth has fallen behind inflation again during 2025 and early 2026.
Artificial intelligence (AI) may also be changing how employers assign work and hire new employees. Available information suggests formal AI use remains concentrated among larger companies. Since job growth in New Hampshire has been driven by smaller companies in the last two decades, it may be too early to see the impact that AI is having on New Hampshire’s economy. However, early-career workers and occupations that are easily automated face higher risks of being replaced by AI.
New Hampshire’s labor market has improved so far in 2026, but still faces risks. National economic weakness, rising prices, uneven industry growth, technological advancements, and future trade policies could dampen the gains seen. This report examines these trends and their effects on New Hampshire workers, businesses, and families.
New Hampshire Job Growth Resumes After a Decline in 2025
While national job growth continued to weaken in 2026, job growth in New Hampshire may have rebounded after losing about 7,900 jobs in 2025.[1] All official monthly employment data undergo revision and benchmarking to improve accuracy. However, seasonally adjusted data available for 2026 show more employed New Hampshire residents in June 2026 than at the end of 2025.[2]
The average number of employed residents during the first six months of 2026 was about 752,810. This figure was slightly above the average of approximately 751,437 employed residents from July through December 2025, based on survey data collected from New Hampshire residents. Monthly estimates suggest that seasonally-adjusted employment peaked at about 753,306 Granite Staters in May 2026. The preliminary June 2026 estimate was about 2,581 jobs above the June 2025 estimate, although it did not grow relative to the May 2026 data.[3]
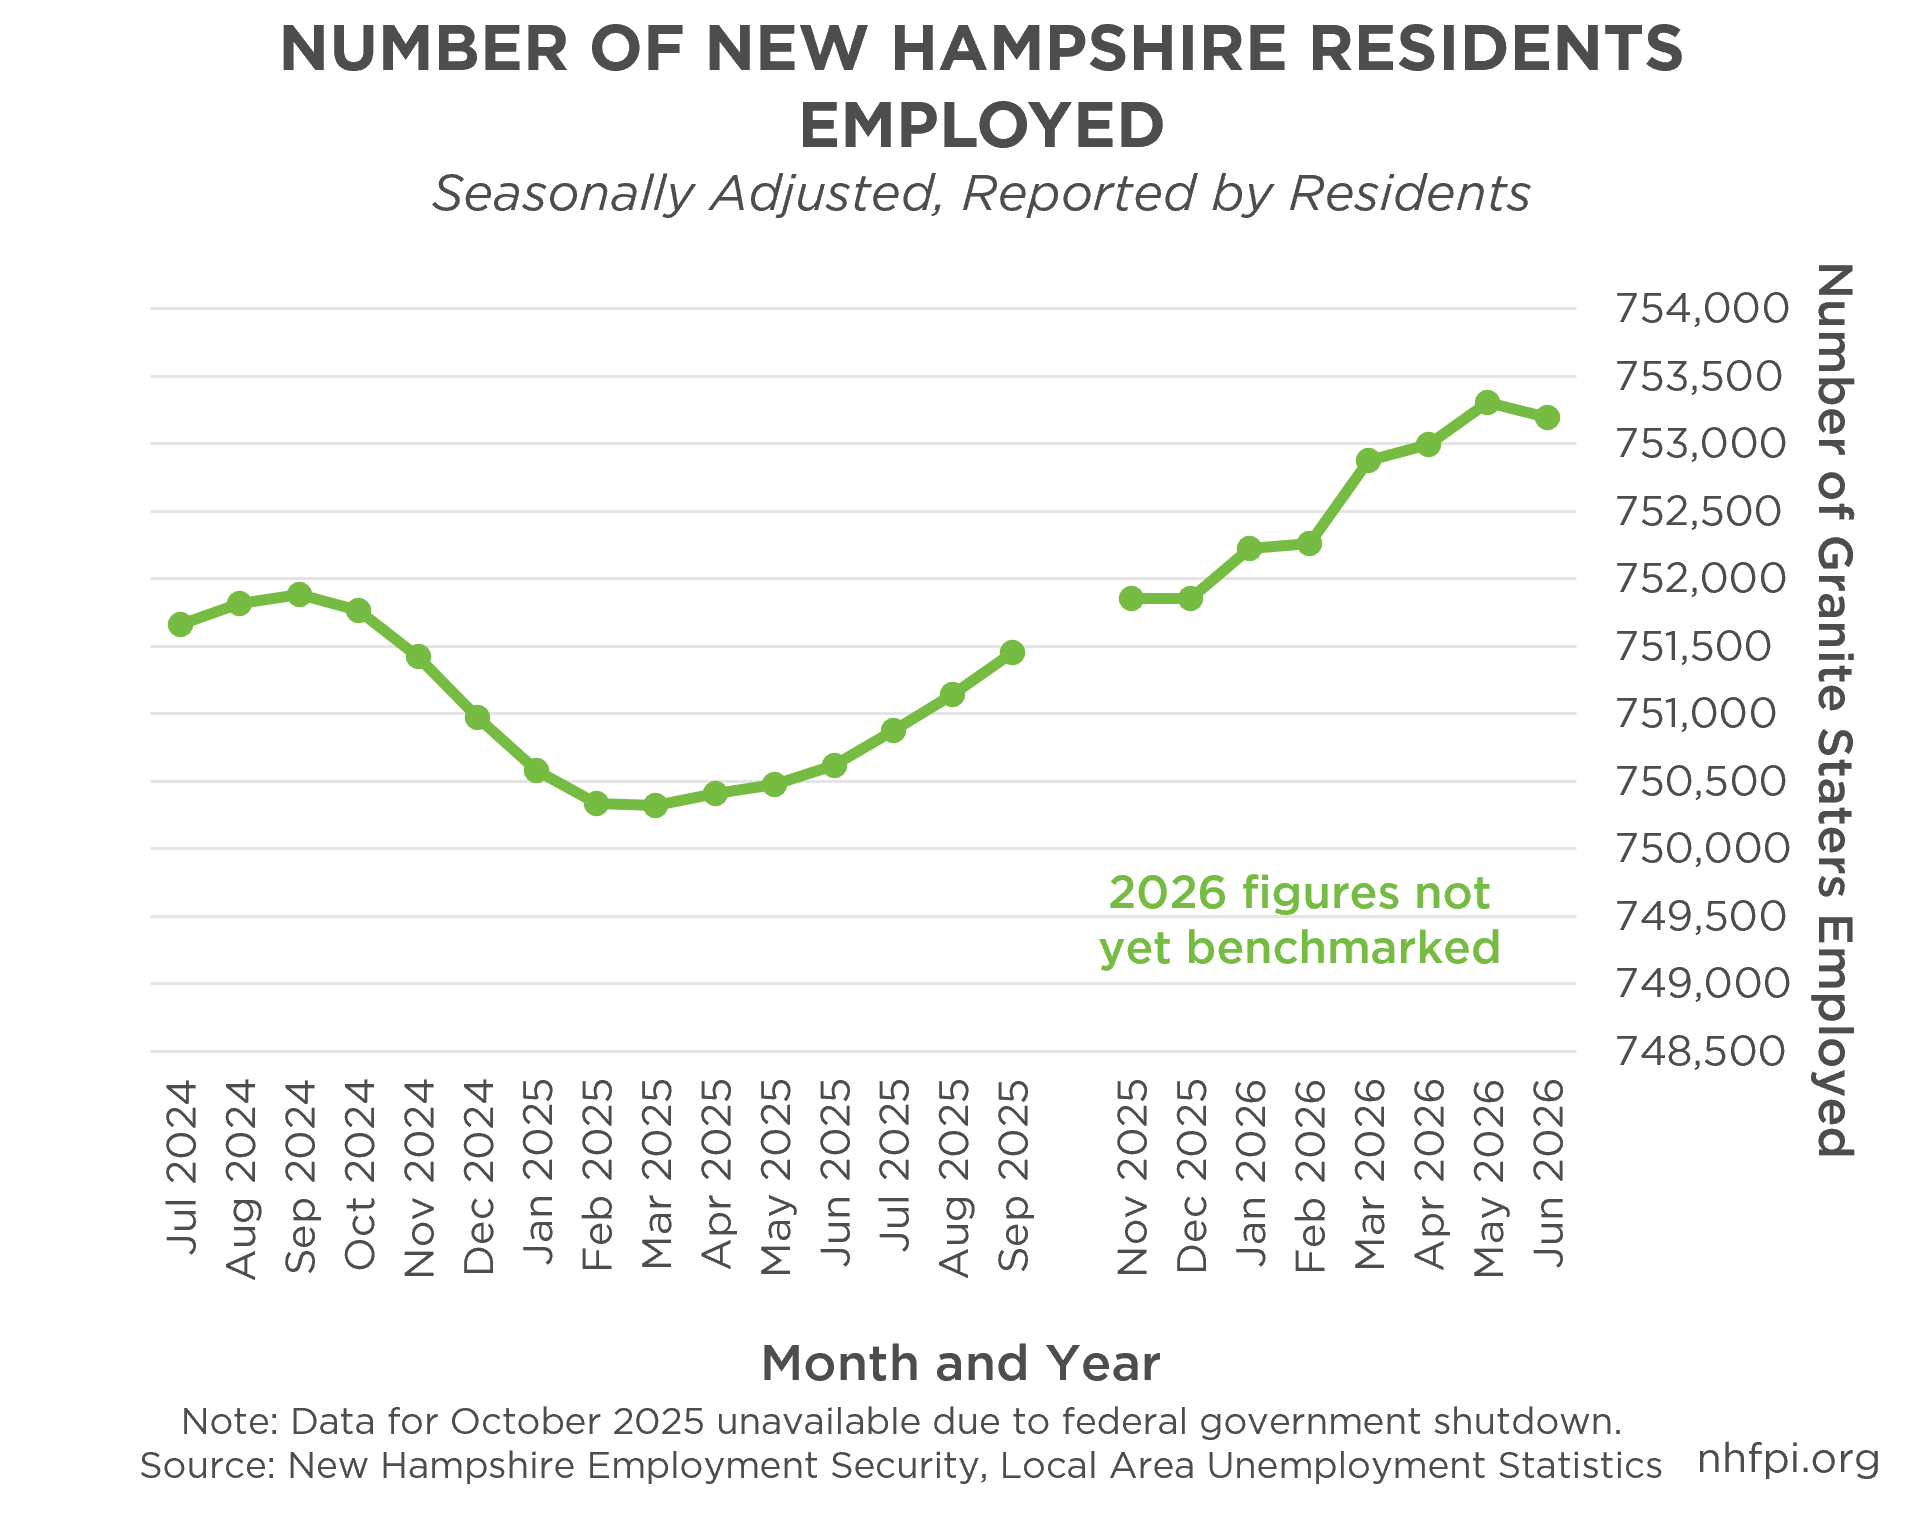
New Hampshire employment typically varies throughout the year. The number of employed Granite Staters typically peaks in July. Seasonal adjustment accounts for predictable patterns and helps show underlying economic trends. The State’s summer employment increase was smaller in 2025 than in prior years.[4]
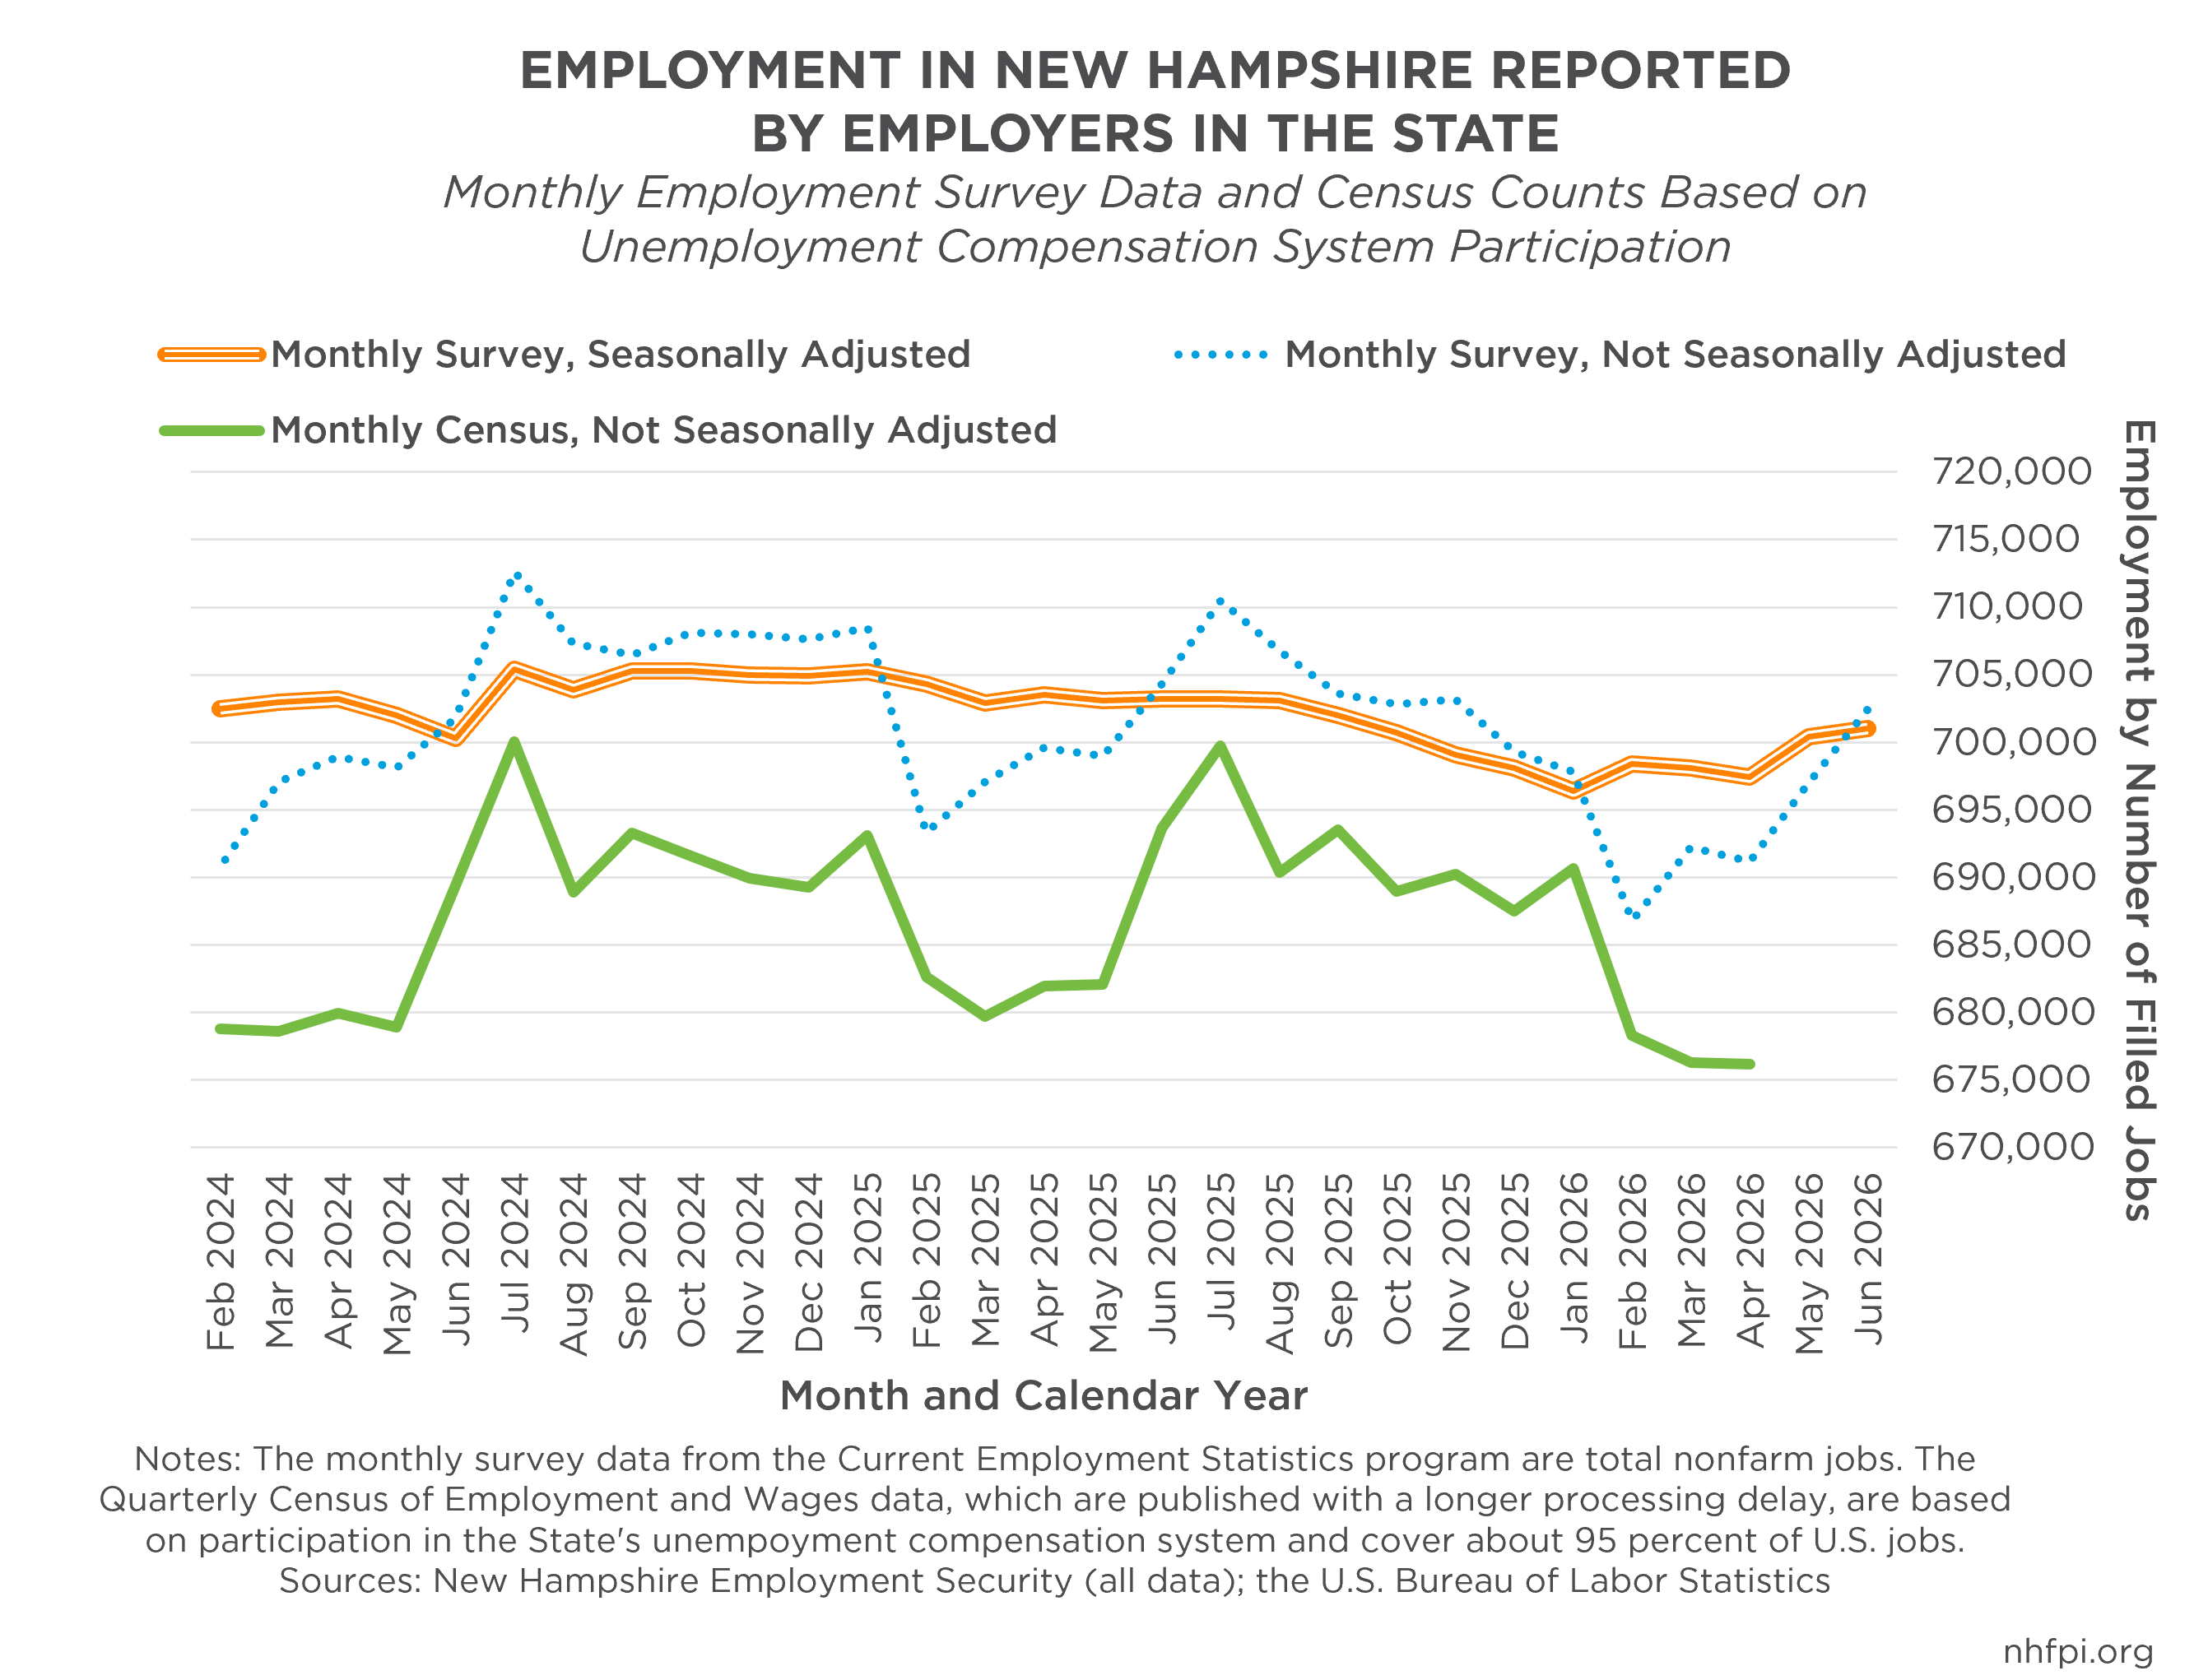
Employer-reported data provide another set of insights into the labor market. These data show that New Hampshire had a “low-hire, low-fire” labor market in 2025, a term used by several analysts and organizations, including the U.S. Federal Reserve Chair, to describe the national labor market during the past year. Monthly surveys of businesses suggest that employment based in New Hampshire fell in 2025 compared with 2024. However, the six-month rolling average of monthly job changes improved from an average loss of 1,133 jobs per month in November 2025 to an average gain of 1,517 jobs per month in June 2026. This change suggests that payroll employment strengthened during the second quarter of 2026, although preliminary estimates remain subject to revision.[5]
Data based on employer participation in the unemployment compensation system, which provides closer to a census of the number of jobs based in the state than the monthly survey, do not show a rebound in employment through the first three months of 2026, which are the most recently available data.[6] The monthly surveys showing the rebound in employment, including both with and without seasonal adjustments, provide the best available data for New Hampshire-based employment growth thus far in 2026.
Unemployment compensation claims provide additional insight into the 2025 decline in payroll employment. If widespread layoffs had caused the decline, initial claims would likely have increased more sharply. Instead, initial claims increased only modestly, which suggests that employers were not broadly reducing their existing workforce. Continued weeks of benefits claimed did rise. They increased from a monthly average of 14,087 during the first seven months of 2024 to 16,304 during the same period in 2025, a 15.7% increase. Continued weeks remained elevated in 2026. They averaged about 17,279 per month during the first seven months, 6.0% above the same period in 2025.[7]
Together, these data suggest that slower hiring and fewer opportunities for unemployed workers drove much of the slowdown in the labor market. There was no large increase in layoffs. Employers may have retained existing workers while limiting new hiring or expansion because of economic uncertainty.[8] The increase in continued weeks claimed also suggests that some unemployed workers received benefits for longer periods. These data suggest that, although payroll employment began to recover in 2026, some job seekers still faced challenging conditions and had trouble finding work.
Business Employment Dynamics data show that New Hampshire’s private-sector companies lost a net of 9,658 jobs between June and September 2025. Net gains during January through March and October through December totaled 5,1219 jobs gained. The U.S. Census Bureau’s Quarterly Workforce Indicators provide a complementary view by showing net changes in private-sector jobs by company size. In 2025, companies with fewer than 20 employees added a net 3,663 jobs. This was about 79% of the 4,612 net jobs added across five company-size groups. Companies with 20 to 49 employees added 575 jobs, while those with 50 to 249 employees added 661 jobs. While employment among large companies shrank, small businesses drove job growth in New Hampshire.[9]
Job Changes by Sector
The largest employment sector in New Hampshire in 2025 was Health Care and Social Assistance. This sector grew past Retail Trade to become the largest employment sector in the State in 2019, and has maintained that top position since then.[10] However, no single industry dominates employment in New Hampshire. In 2025, only Health Care and Social Assistance, Retail Trade, and Manufacturing accounted for more than 10% of jobs based in the State as individual sectors. Together with Accommodation and Food Services and Local Government, these five industries accounted for more than half of New Hampshire-based employment in 2025. Employment diversity can make states more resilient during economic downturns by limiting the effects of weakness in one industry. New Hampshire’s varied employment base may help the State withstand sector-specific contractions.

Records from organizations participating in the State’s unemployment compensation program show an average of 690,017 New Hampshire-based jobs with employees across all sectors in 2024, and 688,421 in 2025. This decrease of 1,596 jobs was not distributed evenly across industries. The largest job losses occurred in Federal, State, and Local Government (-2,009), Wholesale Trade (-1,182), Manufacturing (-1,028), and Retail Trade (-1,004). The largest gains occurred in Health Care and Social Assistance (2,407) and Arts, Entertainment, and Recreation (1,178). Without the growth in Health Care and Social Assistance, the loss of jobs based in New Hampshire between 2024 and 2025 would have been nearly two and a half times larger.[11]
Labor Force Constraints Easing in New Hampshire
For most of the past decade, the primary constraint on New Hampshire’s economic growth has been a labor force that was small relative to available job opportunities.[12]
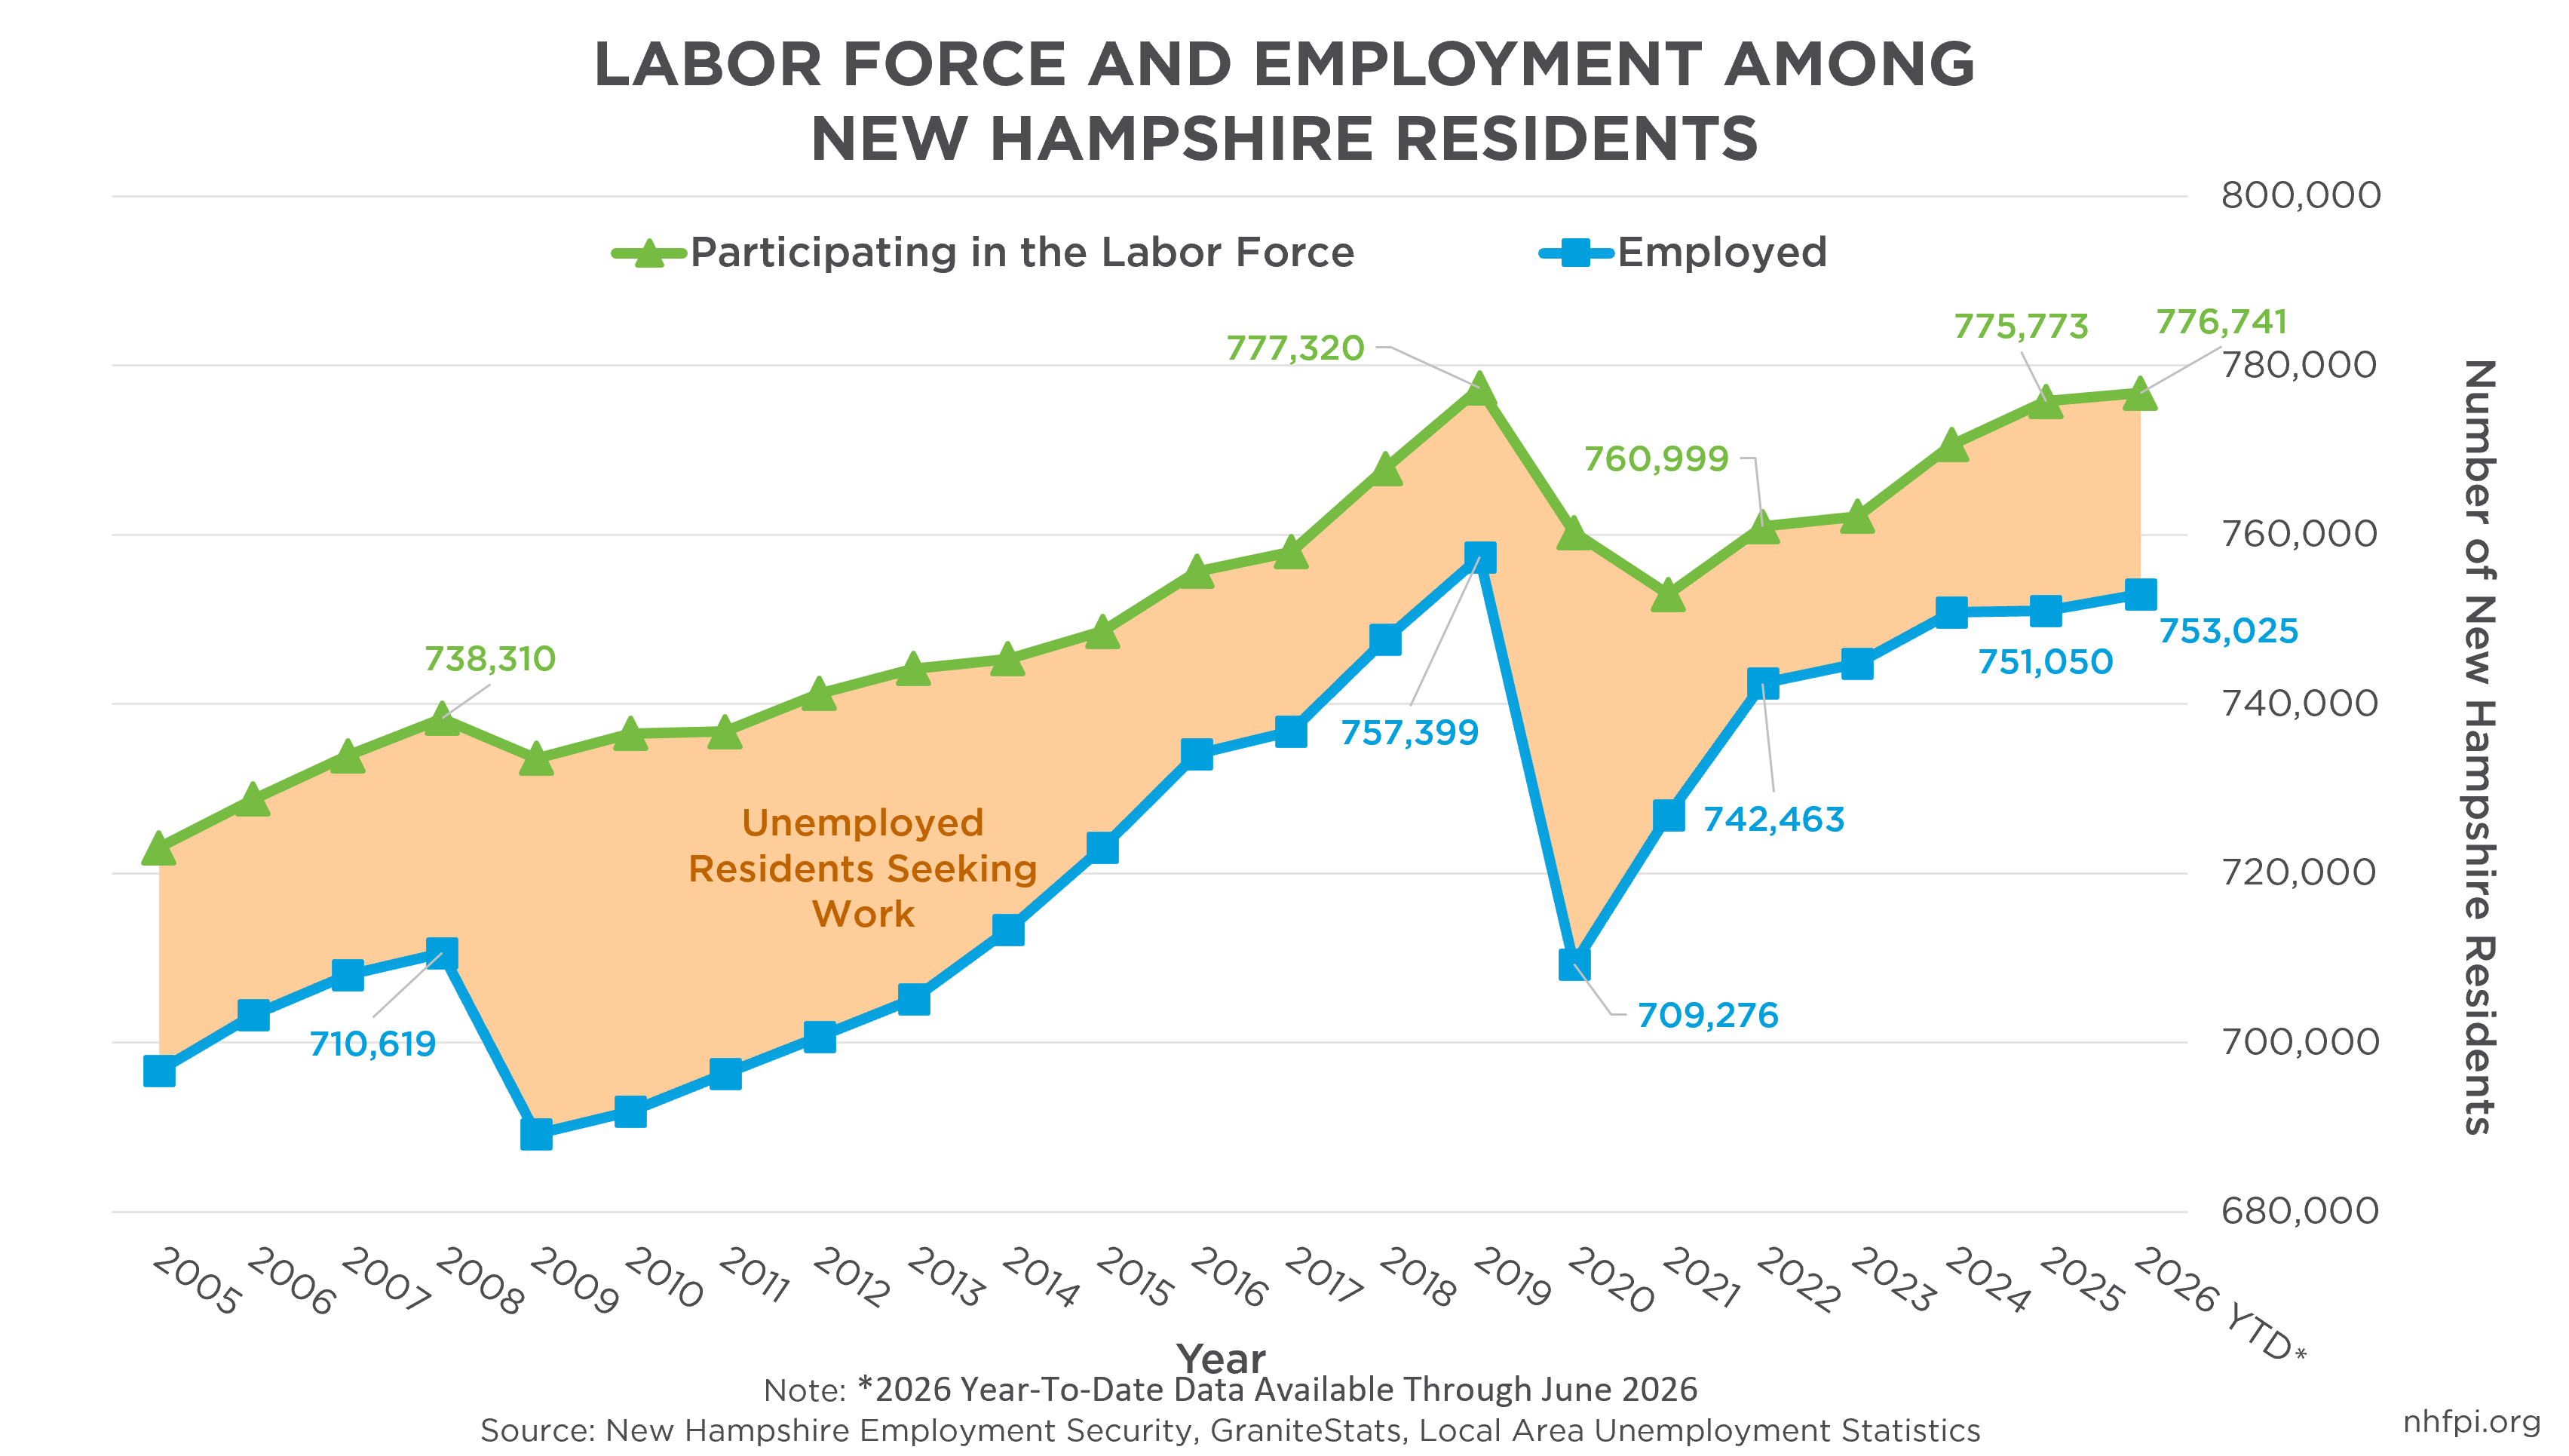
New Hampshire’s labor force includes people who work full time or part time and unemployed people who are actively seeking work.[13] The labor force grew by 0.7% in 2025, reaching approximately 775,773 people. This growth was slower than the 1.1% increase in 2024, but near the 0.6% annual average from 2010 through 2019. These data suggest that the labor force has mostly recovered from the COVID-19 pandemic, although it remained below its 2019 peak.
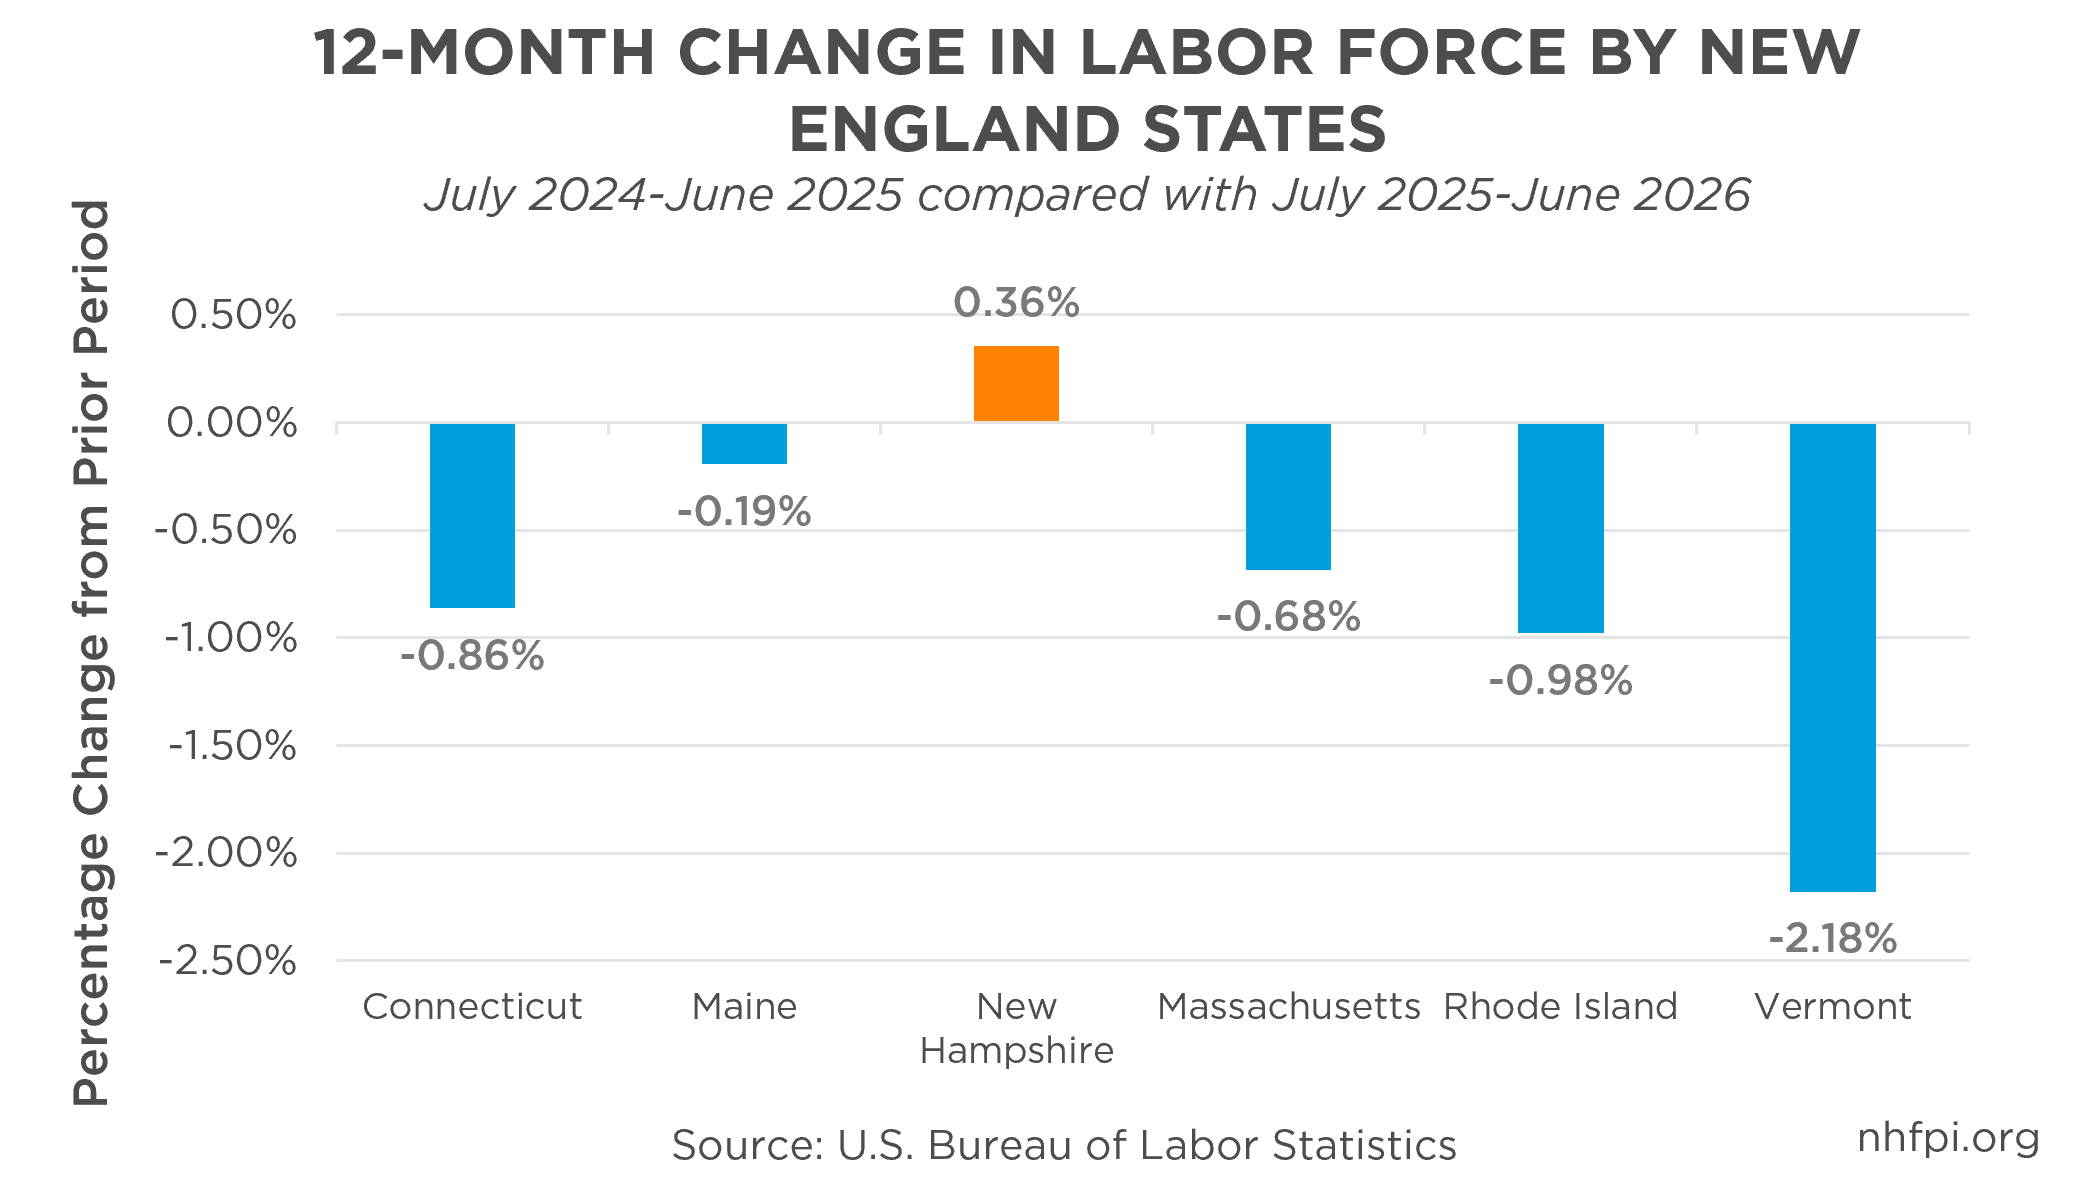
Preliminary, unbenchmarked data show continued labor force growth in 2026, despite declines in June and July. The average number of New Hampshire residents in the labor force during the first six months of 2026 was about 776,741 people, 0.1% above the 2025 average. Employment grew about 0.3% during the same period, which reduced the number of labor force participants who were unemployed. In 2025, the annual average unemployment rate rose for the first time in almost 10 years, when excluding the period with elevated unemployment directly associated with the COVID-19 pandemic. The rate fell below 3% in 2026 after averaging 3.2% in 2025, but still remains above the average 2.6% unemployment rate in 2024. Both the labor force and the unemployment rate declined in July 2026, according to preliminary data. Across New England, New Hampshire was the only state whose labor force grew during the 12 months ending June 2026. Vermont (-2.18%) and Rhode Island (-0.98%) had the largest declines.[14]
The labor force did not grow uniformly across age groups. Between the years ending June 2025 and June 2026, the number of Granite Staters in the labor force increased by 11,633. The labor force participation rate, or the share of people age 16 and older who were working or actively seeking work, increased to 65.5%. The rate for people ages 16 to 19 rose by about 9% after falling in the prior period. Rates also rose for people ages 20 to 24, 35 to 44, and 45 to 54. They fell for people ages 25 to 34, and 55 to 64. This pattern reversed the 2025 trend, when labor force participation rates fell for all groups ages 16 to 44. The participation rate for ages 20 to 24 increased despite the decline in participants in the labor force.
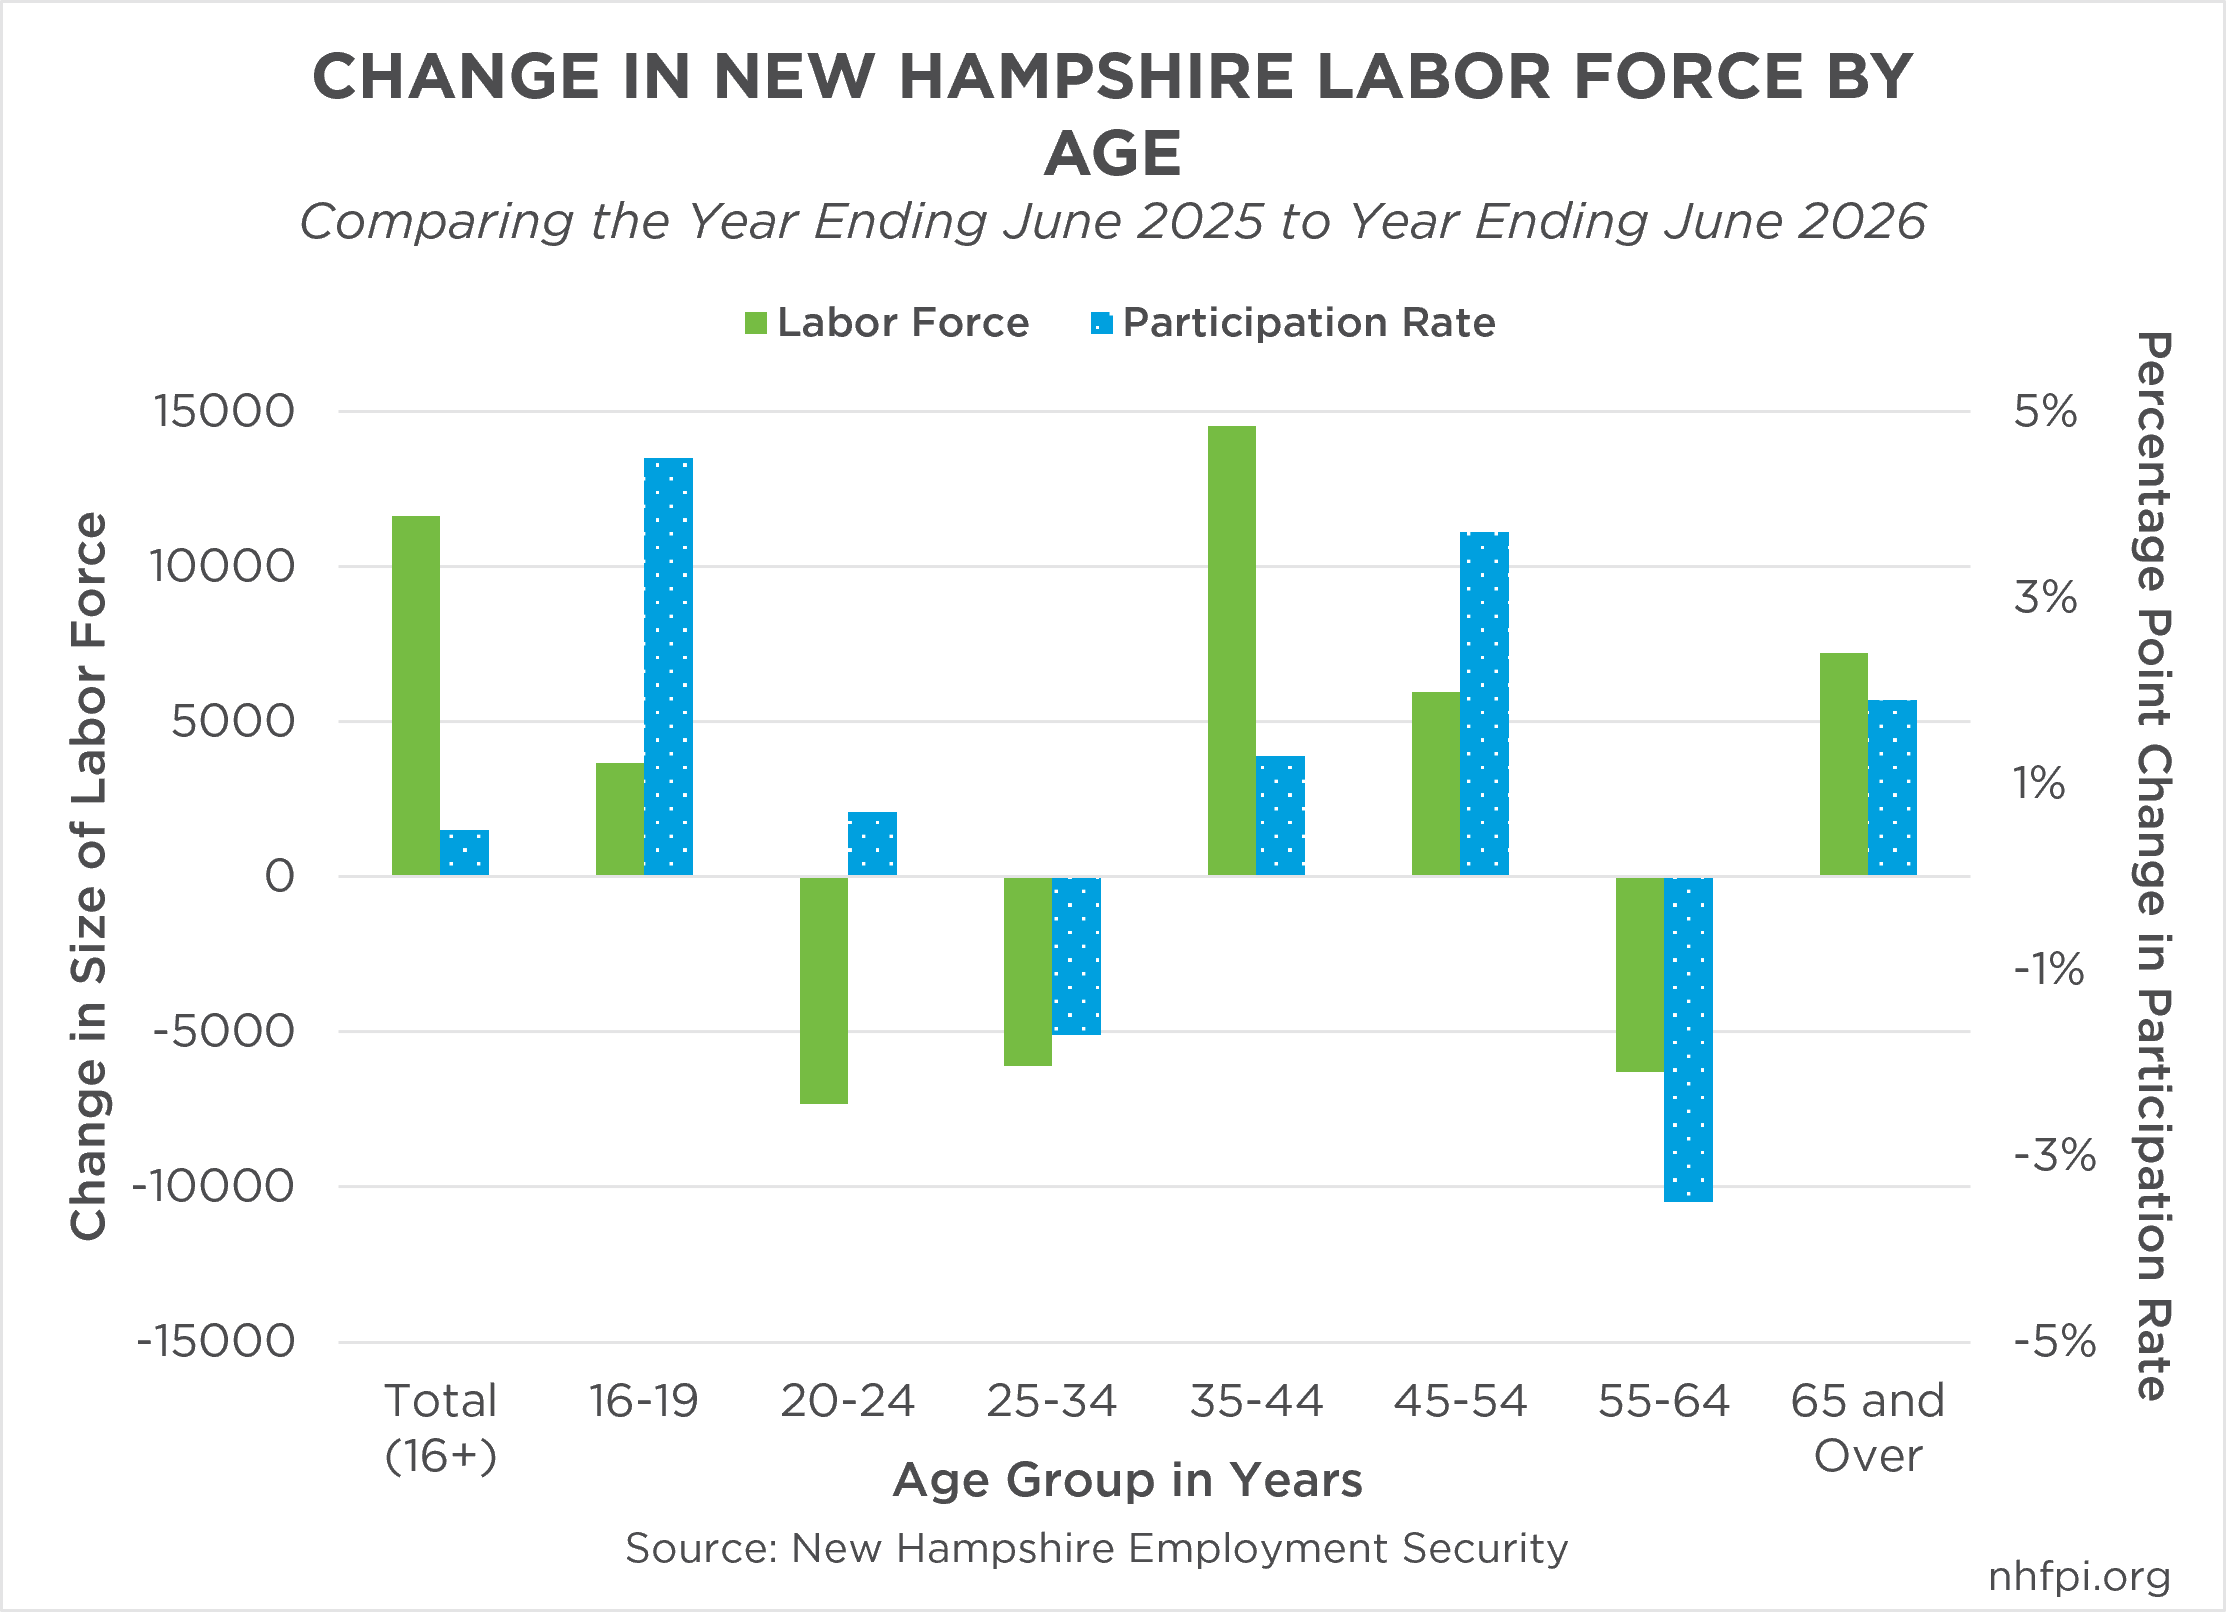
This shift suggests that the growth came from older age groups or migration into the State. The share of workers age 35 and older increased from 73.7% to 74.3%. About 24.1% of Granite Staters age 65 and older participated in the labor force and comprised about 9.6% of all workers in the year ending June 2026.[15]
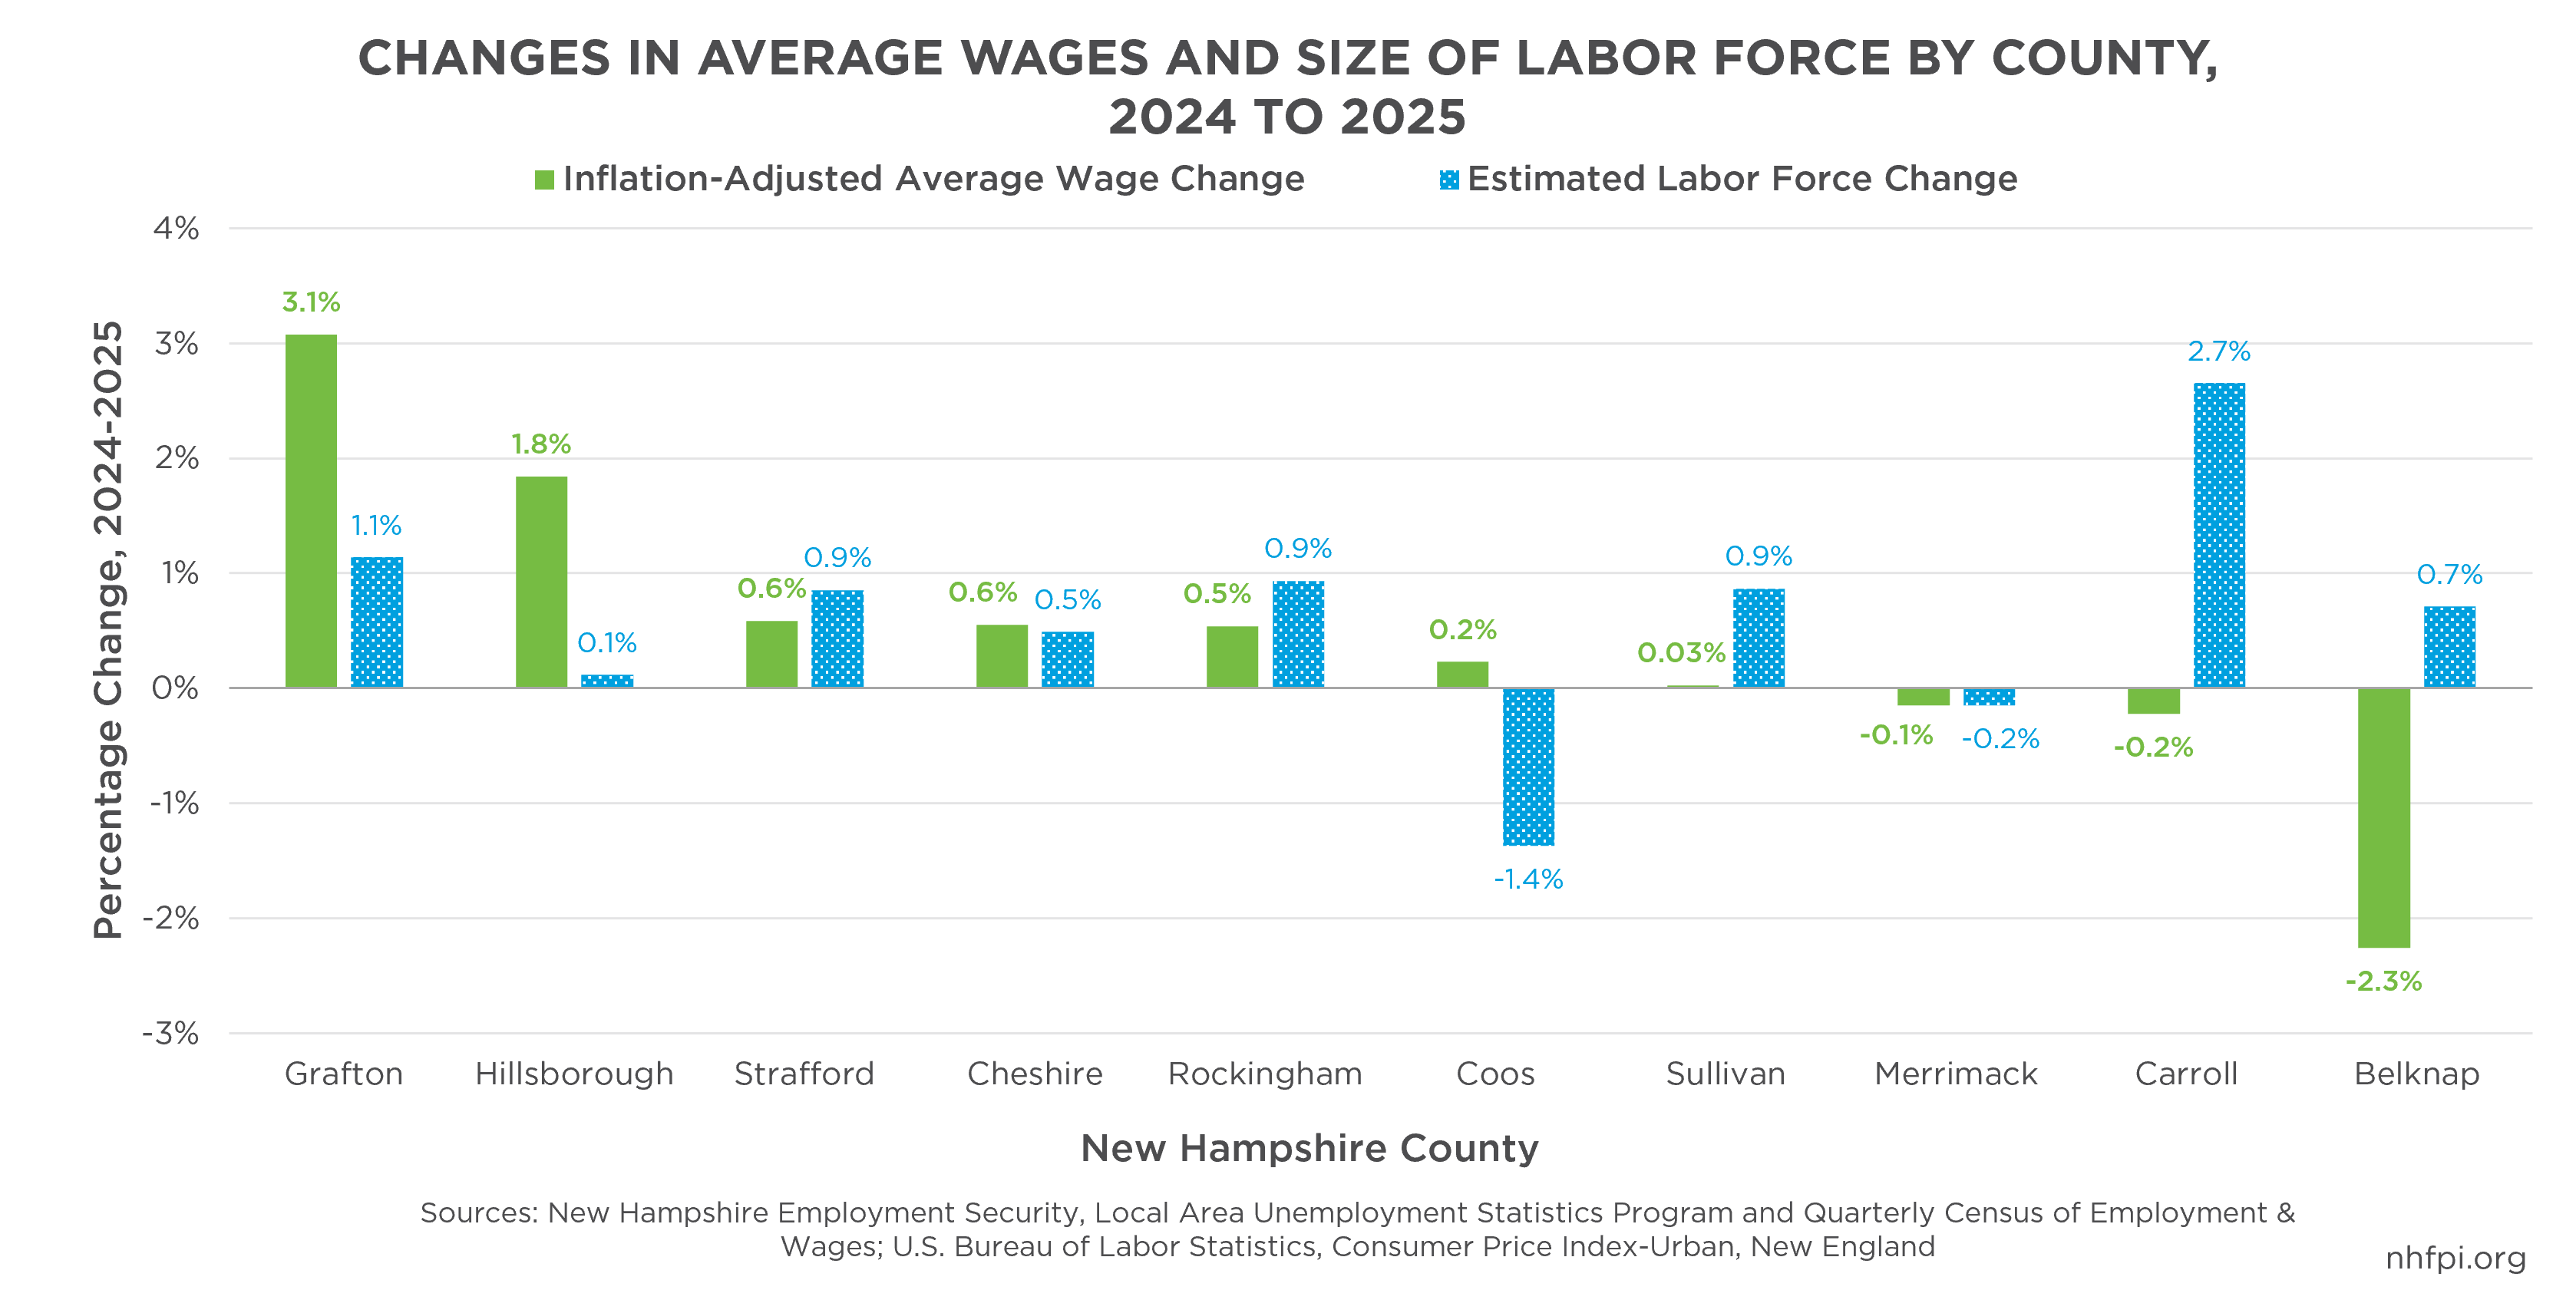
A different dataset permits county-level comparisons for 2024 and 2025. Household survey data show that the labor force expanded in every county except Coos and Merrimack counties. The data suggest that the counties whose labor force expanded faster than other New Hampshire counties were Grafton and Carroll counties, which are both rural counties in the northern half of the state. Inflation-adjusted average wages also grew fastest in Grafton County (3.1% growth) and in Hillsborough County (1.8% growth).
Unemployment Drops Below 3% in 2026
Unemployed people are those without a job who were available to work and had actively sought employment during the prior four weeks.[16] The average number of unemployed residents was 24,723 in 2025. During the first seven months of 2025, an average of 24,243 residents were unemployed. During the same period in 2026, the average declined to 23,830 people, or about 1.7% less people than a year earlier. New Hampshire ended 2025 with an unemployment rate of 3.2% in December. The preliminary unemployment rate declined to 2.8% in July 2026. Unemployment can have significant effects on household income. In 2024, the estimated poverty rate for unemployed working-age Granite Staters was 26.2%, compared with 9.6% for part-time workers and 1.2% for full-time workers.[17]
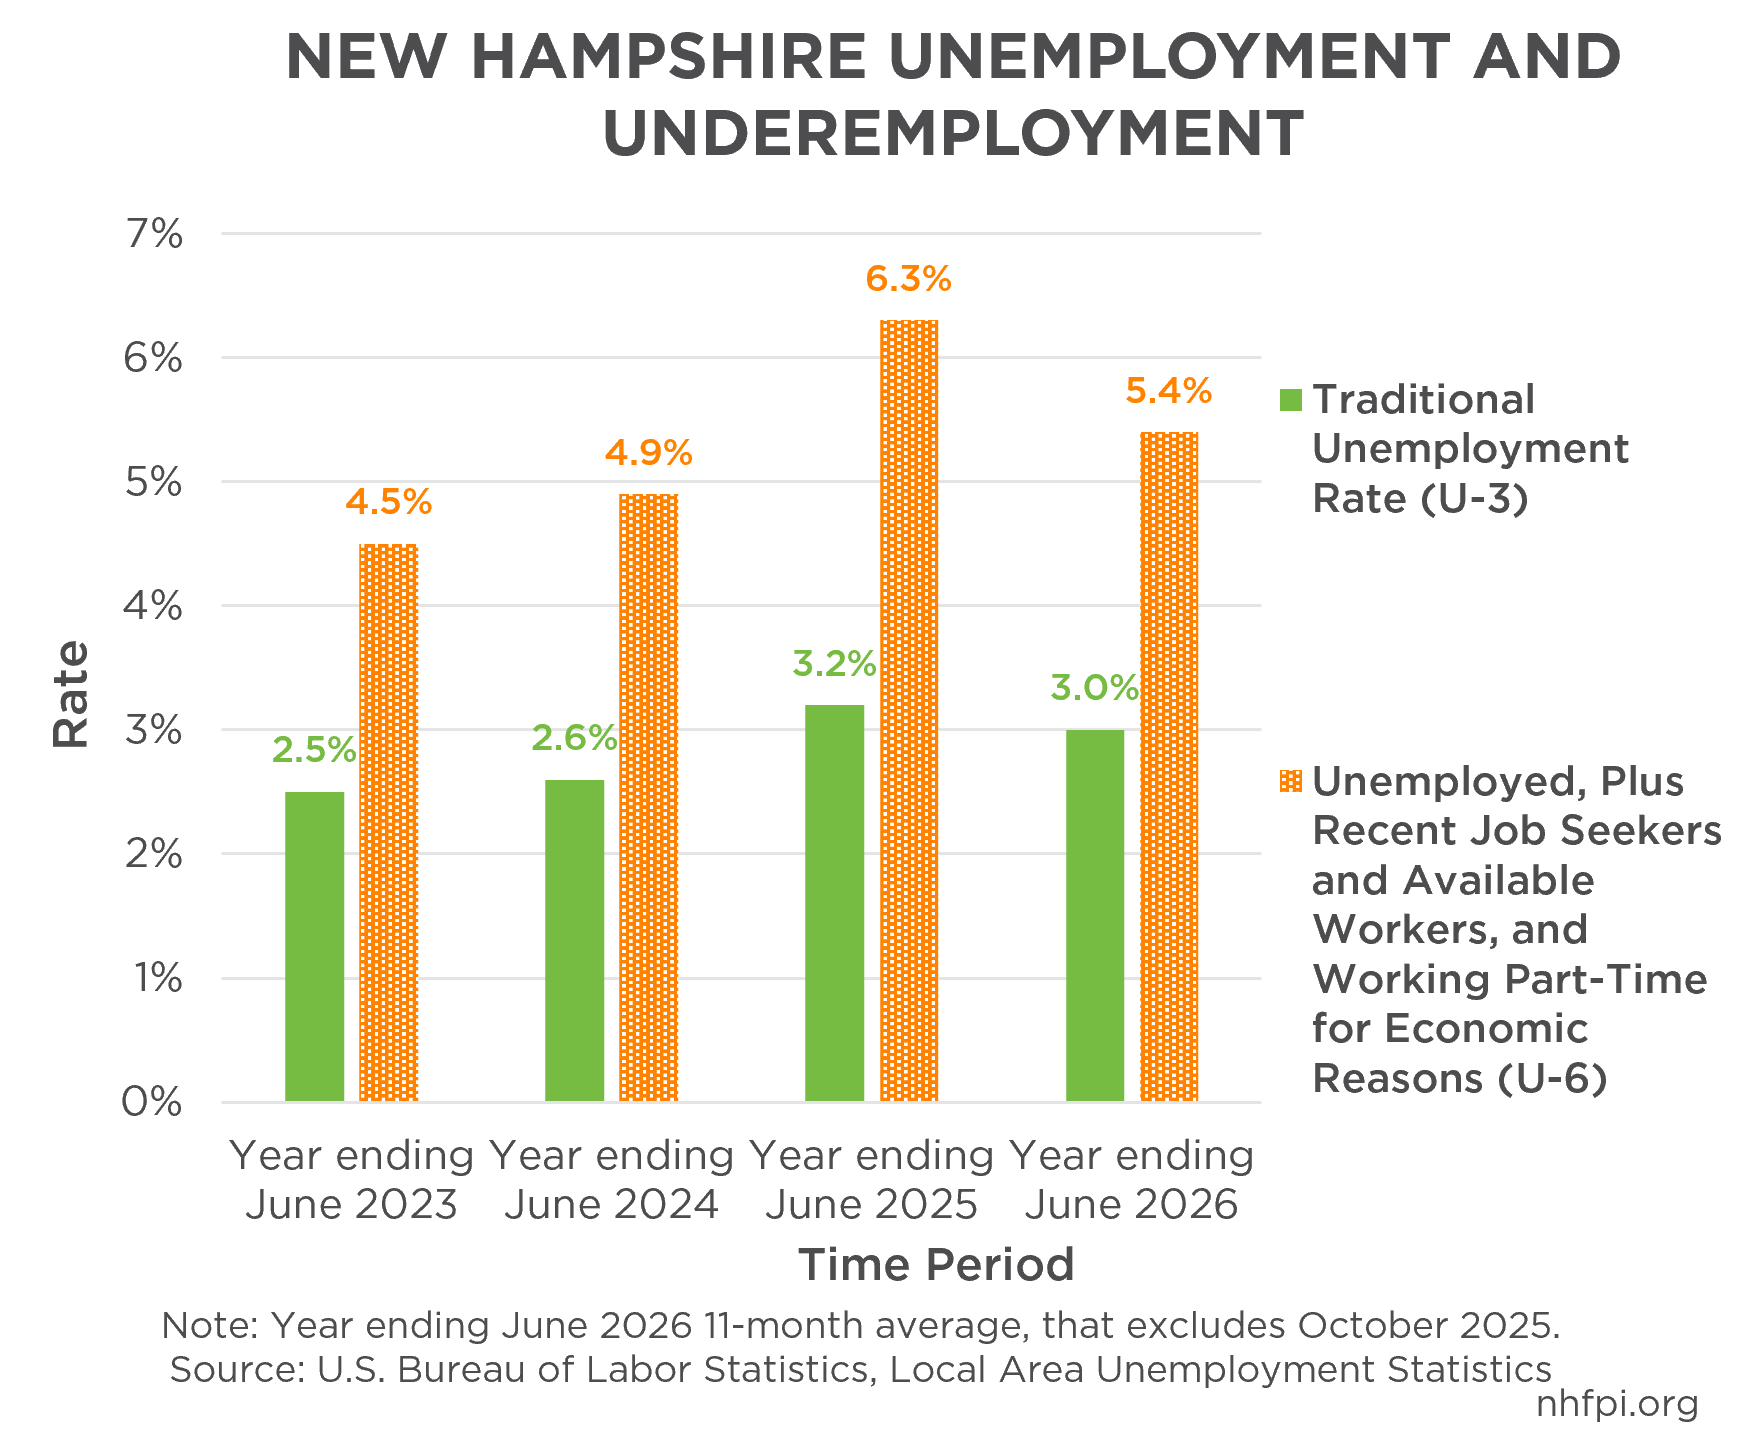
The U-6 labor underutilization rate provides a broader measure of labor market conditions than the standard unemployment rate. It includes unemployed people, people marginally attached to the labor force, and people working part time for economic reasons.[18]
Marginally attached workers want and are available for work and looked for work during the prior 12 months, but not during the prior four weeks, so they are not counted in the traditional (U-3) unemployment rate. Discouraged workers are a subset of this group who stopped looking because they believed suitable jobs were unavailable. People working part time for economic reasons want and are available for full-time work but cannot find full-time work or have had their hours reduced.
New Hampshire’s U-6 rate reached 6.3% for the 12 months ending June 2025 and declined to 5.4% for the period ending June 2026. The decline indicates that measured labor underutilization eased during this period. However, it does not necessarily mean that all affected workers found suitable employment. Some people may have left the labor force and no longer met the criteria for marginal attachment. The U-6 rate also remained higher than in the two periods before 2025.
An Aging Population Makes Migration and Affordability Important to the Labor Force
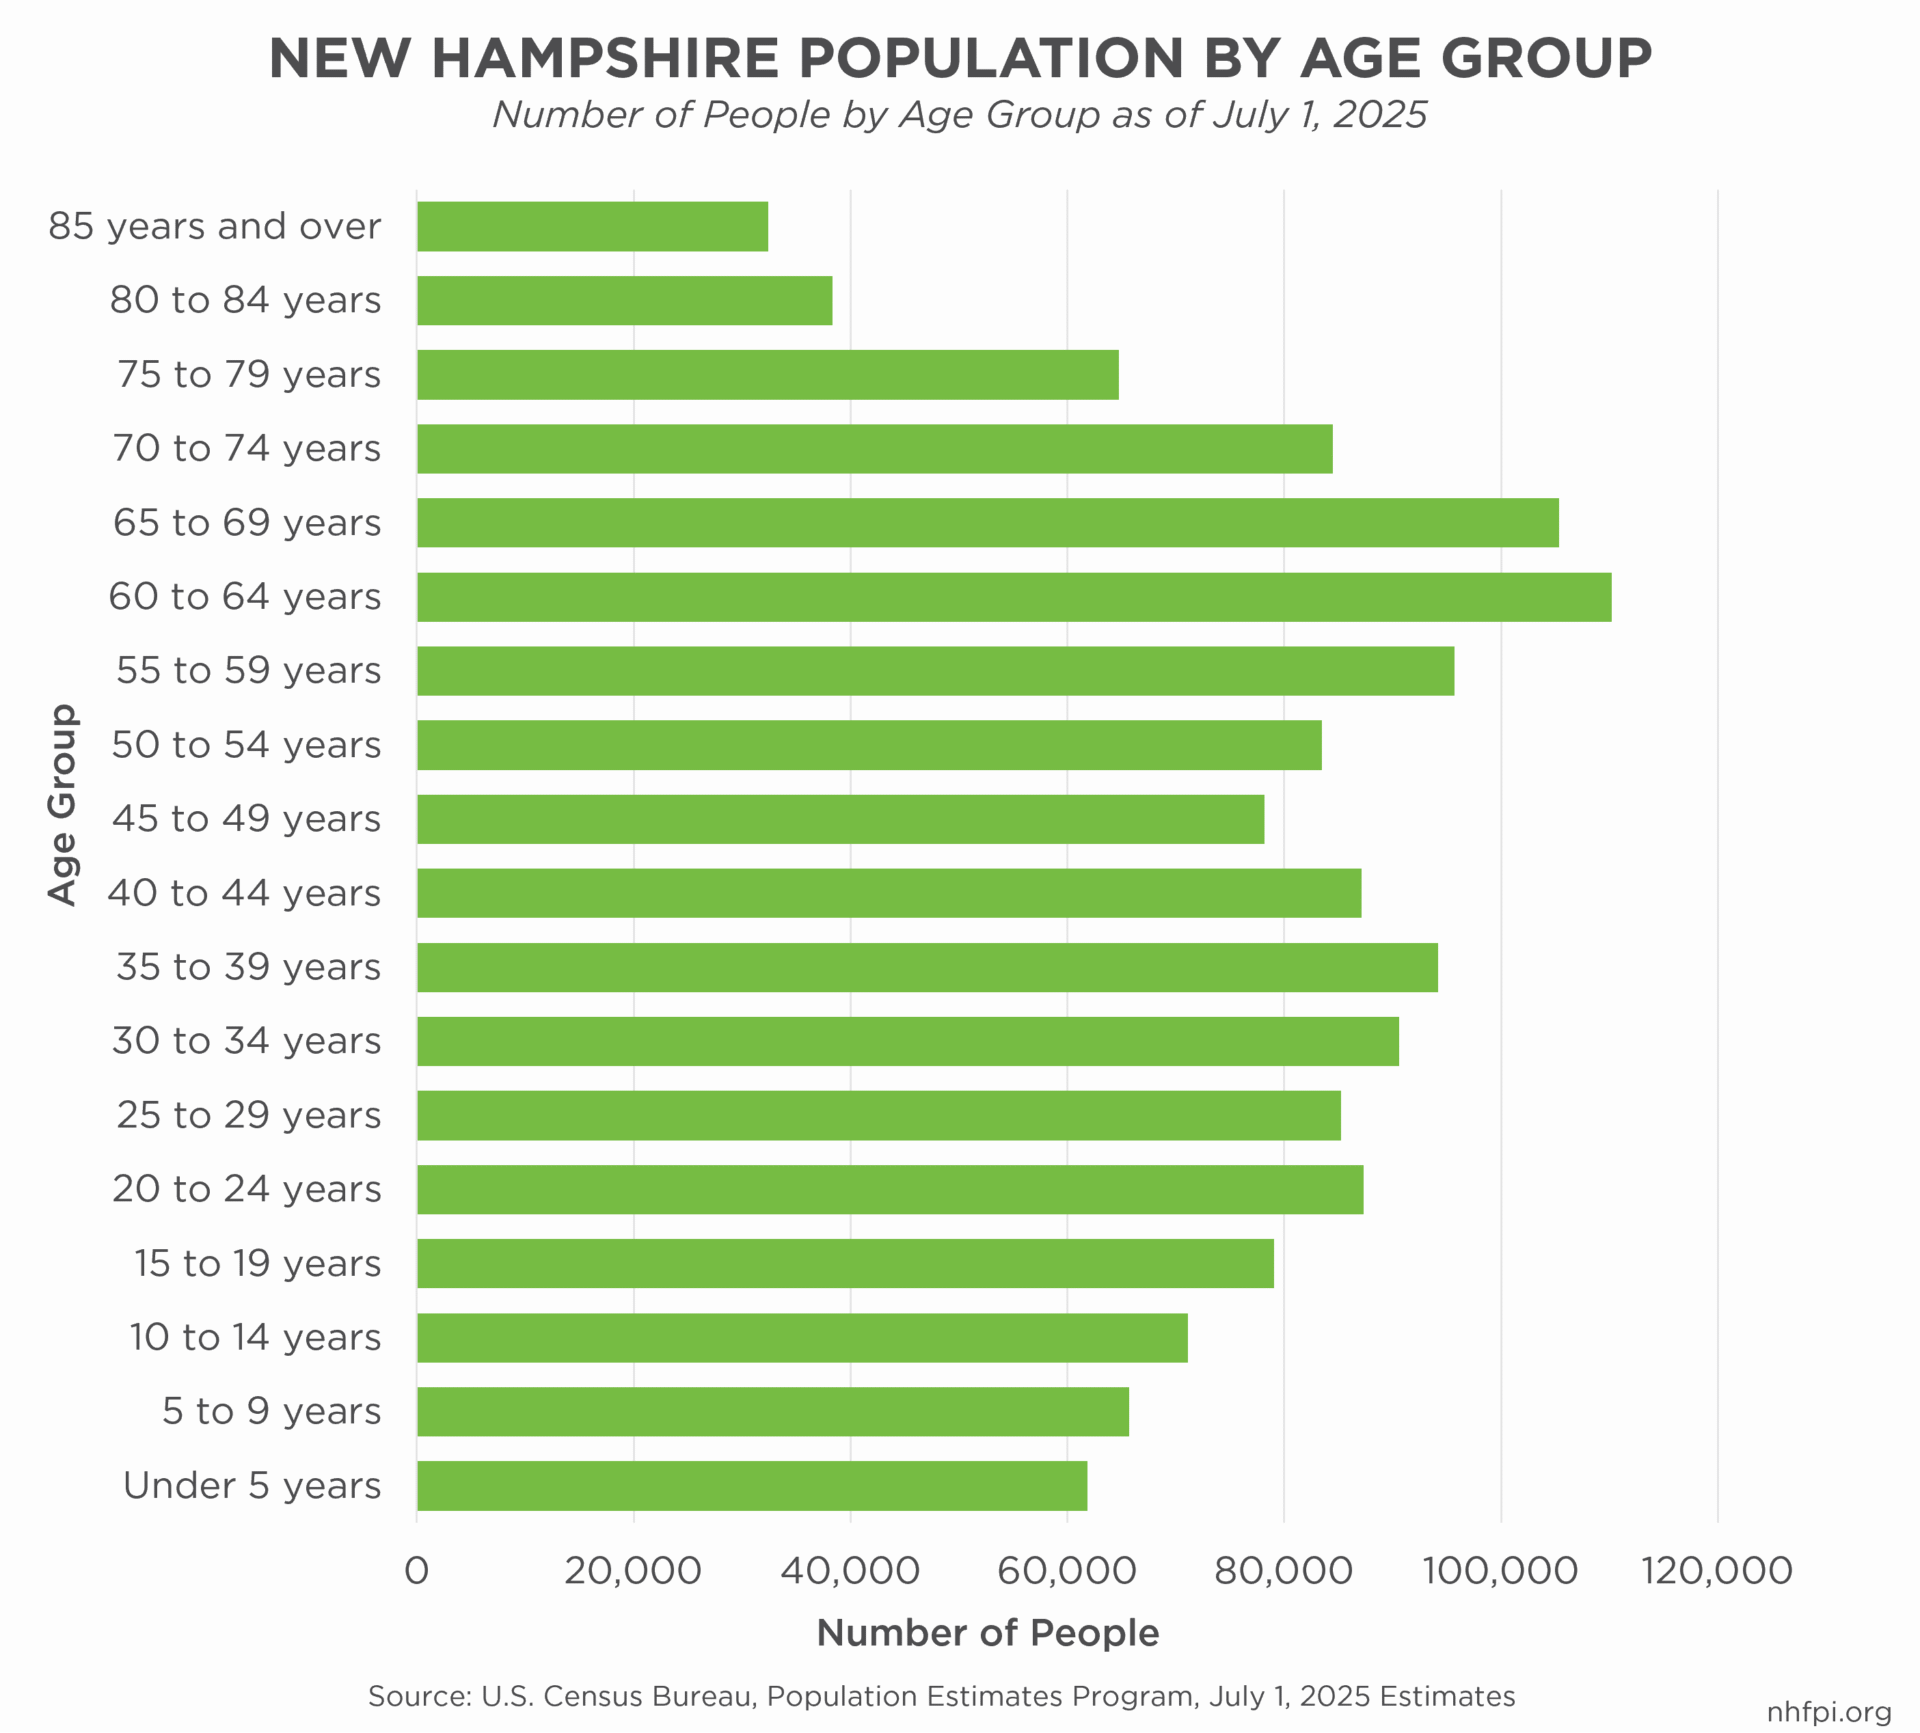
New Hampshire’s aging population will continue to play an important role in shaping the size and composition of the State’s labor force. Adults age 60 to 64 were the largest five-year age group in 2025, and adults age 65 to 69 years old were the second-largest age group.[19] As more Granite Staters approach the traditional retirement age, younger residents and people moving to the State will become more important to continue growing the labor supply.
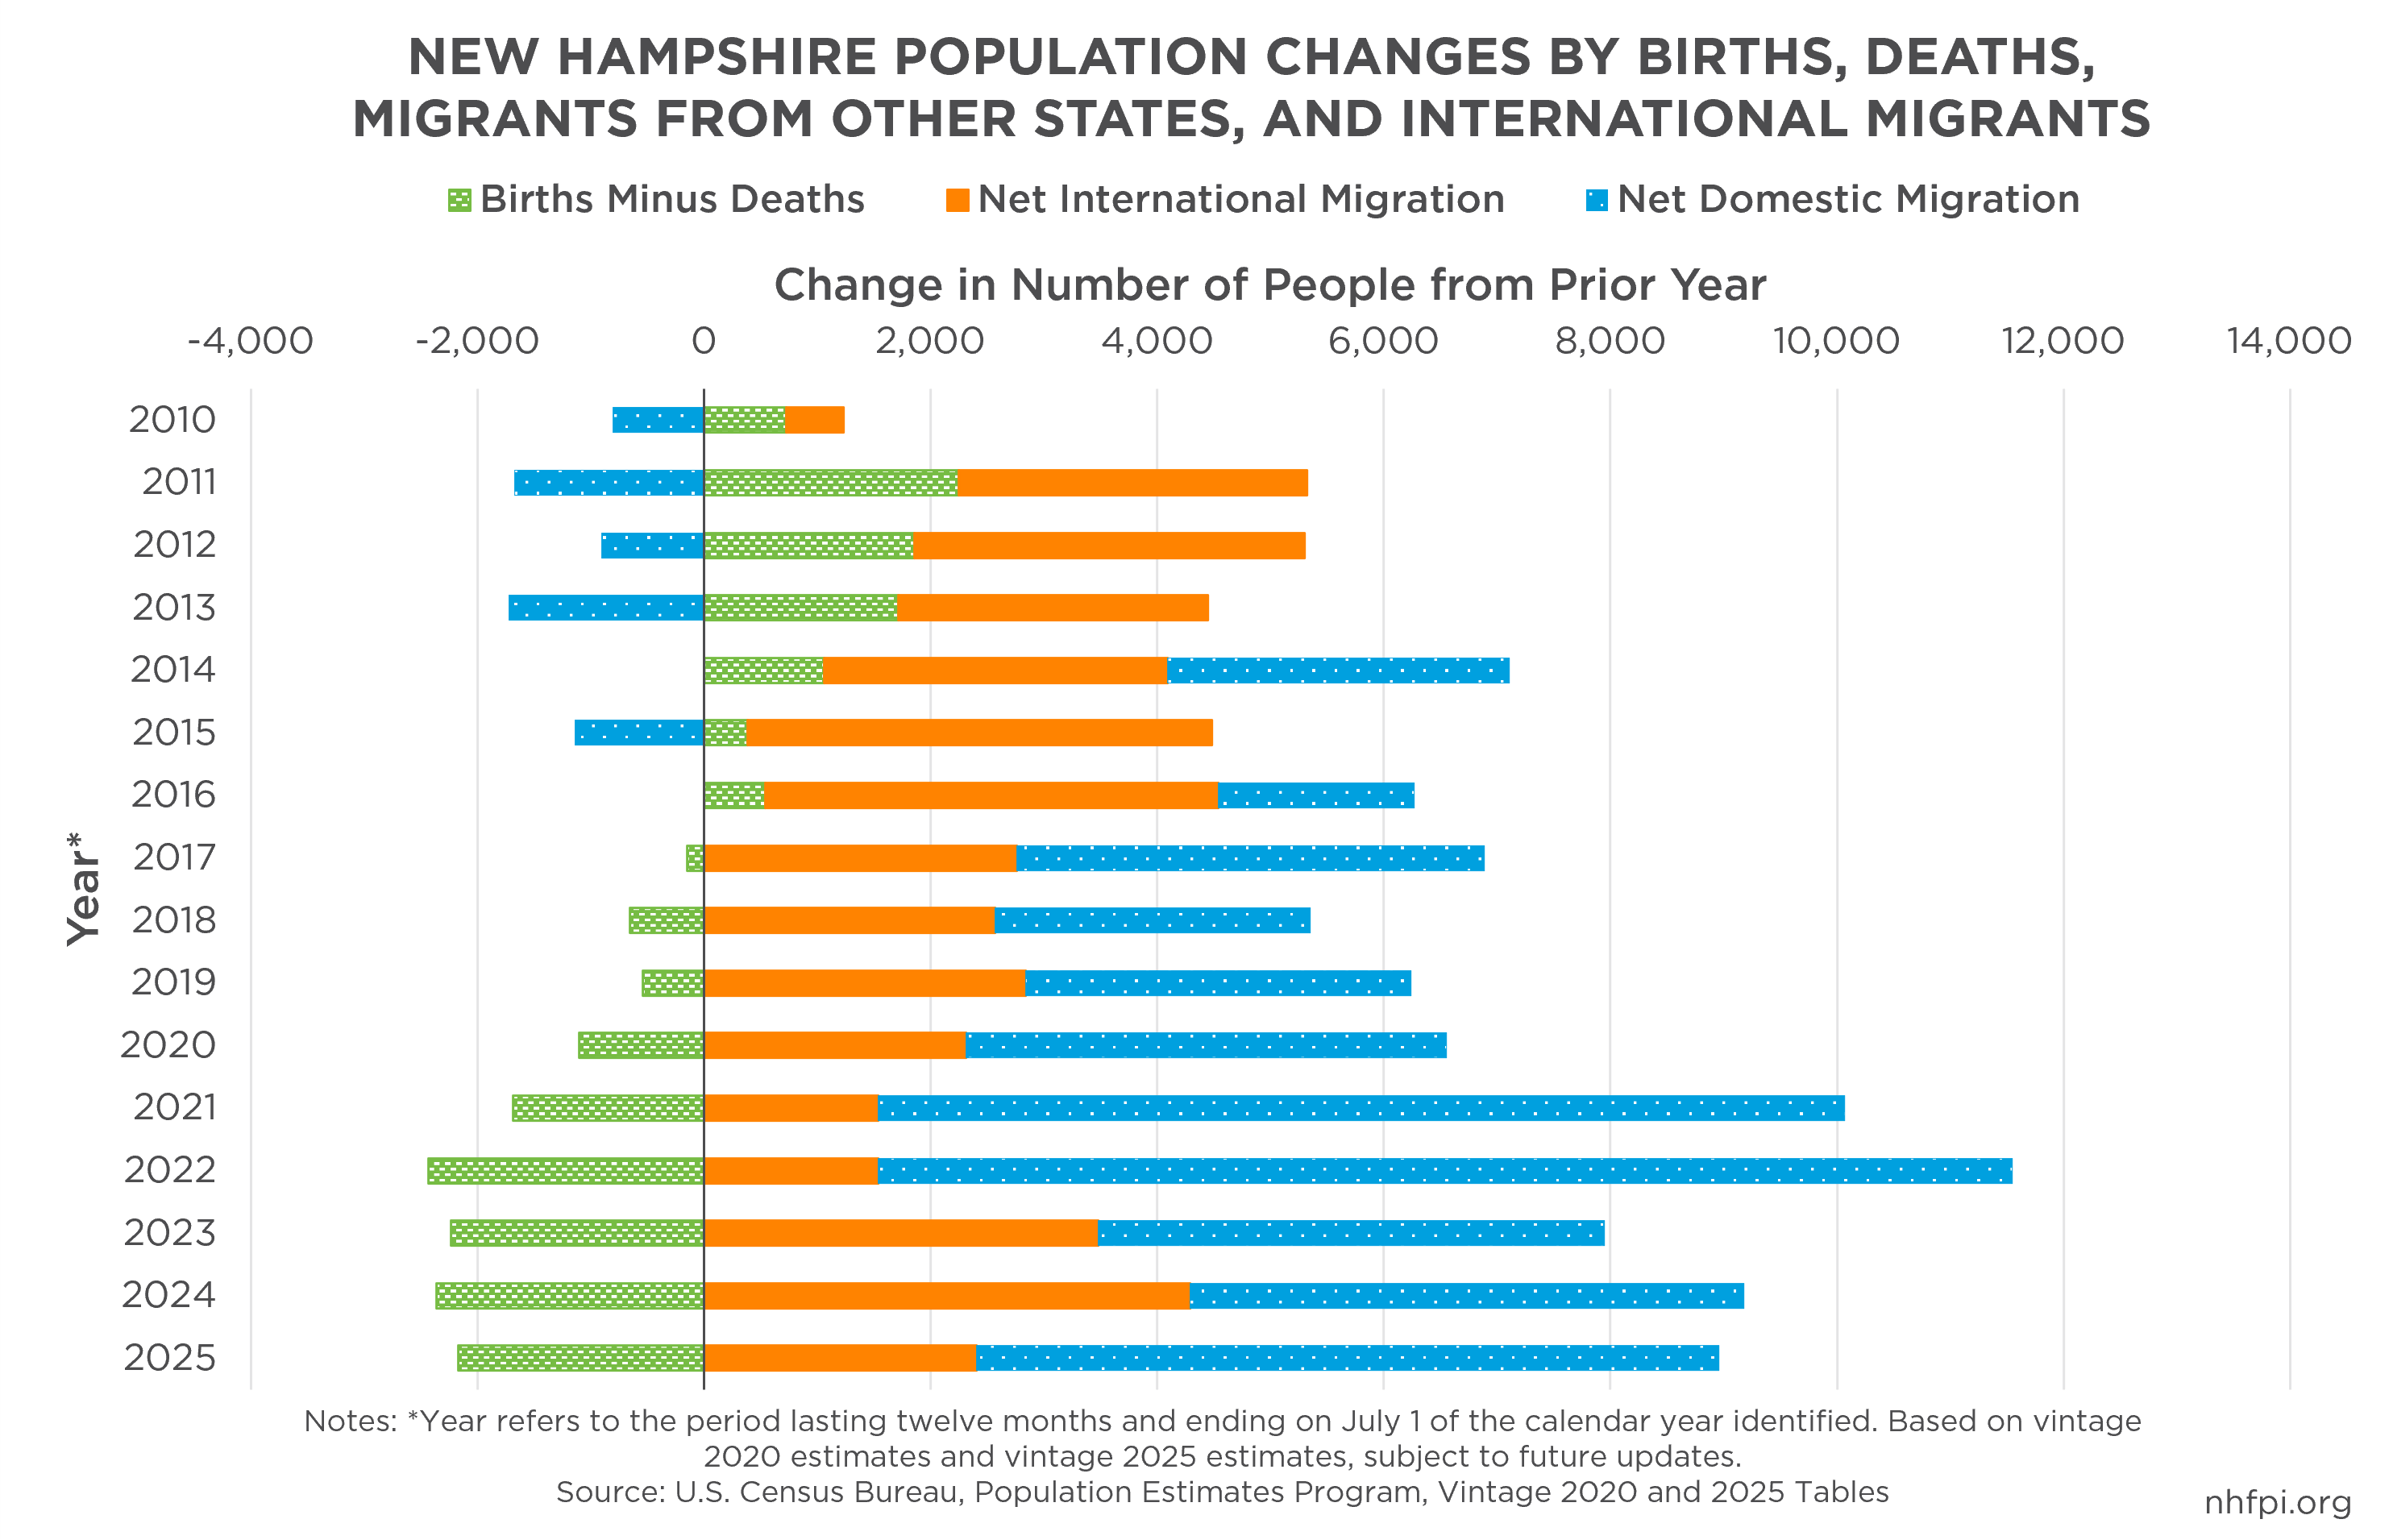
Migration has already become an important piece of New Hampshire’s population growth. Deaths have exceeded births in the State each year since 2017, making interstate movers (the difference between people moving to and from New Hampshire from other U.S. States) the only source of population growth.[20]
Individuals who are of traditional working ages have contributed significantly to this growth, with adults age 26 to 44 accounting for about 57% of New Hampshire’s net gains from interstate movement.[21]
These population changes have important consequences for New Hampshire’s labor supply. The State’s labor force grew in the year ending June 2026, but growth was not the same across age groups. The number of labor force participants ages 20 to 34 declined. Meanwhile, workers age 35 and older increased their share of the labor force. About 24.1% of Granite Staters age 65 and older participated in the labor force. They represented about 9.6% of all workers in the year ending June 2026.
Attracting younger residents does not ensure they will remain in New Hampshire, as housing and child care costs can create significant affordability challenges for younger workers and families.[22] New Hampshire’s median single-family house price reached $535,000 in 2025, a 78.3% increase from 2019 prices.[23] Child care costs can also limit whether parents are able to participate in the labor force. The average annual price for center-based care for an infant and a four-year-old was almost $30,000 in 2025.[24] Housing, child care, and other affordability costs can have an effect on whether younger workers or families with young children decide to move or remain in New Hampshire.
New Hampshire Experiencing a More Balanced Labor Market
In New Hampshire, elevated unemployment can signal lower demand for labor and slower economic growth. The U.S. Bureau of Labor Statistics publishes annual Job Openings and Labor Turnover Survey data for states. These data help measure labor demand and the extent of labor force constraints. One useful indicator is the ratio of job openings to unemployed workers.[25]
In February 2020, New Hampshire had 1.8 job openings for every unemployed worker. The ratio fell sharply during the COVID-19 pandemic before reaching 3.7 in February 2022. This high ratio showed that employers had difficulty finding workers. The imbalance has declined since December 2025, New Hampshire had an estimated one opening for each unemployed worker. This ratio indicates a more balanced labor market than during the prior three years.

Average Wages and Incomes Are Not Keeping Up with Inflation
Using state-level data beginning in 2007, between 2007 and 2024, labor productivity in New Hampshire grew faster than inflation-adjusted hourly compensation. The labor productivity index measures inflation-adjusted economic output per hour worked.[26] The productivity-wage index starts with a base year of 100. A rise in productivity or wages from 100 to 110 means that the indicator value increased 10% relative to the base year. The productivity index in New Hampshire increased to 132.8, showing a 32.8% increase in output per hour from 2007 to 2024. The compensation index rose from 100 to 120.3, a 20.3% increase.[27] The 12.5 percentage-point gap indicates that productivity grew faster than inflation-adjusted compensation.
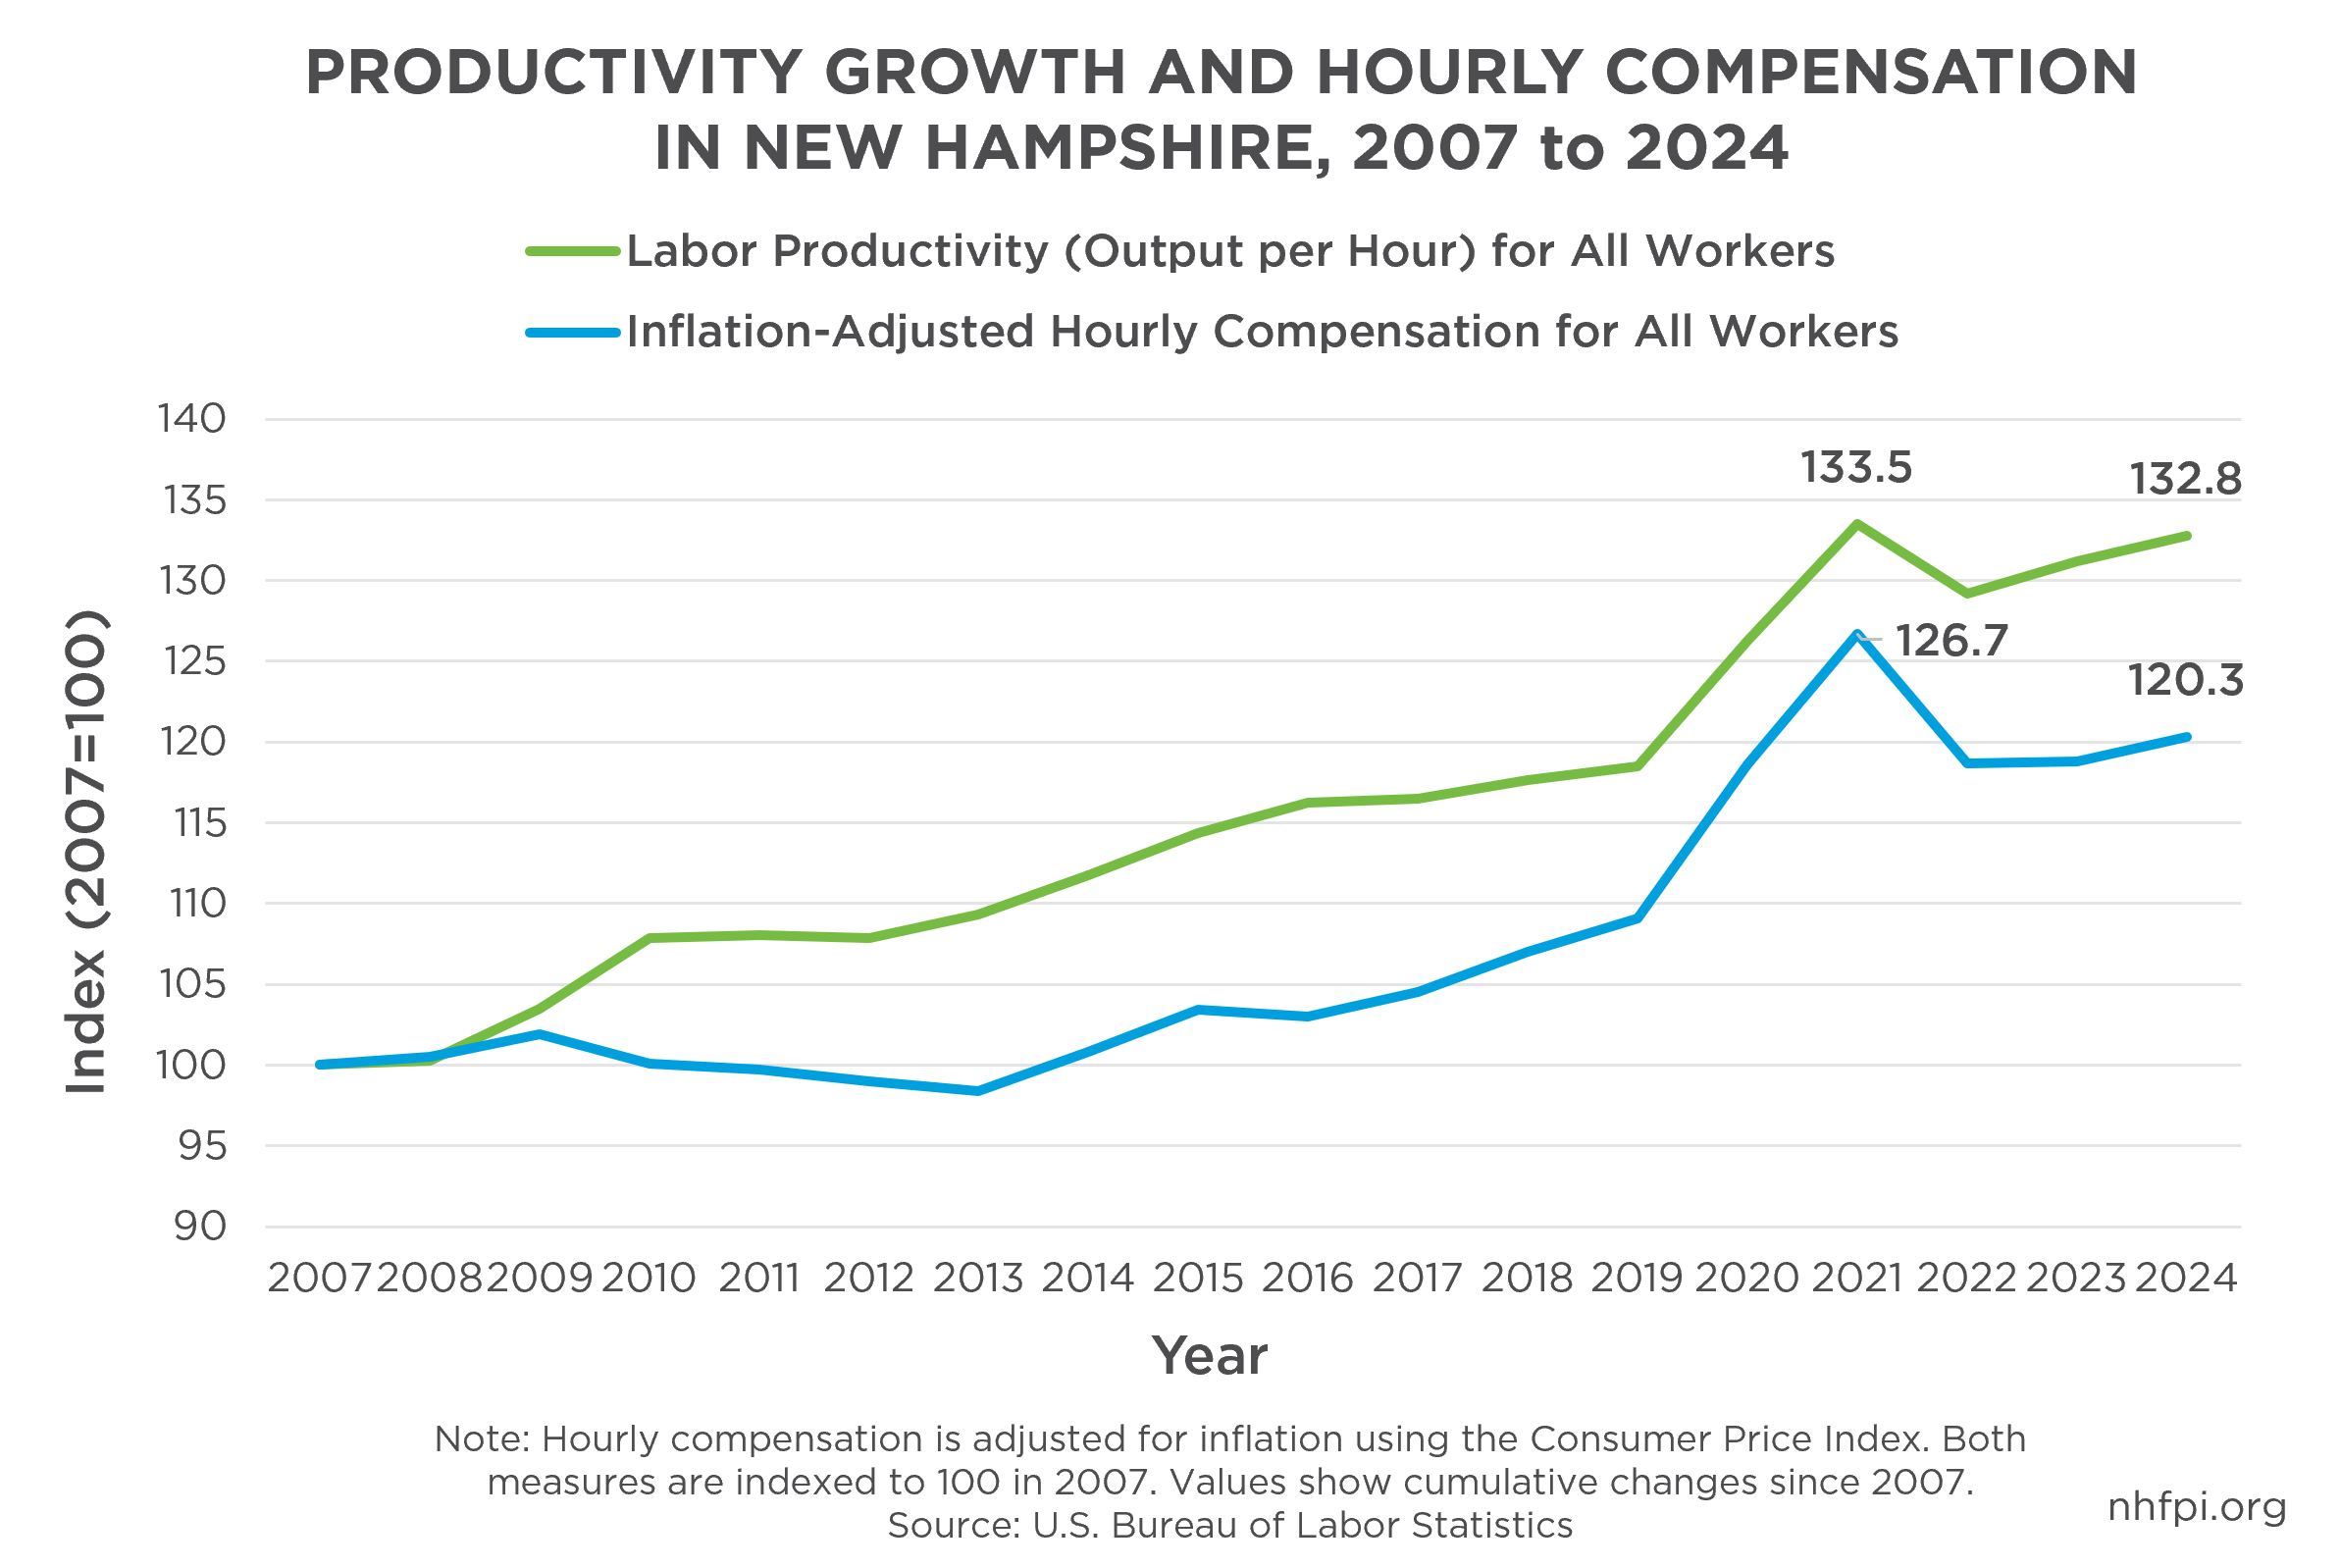
The gap between productivity and compensation emerged after 2009. From 2009 through 2013, productivity increased while inflation-adjusted compensation declined. Both measures rose in 2020 and 2021. Compensation grew faster than productivity in 2021 and 2022. By 2024, however, the productivity index remained above the compensation index.
A constrained labor market in 2021 and 2022 may have helped wage growth outpace productivity. Employers competed for workers, which placed upward pressure on wages. As the labor market became less constrained in 2023 and 2024, productivity grew faster than compensation.[28]
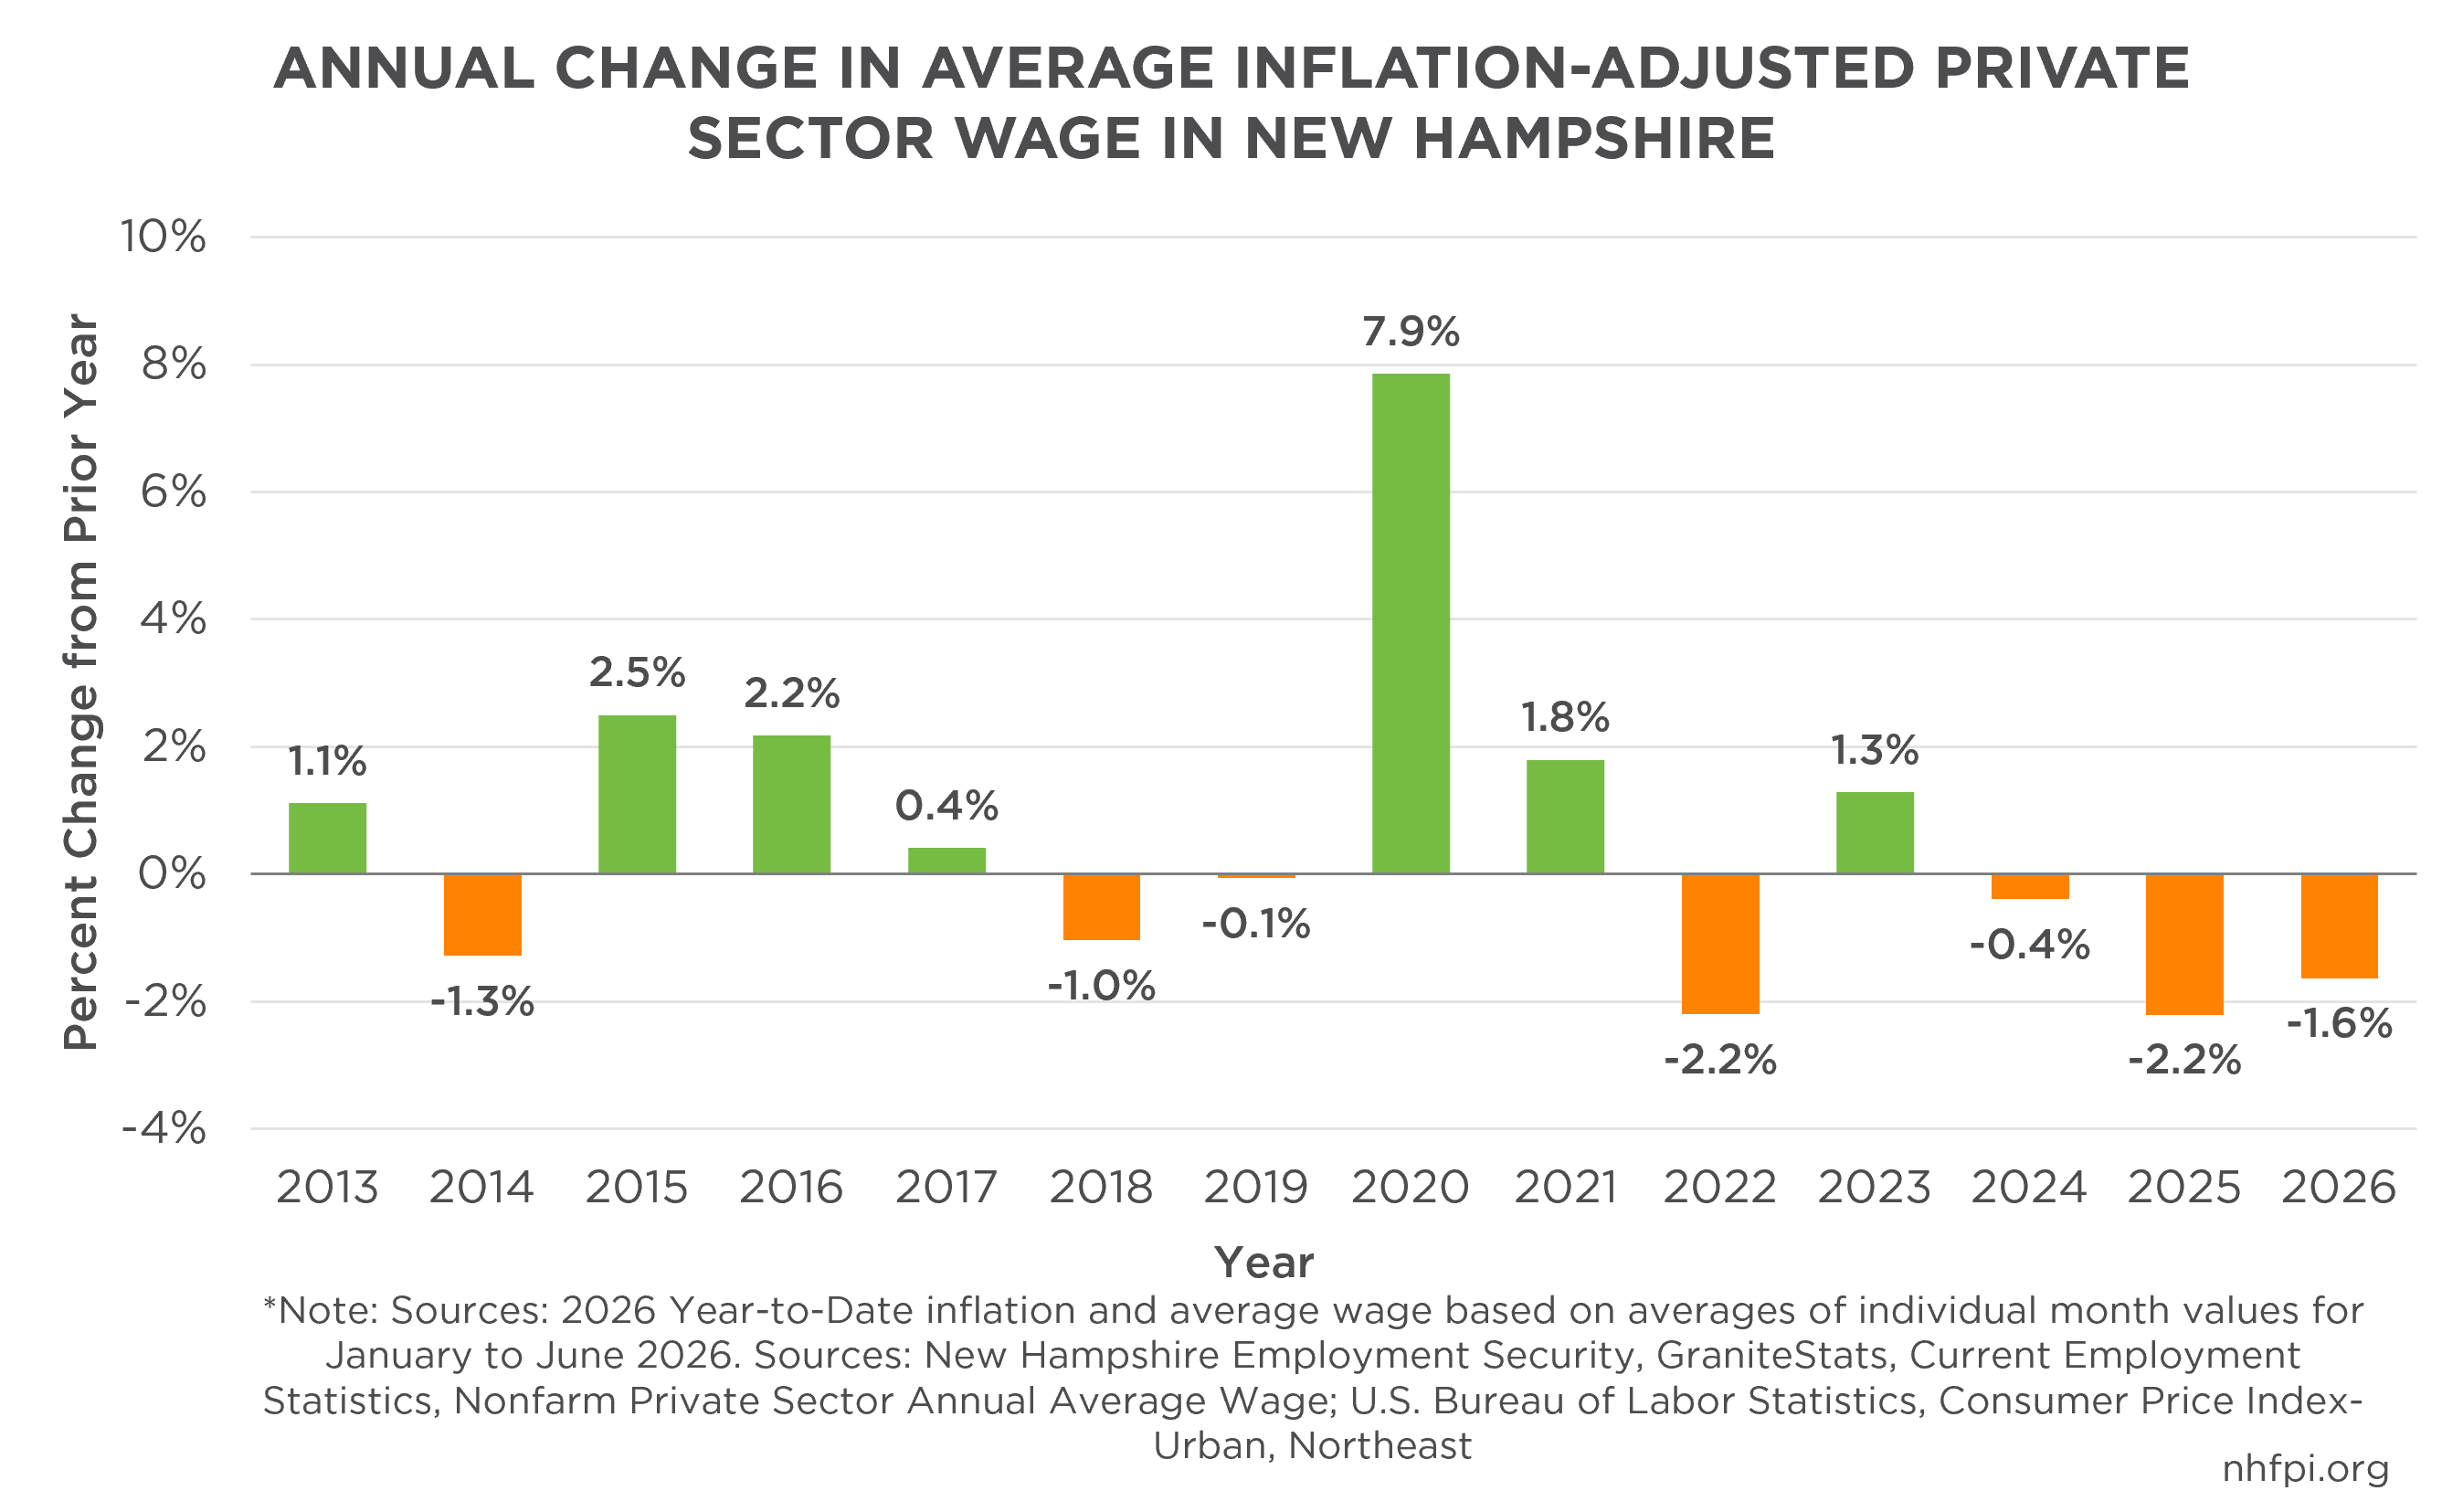
Average private-sector wage data do not represent all workers, and may reflect changes for high-income workers disproportionately relative to changes for workers with lower incomes. However, the monthly availability of these data permits timely comparisons with inflation. The average private-sector wage in New Hampshire grew more slowly than consumer prices in the Northeast during 2024 and 2025. During the first seven months of 2026, wage growth again fell behind inflation. This reduced estimated purchasing power by 1.6% relative to 2025.[29]
Despite recent weakness in average wage growth, New Hampshire had a relatively high per capita personal income. Total income from all sources divided by the number of people in the state was $88,190 during the first quarter of 2026, 13.3% above the national average of $77,816. New Hampshire ranked third among the six New England states. Only Connecticut, at $101,065, and Massachusetts, at $98,721, had higher amounts. Personal income includes earnings, business income, investment and retirement income, and government transfers. Per capita personal income divides total personal income by the State’s population. The high amount suggests a strong income base and relatively high earning capacity. It may also indicate greater consumer purchasing power and demand. However, per capita personal income does not measure cost-of-living differences or the distribution of income.[30]
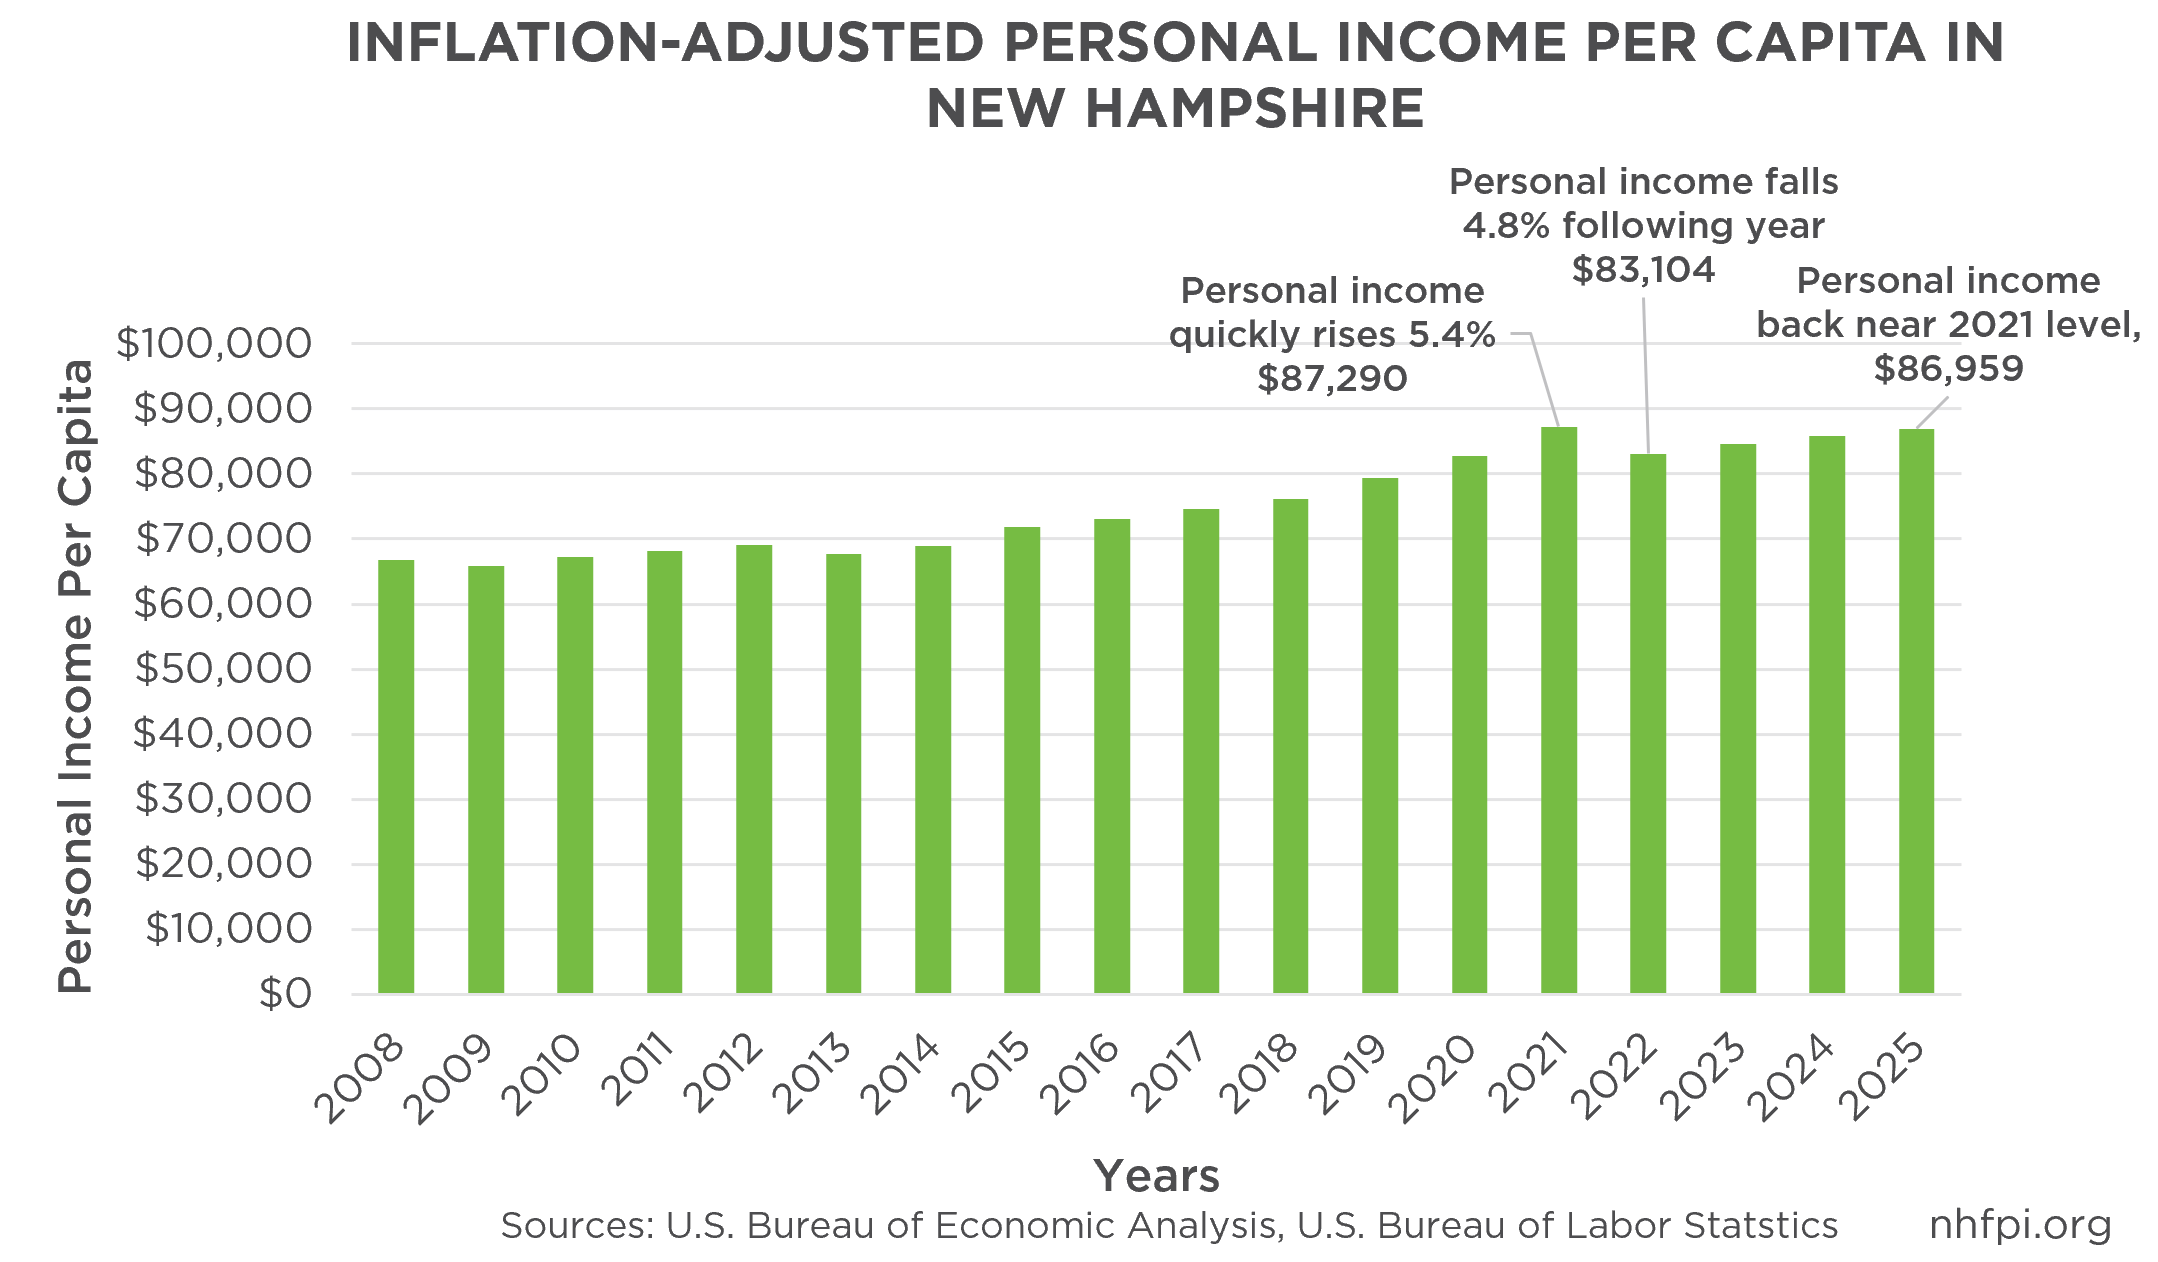
The growth of inflation-adjusted per capita income in New Hampshire has increased at an average annual rate of 4.7% between 2019 and 2021. This growth was in part because of federal income stimulus support during the COVID-19 pandemic.[31] Per capita income then fell 4.8% between 2021 and 2022. This decline may be partially due to the end of federal stimulus checks and the effects of high inflation. Income resumed growing again after 2022, but at a slower average annual rate of 1.5%.
Economic and Job Changes in Neighboring States
Data from neighboring states show that New Hampshire, Maine, Massachusetts and Vermont had fewer jobs in the 12 months ending June 2026 than in the prior 12-month period. New Hampshire had the largest decline among the four states (0.59%, representing a decrease of about 4,133 jobs) based on survey data collected from employers operating in the state. Conditions improved during the first half of 2026. Between the second half of 2025 and the first half of 2026, employment in New Hampshire increased 0.03%, or about 233 jobs. This increase was larger than Vermont’s 0.01% growth but smaller than the increases in Maine, at 0.15%, and Massachusetts with 0.25%. Massachusetts added about 9,117 jobs during the same period.[32]
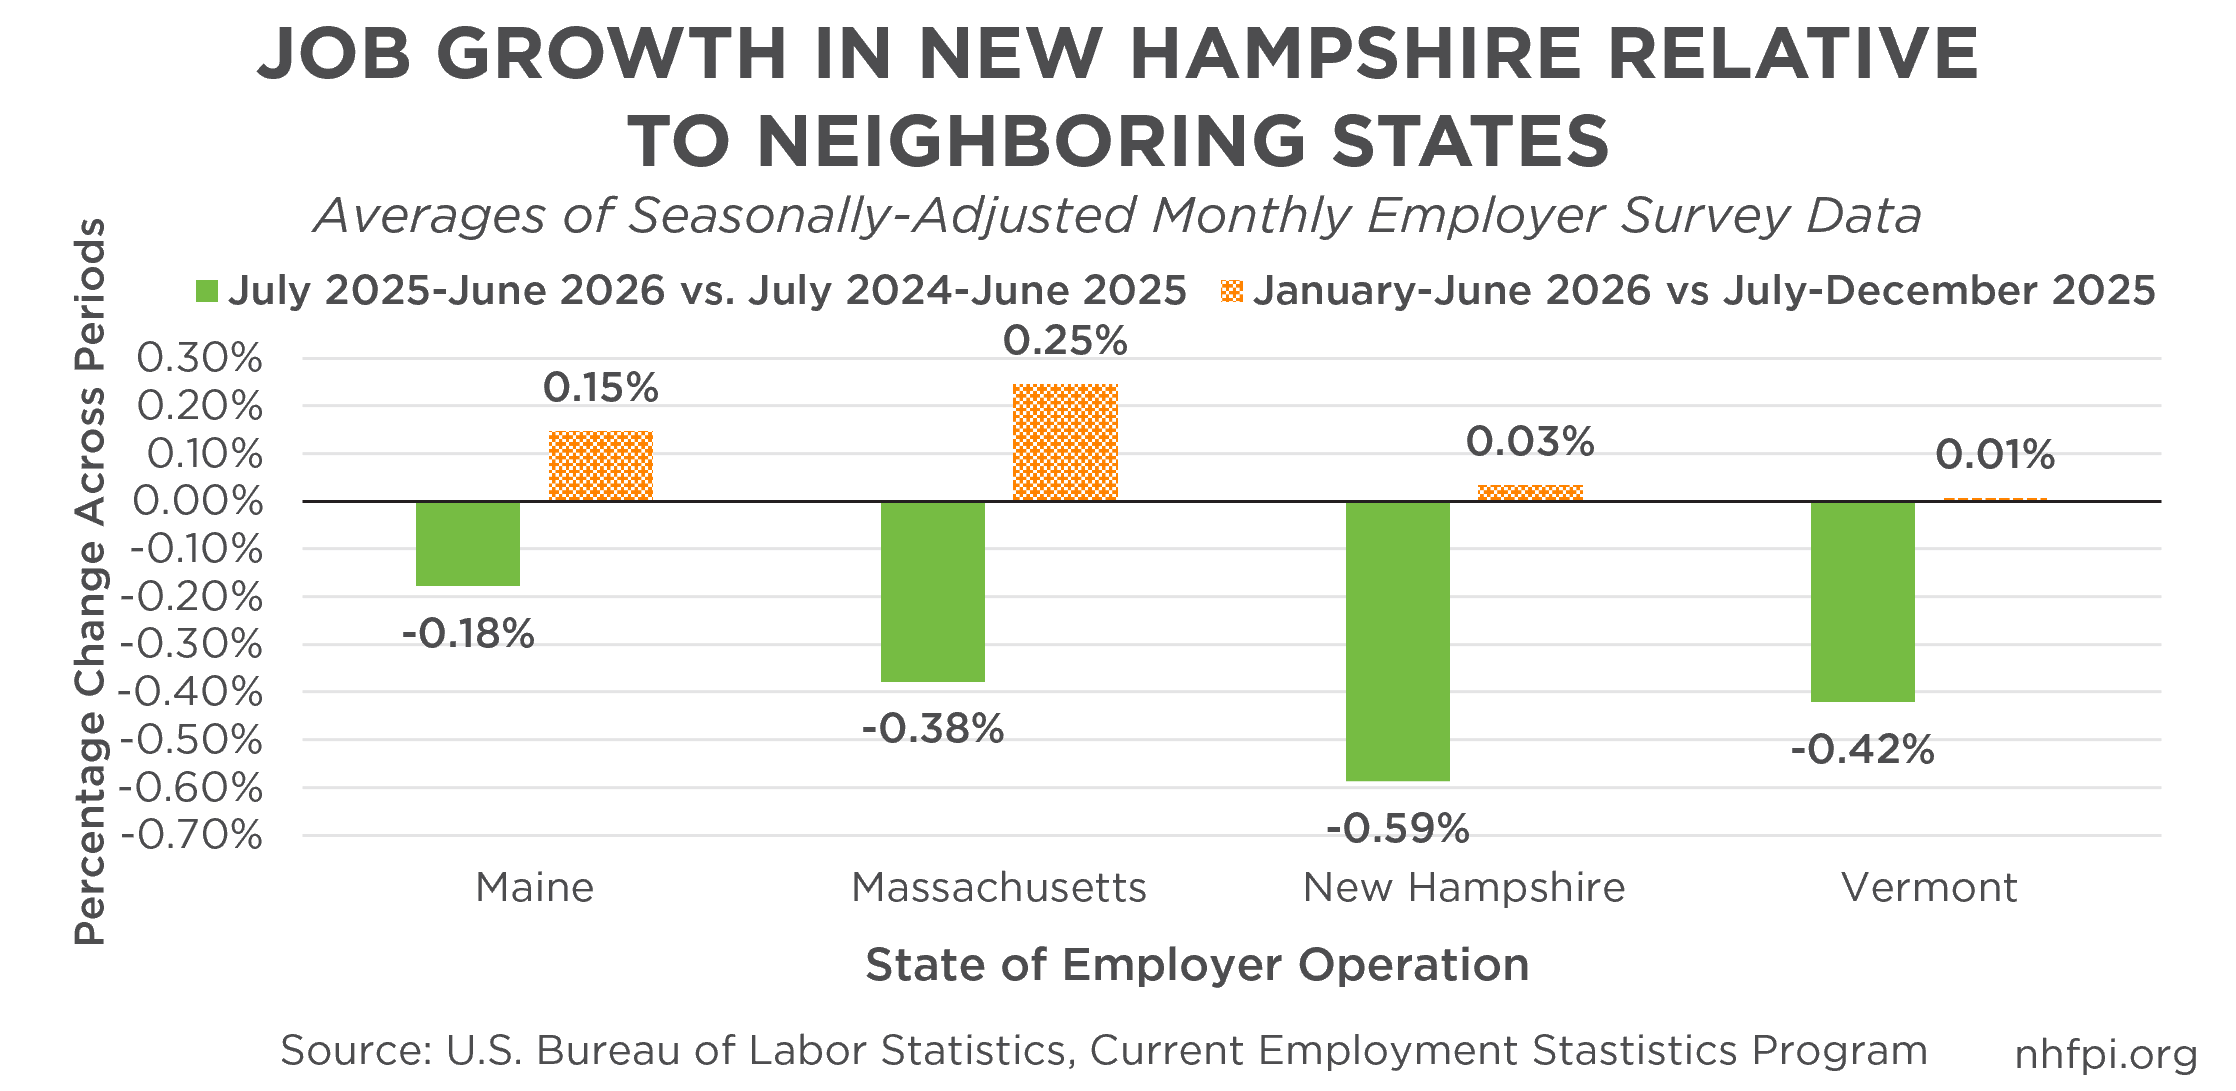
These data suggest that New Hampshire and its neighboring states’ employment moved from an overall decline in the longer 12-month comparison to nearly flat growth in early 2026. However, the first half of 2026 estimates remain preliminary and have not yet been benchmarked.
Artificial Intelligence in New Hampshire’s Economy
Small companies drove much of New Hampshire’s net job growth in 2025, while available information suggests national AI adoption was concentrated among larger companies. This contrast may limit how quickly formal AI adoption affects the State’s labor market. Recent research also suggests that AI’s overall employment effects may be smaller than earlier predictions.[33]
Data from the U.S. Census Bureau’s Business Trends and Outlook Survey showed that about 17% of businesses nationally used AI on a regular basis. About 20% expected to use it within the next six months. Among companies with 250 or more employees, about 37% used AI regularly for business operations. The share was 32% among companies with 100 to 249 employees. Smaller companies reported lower AI use. Among businesses not planning to use AI, 61.6% said it did not apply to their operations. About 22% said they did not know enough about AI, while about 7% cited cost.[34]
AI use among individual workers was more common than formal business adoption. About 50.5% of U.S. workers reported that they had used AI for work activities, according to the U.S. Census Bureau’s March 2026 Household Trends and Outlook Pulse Survey. The most common uses were searching for information or technical help, writing communications or instructions, documenting work, and generating ideas. Workers with more education reported higher AI use than workers with less education. These data suggest that workers use AI most often as a productivity tool in jobs that require information processing, writing, or analysis.[35]
Available research suggests that AI can complement workers in some occupations and automate tasks in others. Early-career workers may face the largest initial effects. The unemployment rate for recent college graduates reached 5.6% in early 2026, 1.6 percentage points above its 2023 level. This increase does not, by itself, show that AI caused the change. However, the Stanford Institute for Economic Policy Research highlighted studies that found declining employment among early-career workers in AI-exposed occupations. Employment among older workers in the same occupations remained relatively stable after the release of ChatGPT in 2022.[36]
An analysis by New Hampshire Employment Security identified several New Hampshire occupations that AI could affect most. Receptionists, office clerks, secretaries, administrative assistants, and payroll and timekeeping clerks were already projected to lose employment between 2022 and 2032. AI could accelerate these projected declines.[37] Available data do not show that AI has had a large effect on New Hampshire’s labor market at this time. Early effects may appear through fewer job openings and lower entry-level hiring. One key effect to monitor is whether AI reduces job positions through which young workers traditionally enter career fields and gain experience.
New Hampshire’s Economy in Context
U.S. Gross Domestic Product (GDP) grew at an average annualized rate of 2.2% across the four quarters from July 2025 through June 2026. This growth rate was about the same as the average growth rate during the prior four quarters. In the second quarter of 2026, U.S. GDP grew at a rate of 1.6%, based on the preliminary figures available. Consumer spending, investment, and exports contributed to growth, while lower government spending and imports reduced it.[38] Changes in imports continued to affect national GDP, likely because U.S. companies changed purchasing decisions and plans in response to potential and actual tariffs.
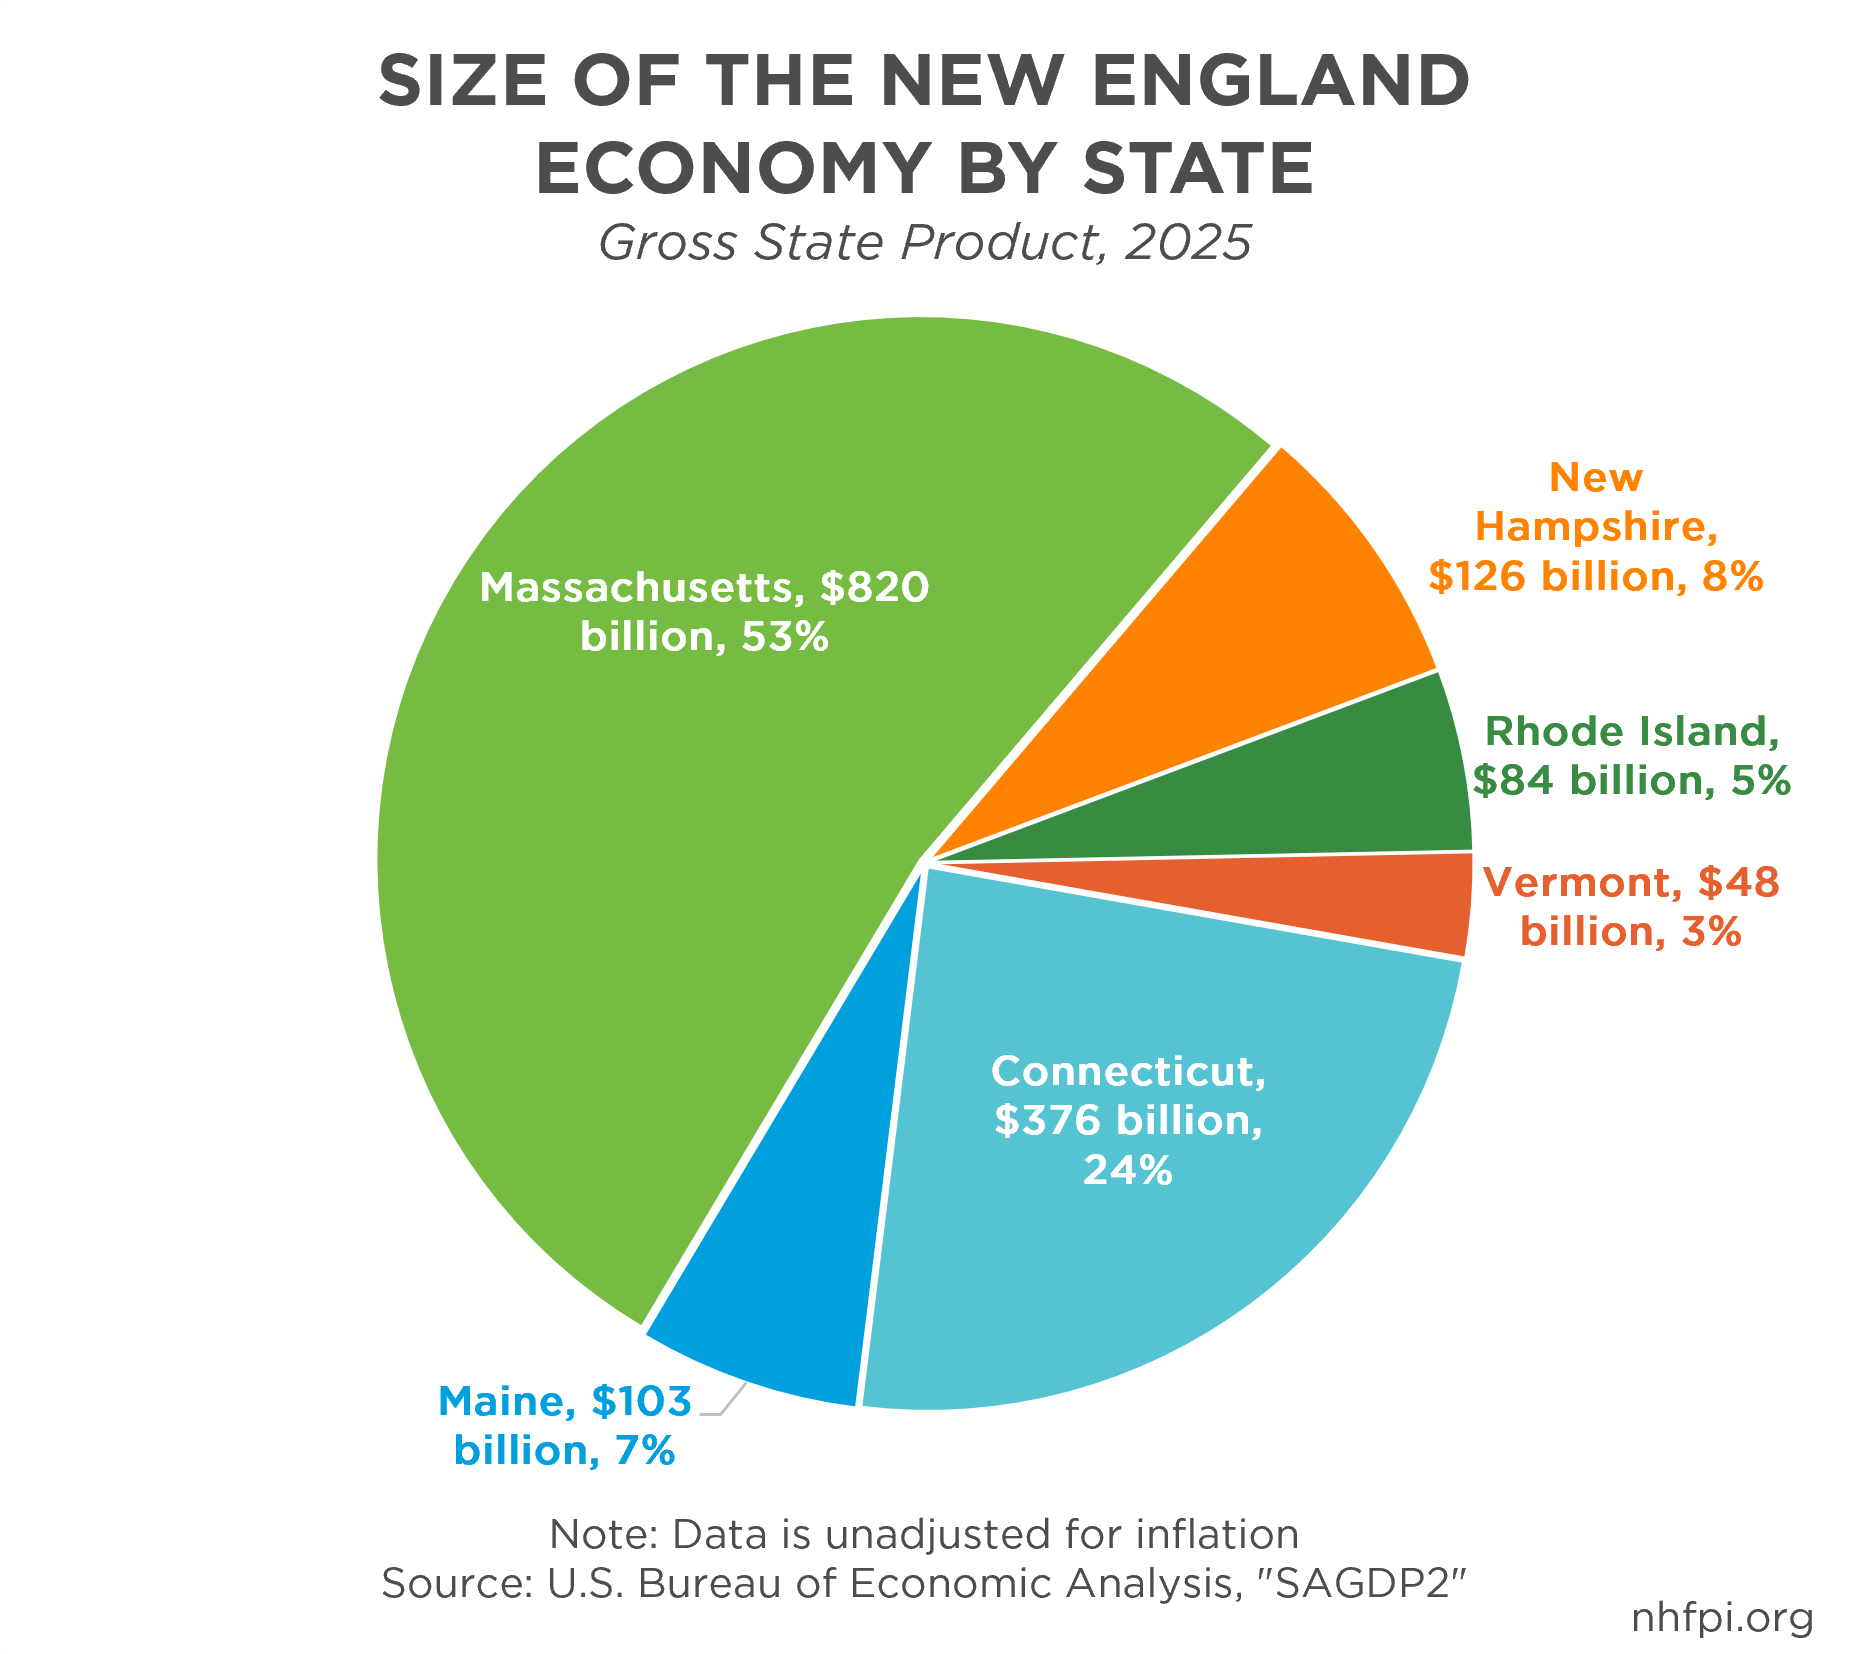
New Hampshire’s economy is small relative to the regional and national economies. As a result, economic changes elsewhere can have large effects on the state’s economy. New Hampshire produced an estimated $126 billion in goods and services in 2025 as measured by Gross State Product. This amount was equivalent to about 0.41% of the $30.76 trillion GDP of the U.S. economy and 8.1% of total output across the six New England states. New Hampshire had the third-largest economy in New England, behind Massachusetts and Connecticut. Massachusetts’ economy was 6.5 times larger, while Connecticut’s was about three times larger.[39] The success of New Hampshire’s economy depends greatly on the decisions and financial well-being of people both within and beyond the state’s borders.
A longer view of overall economic growth indicates that New Hampshire has higher Gross State Product growth rates relative to some neighboring states, but not all of them. Between 2019 and 2025, U.S. Gross Domestic Product increased by 15.1% after adjusting for inflation. Inflation-adjusted Gross State Product grew 14.7% in New Hampshire during this period, outpacing neighboring Massachusetts (13.7%) and Vermont (10.7%). Maine’s economic growth during this period, at 17.1%, was the fastest in New England.[40]
Trade, Tariffs, and National Headwinds
Tariffs are taxes on U.S. businesses based on the goods they import, and businesses may pass these costs to consumers. Consumer cost increases are likely to have larger effects on lower-income households, given their budget constraints to absorb higher prices. The federal government’s average effective tariff rate has varied substantially since April 2025, and the Budget Lab at Yale University estimated the average statutory tariff rate was about 11% as of August 11, 2026. The Budget Lab expects the average rate to reach 11.8% by year-end and estimates that current tariffs will cost households about $1,000 on average in 2026. The Urban Institute’s Tax Policy Center estimates that the average federal tax rate will rise by 0.8 percentage points for households in the bottom income quintile during 2026 because of the tariffs, and the top quintile will see a 0.6 percentage point increase.[41]
Changes in federal trade policy can affect New Hampshire’s trade. Canada remained one of the State’s largest export markets in 2025, with New Hampshire exporting $859.2 million in goods to Canada that year. However, export values fell 18.65% between 2023 and 2024 and 26.8% between 2024 and 2025. Exports to Canada improved in early 2026, with export values increasing 25.9% between January and June 2026 compared to the same period in 2025. Because Canada is a major export market, changes in Canadian demand or changes to national trade policy can affect New Hampshire exporters.
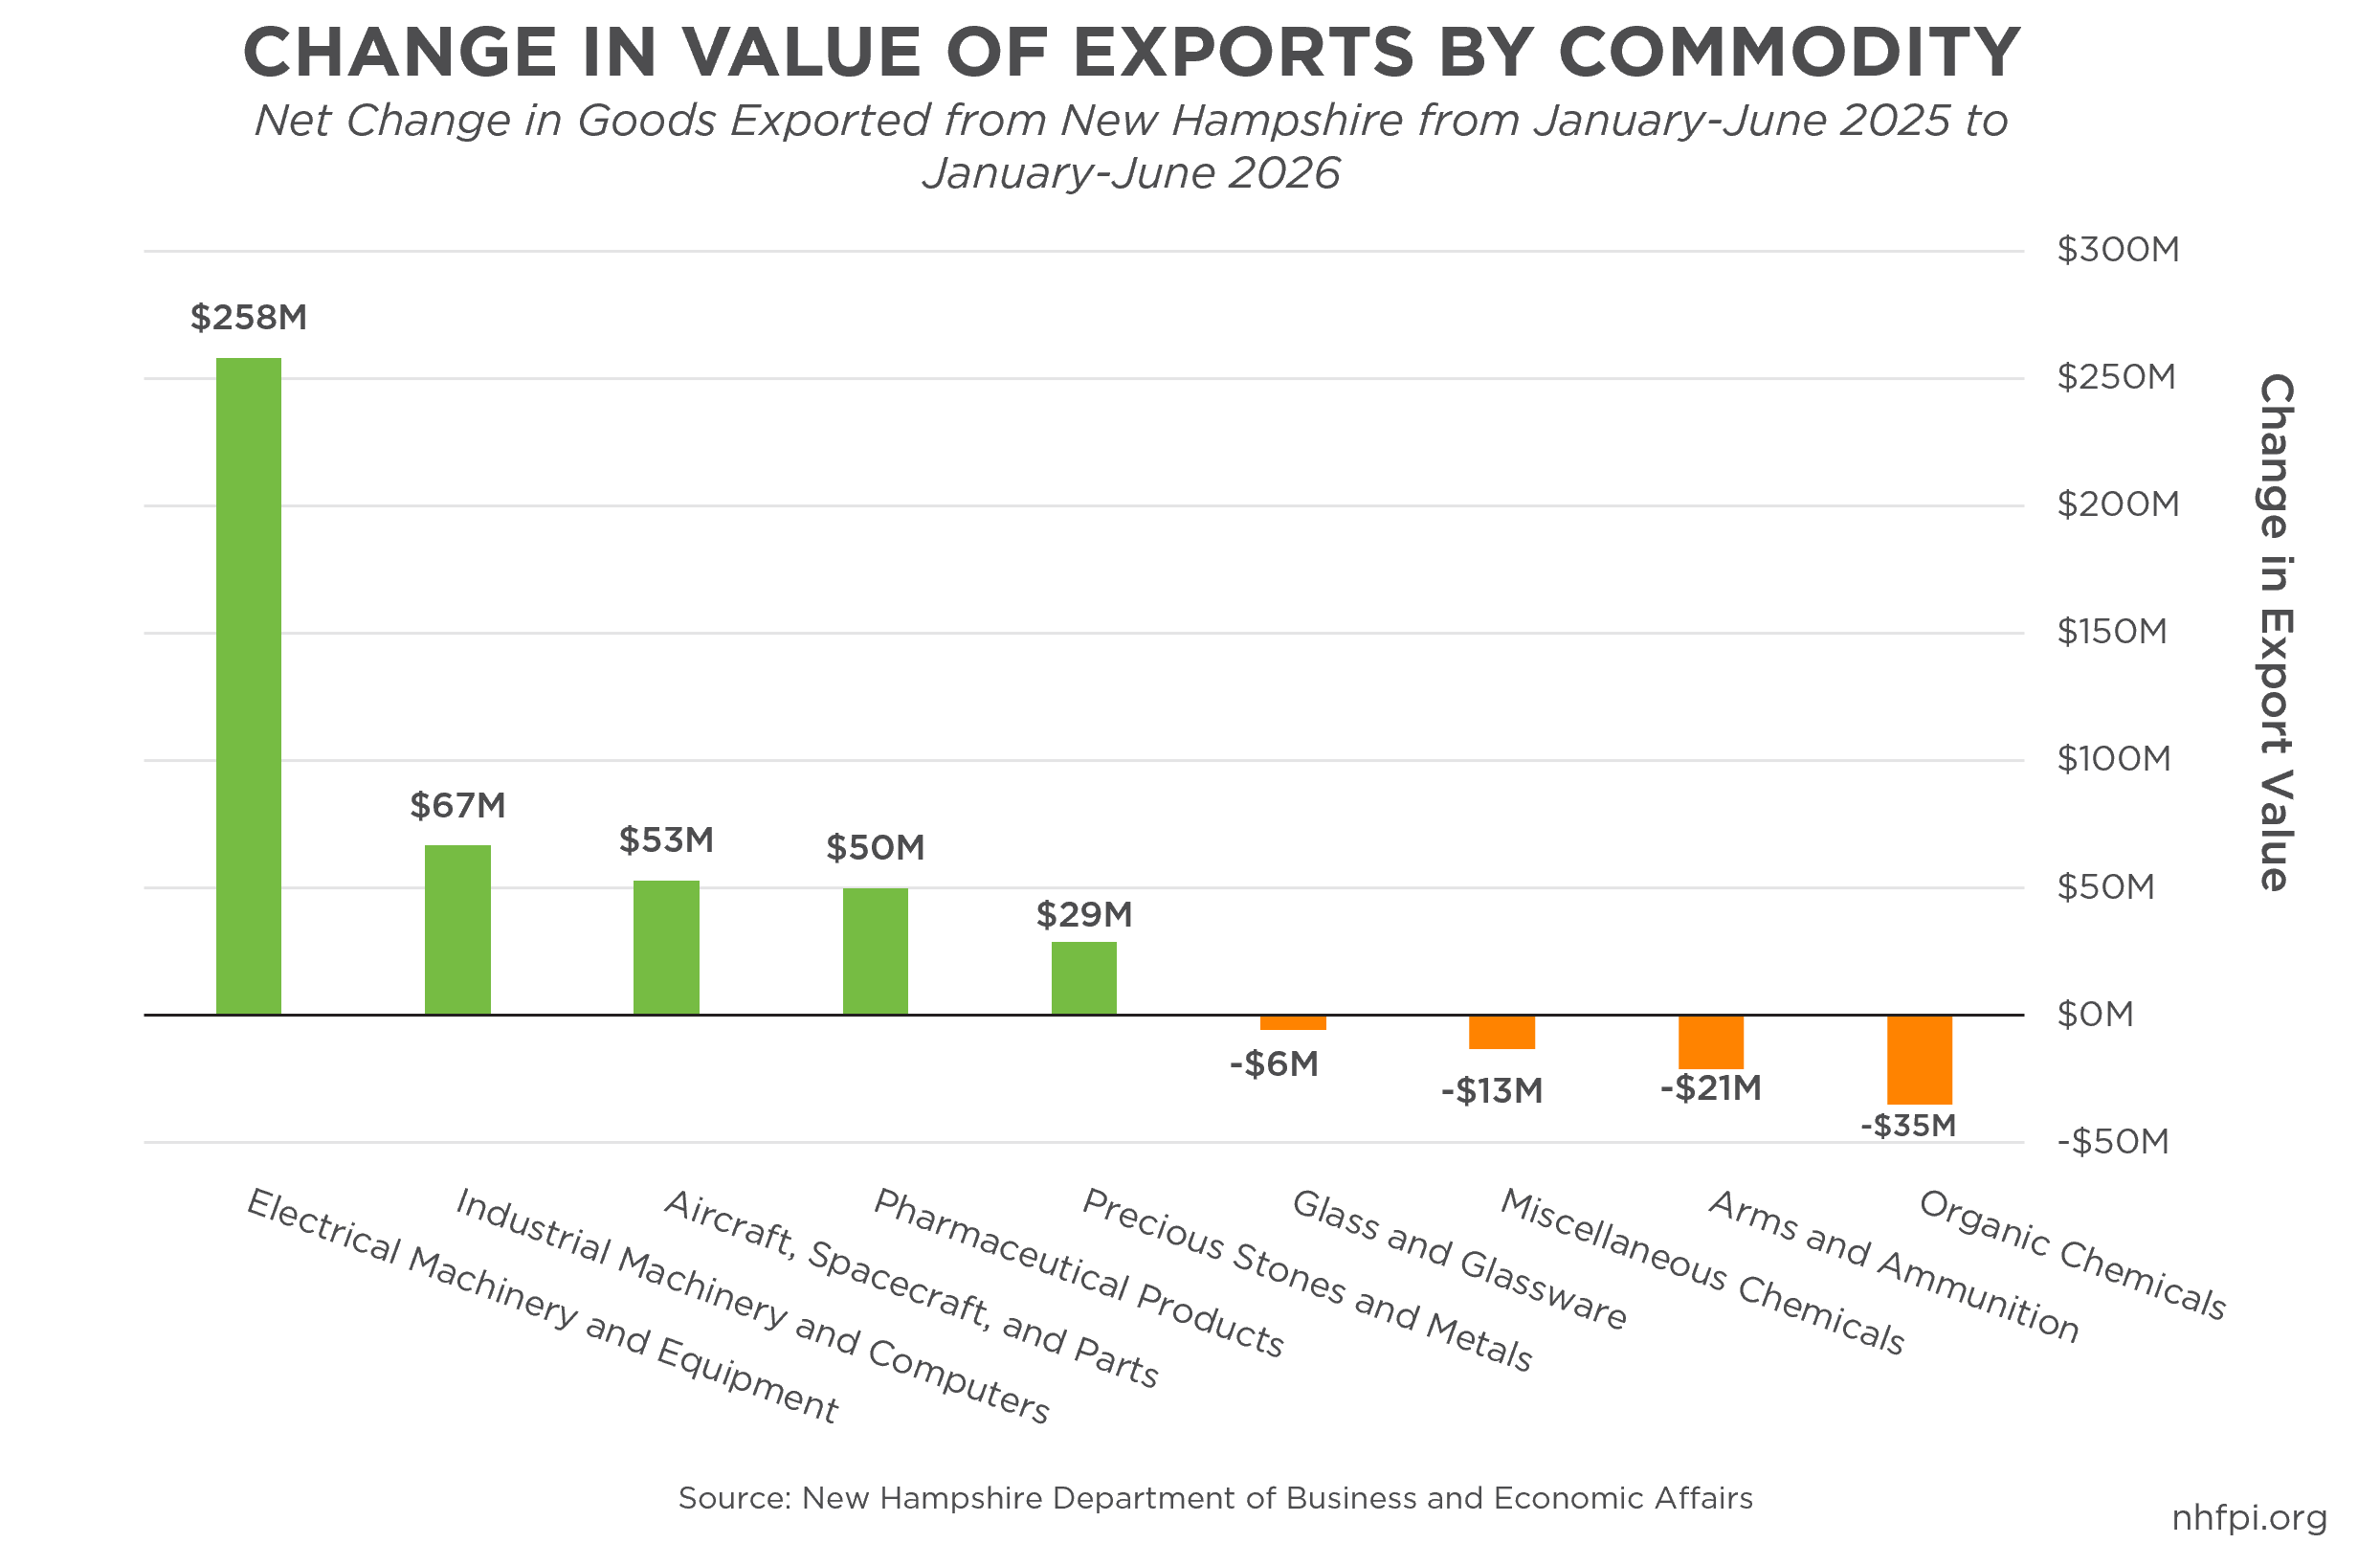
New Hampshire exports are driven by a small cluster of commodities so far in 2026. Data from the New Hampshire Department of Business Affairs show that the total value of New Hampshire’s exports is rising; exports in the first half of 2026 have increased by 11.8% compared to the same period in 2025. Electrical machinery and equipment drove most of New Hampshire’s export growth during the first half of 2026; its export value increased $258.0 million from the same period in 2025. This increase supplied 62.5% of the State’s total export growth. Industrial machinery exports increased $66.5 million, while aircraft exports increased $52.9 million. Pharmaceutical exports also increased by $49.9 million. These gains offset declines in organic chemicals, arms and ammunition, and other chemical products.
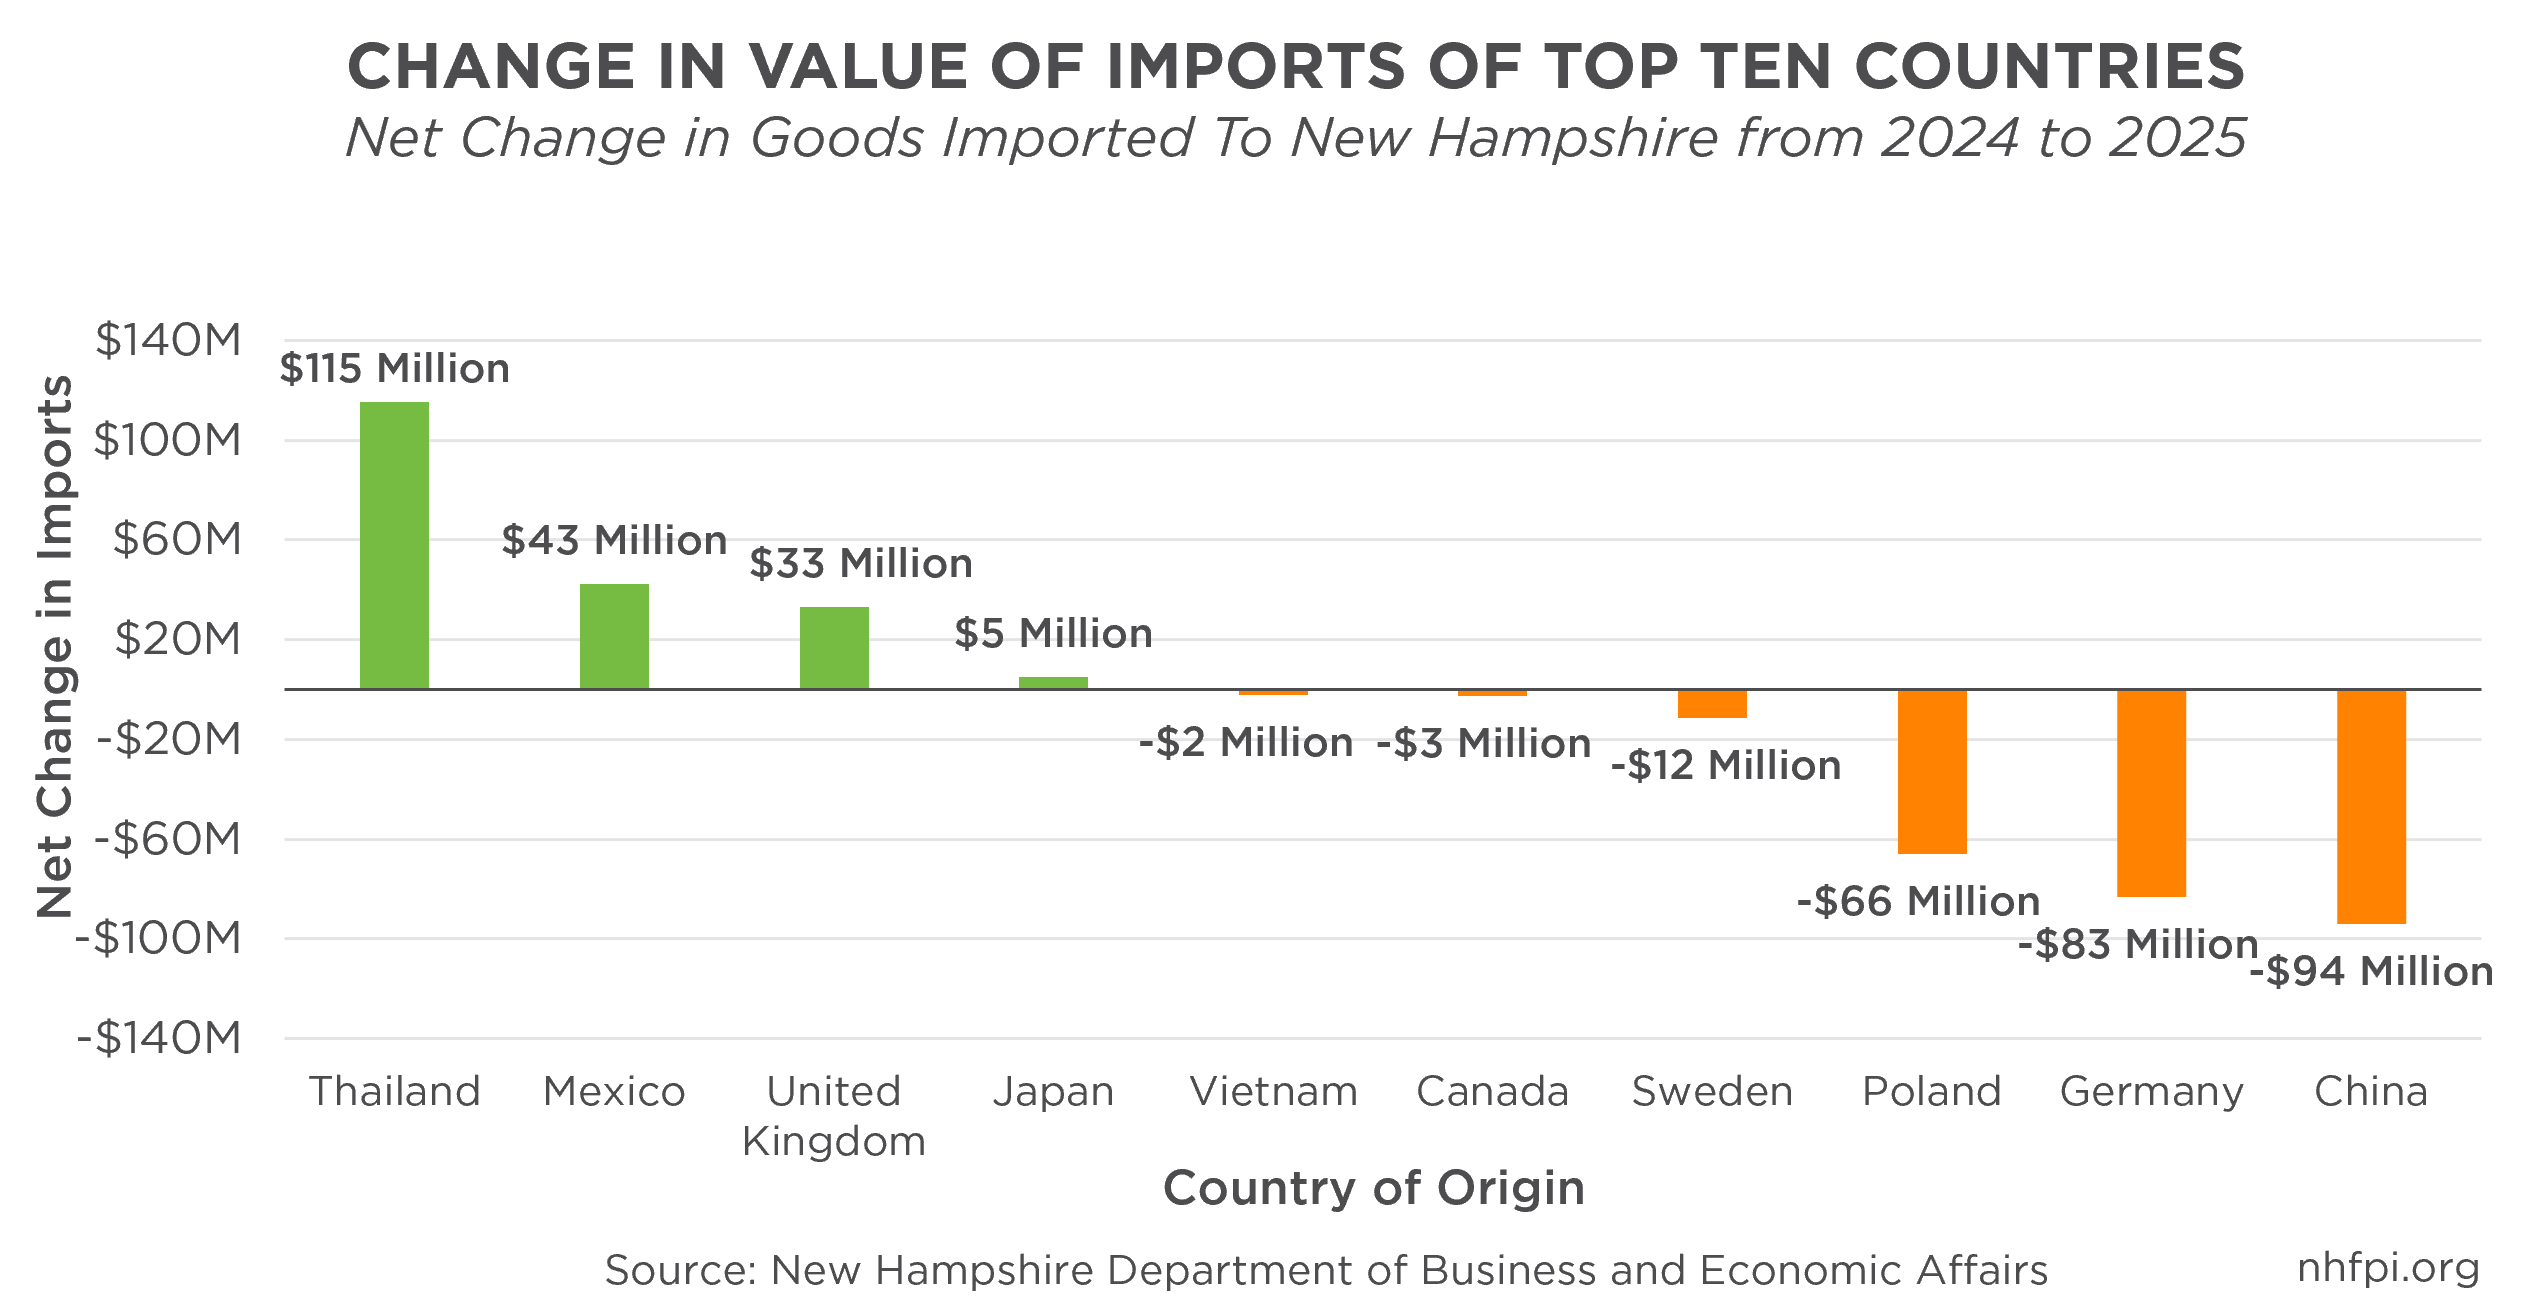
New Hampshire businesses imported about $10.12 billion in goods during 2025. This was 0.8% less than the $10.2 billion imported during 2024. In the first half of 2026, imports were 6.3% higher than the same period in 2025. The countries of origin with the largest sources of imported goods in 2025 were Canada ($1.95 billion), Japan ($1.03 billion), Poland ($921 million), Germany ($794 million), and Thailand ($303 million).
Among the top ten countries with the most goods imported, imports from Thailand increased 61% ($155 million of goods) between 2024 and 2025, while imports from China had the largest percentage decline of 18% ($94 million of goods). The top commodities imported were industrial machinery ($4.36 billion), electrical machinery ($1.03 billion), and mineral fuel such as oil or mineral wax ($576 million).[42]
Jobs and Wages Nationally
During the first half of 2026, the national economy appeared to be moving toward slower employment growth while inflation remained elevated. The labor market had lower job growth relative to the relatively rapid post-pandemic recovery. Preliminary data show that employers added about 20,000 jobs per month, on average, during May, June, and July 2026. Employers added almost 69,000 jobs per month during February, March, and April. The May-July 2026 average was slightly above the 19,000 jobs added per month during the same period in 2025. The national unemployment rate remained virtually unchanged from 4.2% in June to 4.1% in July. This reflected a smaller labor force, not employment growth. The labor force was about 1.3 million larger in July 2025 than in July 2026. The labor force participation rate fell to 61.4%, which was the lowest level since February 2021. The national labor force participation rate has been slowly dropping in 2026, down 1.8% from January to July.[43] Slower job growth may reflect a combination of businesses hiring fewer workers because of economic uncertainty, fewer available workers because of reduced immigration, or other factors.[44]
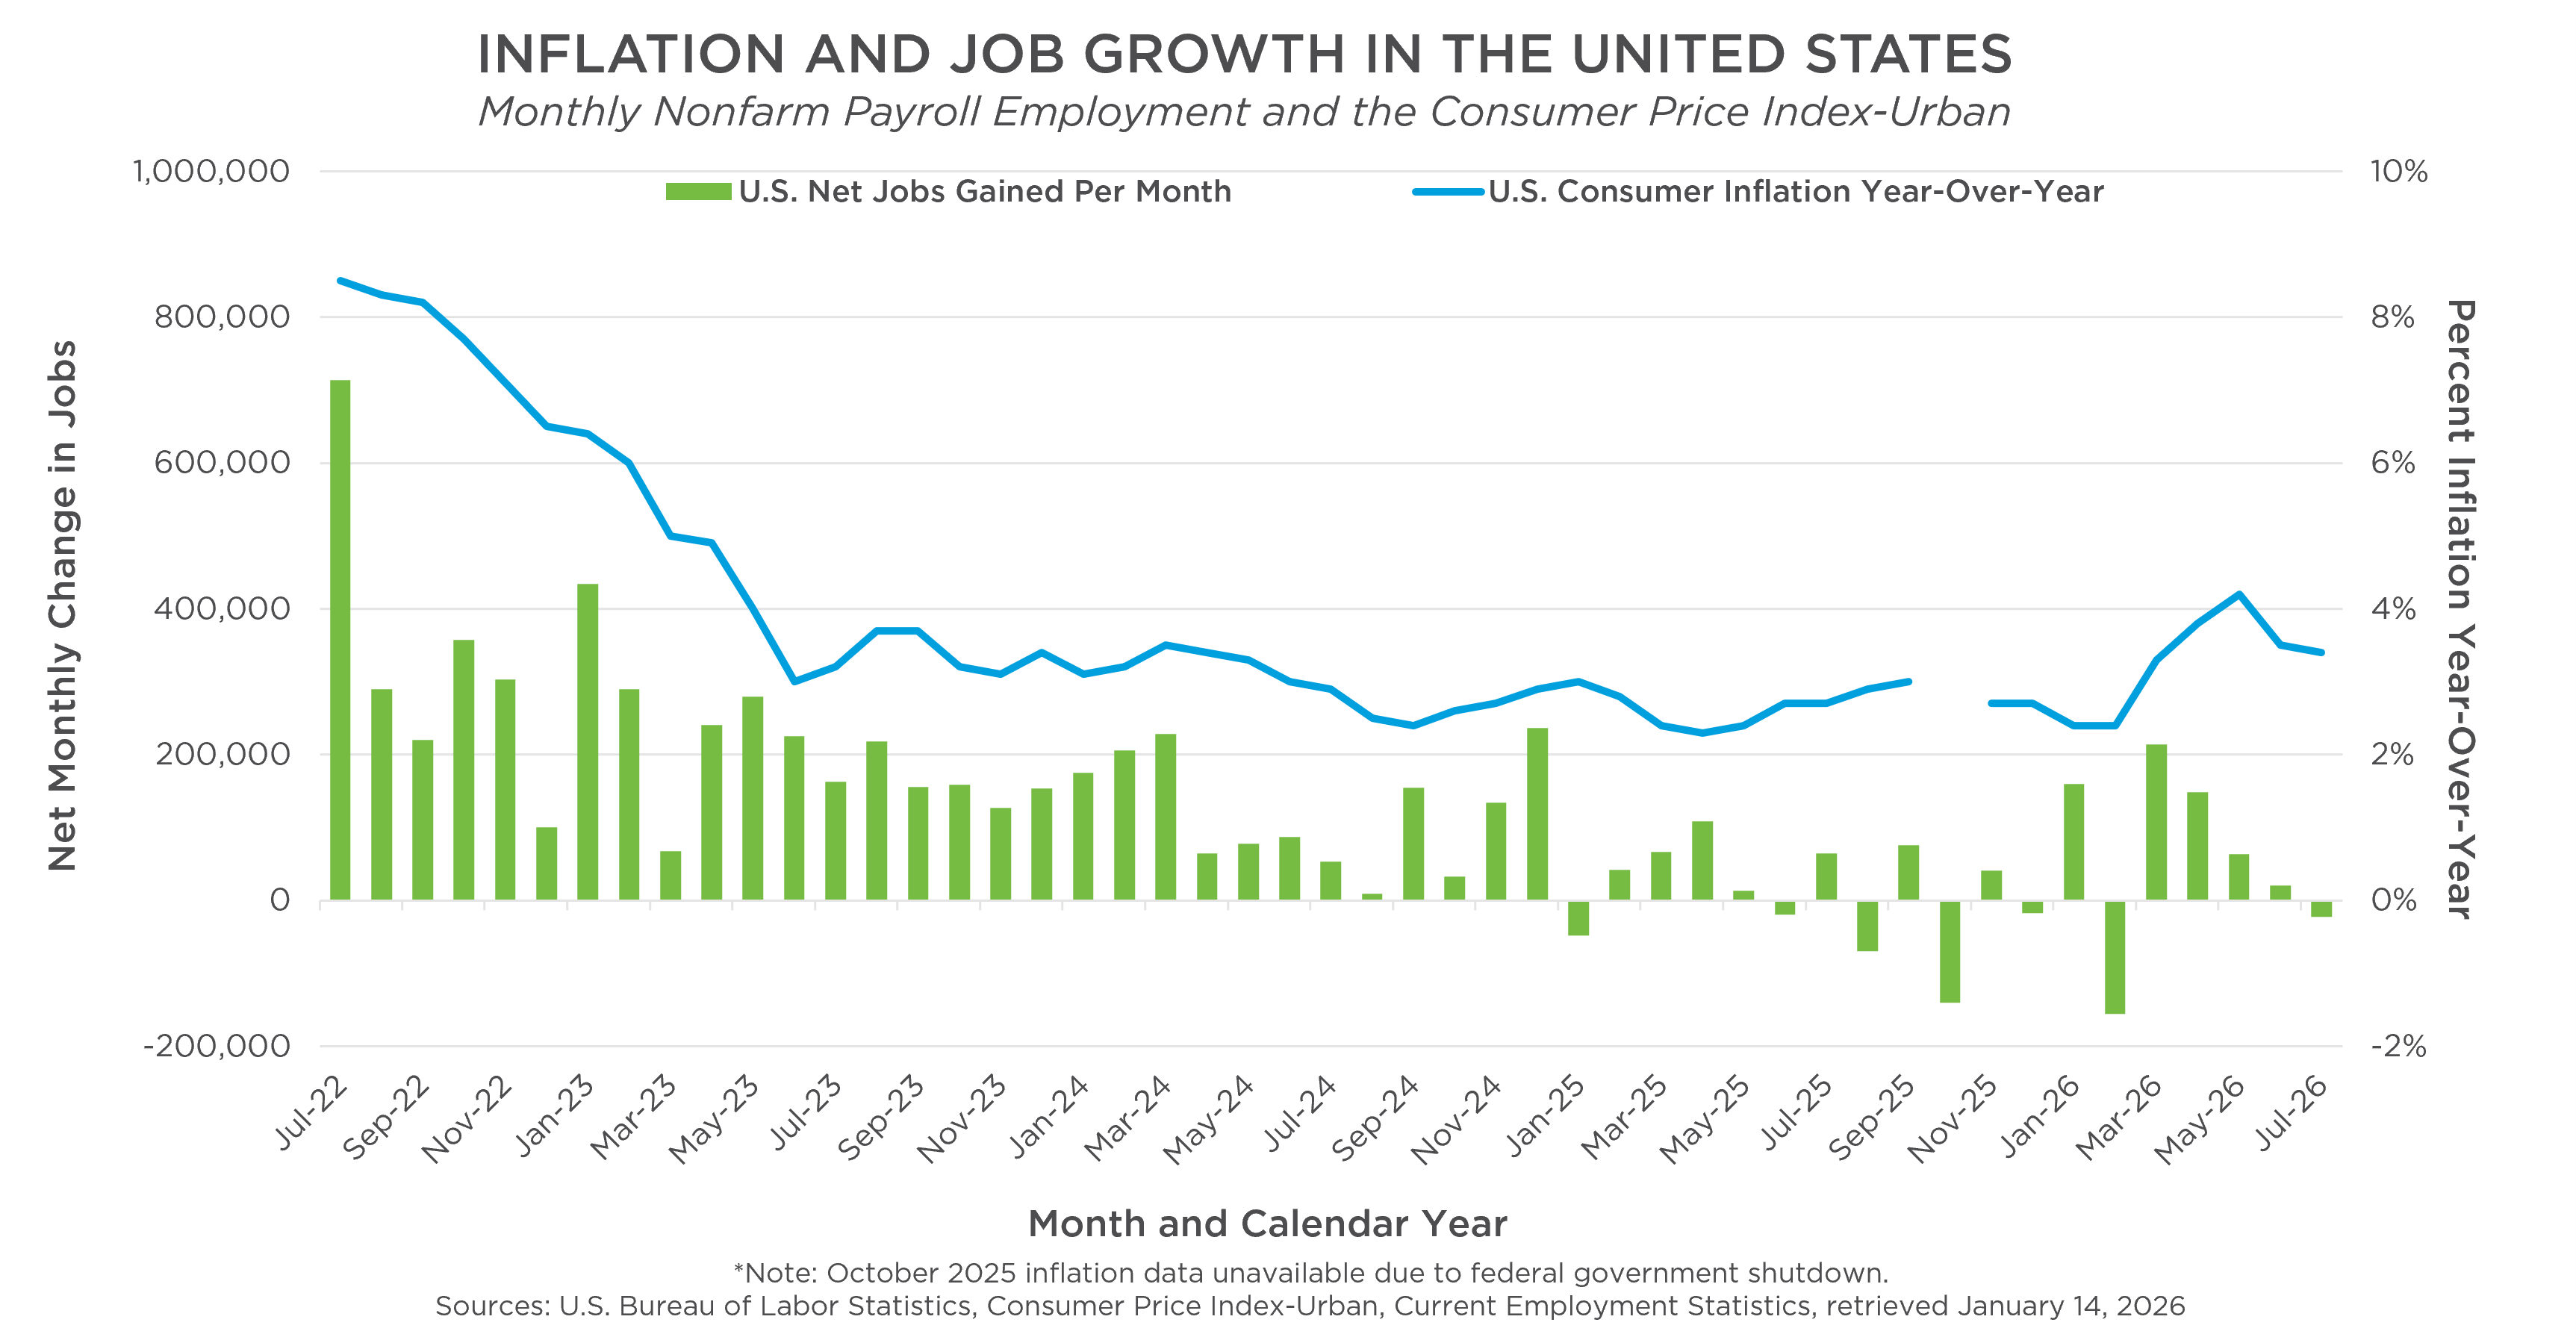
Workers also faced lower purchasing power. Average hourly earnings increased 3.2% between July 2025 and July 2026, while the Consumer Price Index increased 3.4% in June. The national personal saving rate fell to 2.7% in June, which suggests that households were supporting spending by saving less. If weak job growth persists or worsens while inflation remains elevated, demographic and cost-of-living challenges could weaken national economic momentum.[45]
Looking Ahead and the Implications of Changes in Economic Data Collection and Reliability
New Hampshire’s economy showed several signs of improvement during the first half of 2026 after a slowdown in the labor market during 2025. The labor force grew, unemployment decreased, and payroll employment grew during the first and second quarters of 2026. New Hampshire’s smaller firms produced a majority of private-sector job gains. Health Care and Social Assistance continued to be the industry with the largest employment, though New Hampshire’s industry employment remains varied.
While much of the labor market has strengthened, other key indicators of economic health lagged behind. Wage growth did not keep up with inflation in 2025, and elevated inflation threatens to diminish the wage gains that occurred after the pandemic. Productivity also grew faster than inflation-adjusted compensation over the longer term. Gains among a small group of high-income workers could be increasing averages without any broad improvement. Further, changes in federal statistical resources and data availability mean that there may be less detailed or less frequent data on economic activity, making it harder to track changes across industries, regions, employers, and the labor force. Recent revisions to preliminary employer data also show why early estimates must be interpreted with caution. Revisions can change the size or direction of previously-identified trends.
Several changes also make recent economic data more difficult to interpret. Some official statistics now arrive months after the periods they measure. For example, in 2026, the U.S. Bureau of Labor Statistics changed its State Job Openings and Labor Turnover Survey release from monthly to annually.[46]
Artificial intelligence makes this delay more important because companies can quickly change their hiring and production processes. More time will be needed for available data to show how AI affects employment, wages, productivity, and early-career opportunities.
Artificial intelligence and other new technologies may allow companies to increase economic output without increasing employment at the same rate. Companies may produce more goods and services with fewer additional workers than in the past. As a result, changes in employment may provide a less complete measure of economic growth and data on output, productivity, wages, and hours worked will become more important. Meanwhile, New Hampshire’s aging population means that as older adults exit the labor force; interstate movement will influence whether enough workers are available for businesses. A slower rate of job growth could reflect weaker demand, lower labor supply, or a combination.
End Notes
[1] See New Hampshire Employment Security, Current Employment Statistics.
[2] Learn more about the benchmarking process on New Hampshire Employment Security’s webpage on Labor Force and Unemployment.
[3] Changes in the number of New Hampshire residents employed retrieved from the Local Area Unemployment Statistics program, which surveys households, and published by New Hampshire Employment Security. See also New Hampshire Employment Security’s July 23, 2026 Unemployment News Release for June 2026.
[4] See NHFPI’s June 2026 blog New Hampshire Employment Bump Last Summer Lowest in a Decade.
[5] See Federal Reserve Bank of Cleveland’s August 4, 2026 economic commentary The “Low-Hire, Low-Fire” Labor Market and the Federal Reserve Bank of St. Louis’s March 5, 2026 blog post The Effects of a “Low-Fire, Low-Hire” Economy on Workers.
[6] For these data rooted in the unemployment compensation claims system, see New Hampshire Employment Security’s Covered Employment and Wages webpage, accessed August 28, 2026.
[7] New Hampshire Employment Security reports initial unemployment claims and continued weeks of benefits claimed. See New Hampshire Employment Security Unemployment Insurance Claims Data.
[8] For consumer confidence, see Federal Reserve Bank of Boston’s July 17, 2026 New England Economic Conditions; for business confidence see Citizens Financial Q3 Business Pulse, 2026.
[9] See U.S. Bureau of Labor Statistics Business Employment Dynamics Data By States, New Hampshire Tables 1 and Table 3 and U.S. Census Bureau Quarterly Workforce Indicators, Net Change in Jobs by Firm Size.
[10] The data discussed in this section comparing industries are from New Hampshire Employment Security’s reporting of the Quarterly Census of Employment and Wages data. For 2025, averages of four individually-reported quarters are used to represent the whole year. See also New Hampshire Employment Security’s July 2025 New Hampshire Economic Conditions report Health Care and Social Assistance: Employment and Occupational Trends in the 21st Century.
[11] See New Hampshire Employment Security’s Covered Employment & Wages (QCEW) data for 2024 and for the four quarters of 2025, which are averaged in this analysis to approximate the full year.
[12] For historical context, see NHFPI’s June 4, 2018 Issue Brief New Hampshire’s Economy: Strengths and Constraints.
[13] See U.S. Bureau of Labor Statistics’ Concepts and Definition entry Civilian labor force, or labor force.
[14] Labor force data retrieved from the U.S. Bureau of Labor Statistics Local Area Unemployment Statistics, accessed August 21, 2026.
[15] Labor force participation rate data by age are from unpublished U.S. Census Bureau Current Population Survey data provided by New Hampshire Employment Security.
[16] See the U.S. Bureau of Labor Statistics’ webpages Local Area Unemployment Statistics and Alternative Measures of Labor Underutilization for States.
[17] Data reflects individuals age 16 to 64 years and can be accessed in the U.S. Census Bureau’s American Community Survey Table S1703.
[18] The U-6 unemployment rate is a broader measure of labor underutilization. It includes unemployed workers, people marginally attached to the labor force, and people working part time for economic reasons. The measure provides a broader view of underemployment and certain labor market conditions than the standard unemployment rate. See U.S. Bureau of Labor Statistics’ Glossary of Terms Alternative Measures of Labor Utilization.
[19] See the U.S. Census Bureau’s Population Estimates Program, State Population by Characteristics: 2020-2025, Vintage 2025 Estimates.
[20] See NHFPI’s August 16, 2024 Issue Brief New Hampshire’s Growing Population and Changing Demographics Before and Since the COVID-19 Pandemic.
[21] See NHFPI’s May 27, 2026 Issue Brief, Younger Residents Lead Interstate Movement to New Hampshire While Affordability Challenges Persist.
[22] See NHFPI’s June 12, 2026 column Affordability challenges risk New Hampshire’s ability to attract and keep future generations.
[23] See NHFPI’s March 30, 2026 Issue Brief High Prices and Low Supply Continue to Impact Housing Affordability in New Hampshire.
[24] See NHFPI’s June 2, 2026 blog Annual Price of Child Care for Granite State Children Remains High as Number of Providers Decline.
[25] For data on job openings, see the U.S. Bureau of Labor Statistics’ Job Openings and Labor Turnover Survey.
[26] See U.S. Bureau of Labor Statistics’ Productivity webpage on how productivity is measured; and see the Economic Policy Institute’s Productivity Pay Gap Tracker.
[27] Data for productivity index retrieved from the U.S. Bureau of Labor Statistics’ One-Screen Detailed Industry Productivity (Labor, Total Factor, and State Labor) and One-Screen State and Area Employment, Hours, and Earnings. Both were indexed to 100 in 2007 to compare growth from a common starting point. For more information, see the Federal Reserve Bank of Dallas’ guide, Indexing Data to a Common Starting Point.
[28] To learn more about how New Hampshire’s labor force has changed, see NHFPI’s Issue Briefs Headwinds Hit the New Hampshire Economy, August 2025; New Hampshire’s Growing Population and Changing Demographics Before and Since the COVID-19 Pandemic, August 2024; and Granite State Workers and Employers Face Rising Costs and Significant Economic Constraints, August 2023.
[29] For inflation data, see the U.S. Bureau of Labor Statistics webpage Consumer Price Index Overview Table – Northeast. Average wage data are available from New Hampshire Employment Security’s GraniteStats portal.
[30] For more information on personal income, see the U.S. Bureau of Economic Analysis, What to Know about Income & Saving. For Gross State Product and personal income data, see the U.S. Bureau of Economic Analysis, GDP, Industries, Corporate Profits, State GDP, and State Personal Income, 1st Quarter 2026.
[31] See Brookings Institute’s April 2022 Lessons learned from Economic Impact Payments during COVID-19.
[32] See U.S. Bureau of Labor Statistics State and Metro Area Employment, Hours, & Earnings, accessed August 21, 2026.
[33] See Stanford Institute for Economic Policy Research’s July 2026 policy brief What is really happening to jobs? Separating AI hype from reality.
[34] The U.S. Census Bureau’s Business Trends and Outlook Survey (BTOS) provides timely data on economic measures and business expectations. Data cited here cover December 2025 through May 2026.
[35] For more information on artificial intelligence use at work, see the U.S. Census Bureau’s Household Trends and Outlook Pulse Survey August 2026 report Does Using Artificial Intelligence Save Time at Work?
[36] Data on unemployment rates for recent college graduates come from the Federal Reserve Bank of New York The Labor Market for Recent College Graduates; see also Stanford Institute for Economic Policy Research’s July 2026 policy brief What is really happening to jobs? Separating AI hype from reality.
[37] New Hampshire Employment Security produces a monthly publication highlighting economic developments affecting New Hampshire. See the February 2026 Economic Conditions report Artificial Intelligence in New Hampshire’s Labor Market.
[38] See U.S. Bureau of Economic Analysis U.S. Gross Domestic Product webpage, accessed August 21, 2026.
[39] Comparisons based on the U.S. Bureau of Economic Analysis’s Regional Economic Accounts data, accessed August 2026.
[40] See U.S. Bureau of Economic Analysis Gross State Product by State, accessed August 21, 2026.
[41] For more information on tariffs, see the Encyclopedia Britannica entry for “Tariff” updated August 19, 2026, the Tax Foundation’s Glossary entry for Tariff, The Budget Lab at Yale University’s August 11, 2026 The State of U.S. Tariffs, the Tax Policy Center’s August 10, 2026 iteration of its feature TPC Tariff Tracker, The Federal Reserve Bank of Boston’s February 6, 2025 analysis The Impact of Tariffs on Inflation, and The Overshoot, How to Think About the Tariffs, April 4, 2025.
[42] New Hampshire Imports and Exports by Commodity and Countries requested from the New Hampshire Department of Business and Economic Affairs.
[43] For all national labor force statistics in this paragraph, see the U.S. Bureau of Labor Statistics Labor Force Statistics from the Current Population Survey.
[44] See the U.S. Congressional Budget Office’s January 7, 2026 report The Demographic Outlook: 2026 to 2056; see the U.S. Bureau of Labor Statistics Employment Situation Summary, released August 7, 2026.
[45] See U.S. Bureau of Economic Analysis data report Personal Income and Outlays, June 2026, released July 30, 2026.
[46] See U.S. Bureau of Labor Statistics, JOLTS state data publication changes 2026, released June 4, 2026.