KEY POINTS
- Median household income in New Hampshire did not cover basic costs for a four-person family in 2024, falling nearly $2,000 short
- Compared to a 2015 four-person family, a 2024 family had over $17,000 less in surplus income annually
- Many essential expenses have grown over time while non-essential items, like televisions and toys, have gone down in price after adjusting for inflation
- Mortgage costs have doubled since 2015 for a median-priced single family home, from about $23,000 to over $47,000 annually
- Health care deductibles have increased 323 percent since 2005
- Child care for two children over the course of childhood can cost families nearly $300,000
- Average in-state tuition at New Hampshire’s four-years institutions in 1995 cost nearly half the average tuition in 2023
- New Hampshire median household incomes increased about 76 percent between 2005 and 2024, from about $89,000 in 2024 dollars to nearly $100,000
Over the past two decades, the cost of living in New Hampshire has outpaced what most families earn, reshaping the state’s economy and daily life. The typical household now earns nearly $100,000 a year, yet a family of four with this income still falls about $2,000 short of covering basic needs annually.[1] Housing, health care, and child care costs have risen far faster than paychecks, while even essentials like food and energy strain family budgets. This report traces how these shifts have occurred, revealing the widening gap between what Granite Staters earn and what it takes to make ends meet.
Young Granite Staters who are living on their own for the first time in 2025 are facing considerably higher costs than young people ten or twenty years ago. According to the Massachusetts Institute of Technology’s Living Wage Calculator, the cost of basic living expenses in New Hampshire for a family with two working adults and two children falls in the top quarter of states nationwide, among Massachusetts, Vermont, California, Connecticut, New York, Colorado, Oregon, and Alaska, at $129,768 annually.[2]
Challenges include higher housing costs, incomes that have not kept pace with inflation and the cost of goods and services, increased expenses for caring for aging parents and family members with developmental disabilities, consistently high prices for child care and health care, unpredictable changes in gasoline prices, and high rates of student loan debt.
Housing costs are a key driver of higher core living expenses compared to previous decades. Though New Hampshire’s household income increased by nearly 32 percent between 2015 and 2024, the cost of a mortgage payment, including property taxes, for a new median-priced home was over two and a half times higher at the end of this period.[3]
The U.S. Department of Housing and Urban Development has identified households spending more than 30 percent of their income on housing to be “cost burdened.”[4] To avoid being cost burdened, a family purchasing a median-priced home in New Hampshire in 2024 would have needed a household income of about $157,500 at minimum, over $57,700 more than the median household income that year. Some young families face the difficult decision of whether to invest in a home with limited resources for other household expenses, or to forgo a home purchase entirely, losing an essential wealth-building opportunity over their lifetimes. Other families may not be able to save up the resources to purchase a home and instead face high rental costs that drain their resources, preventing equity building.

Opportunities for building savings in 2024 may have also been diminished for young families compared to previous generations after paying a monthly mortgage for a new median-priced house, child care for two children under five years old, food expenses, gasoline for transportation, and health care costs. Despite living in the run-up to the housing market crash and subsequent recession, a four-person family earning the New Hampshire median household income in 2005 would have the equivalent of about $5,000 annually in 2024 dollars to put toward other necessary household expenses, though likely did not have much leftover for emergencies or savings. Due to considerably lower mortgage payments for a new median-priced house, a 2015 Granite State family in this example had the equivalent of $15,443 in inflation-adjusted 2024 dollars to put toward their additional household costs, savings, and emergencies. If the 2024 median-household-income-earning family in this example made the same financial decisions as the example families in 2005 and 2015, the 2024 household would not have had enough income to pay for these major household expenses and would have acquired an annual debt of $1,906. The family in 2024 also would have no additional funds needed for other household expenses or emergencies, such as student loans, car payments or repairs, phone or internet bills, or household utility costs. While the financial well-being of the New Hampshire household in this example was challenging in 2005, inflation adjustments demonstrate that families in 2024 may face more precarious financial situations than previous generations.[5]
This Report examines several acute cost-of-living challenges that Granite State families face which many families of previous generations did not. These include inflation rising faster than incomes, increasing costs of goods and services, skyrocketing housing costs, consistent rises in health care costs, and high prices for caregiving and other related household expenses. While there are reliable cost-of-living calculators from both the Massachusetts Institute of Technology and the Economic Policy Institute, estimates from these sources have methodological changes year-to-year and are not recommended for comparing finances across generations.[6] Additionally, this Report specifically examines the higher costs likely encountered by young families, which may be diluted when using cost-of-living tools that average across all age groups.
Incomes Lag Behind Costs of Goods and Services
Median Household Income (in 2024 dollars):
2005: $88,749
2015: $90,434
2024: $99,782
While household incomes in New Hampshire have risen on paper, inflation and the soaring cost of essentials have eroded what those dollars can buy. The estimated median household income in New Hampshire in 2024 was $99,782. The median reflects the income level at which half of households have higher incomes and half have lower incomes. Though median incomes typically increase over time, adjusting for inflation allows the observation of household spending power year-over-year. For example, the median household income in 2005, when adjusted for inflation into 2024 dollars, was $88,479, about $11,000 less than the median household income in 2024. This means that median income households in 2024 had over $11,000 more to spend annually, in terms of the value of dollars in 2024 relative to the costs of goods and services in 2024, than similar households in 2005.
New Hampshire inflation-adjusted median incomes steadily increased between 2005 and 2007; however, spending power dropped precipitously in the years following the housing market crash and subsequent Great Recession, falling about $8,200 in real spending power from 2007 to 2012. Median income households in New Hampshire mainly experienced stagnant spending power during the first half of the recovery from the Great Recession, with little change between 2009 and 2014. Granite State household spending power steadily increased between 2015 and 2019, leading up to the COVID-19 pandemic in 2020.

Data for household income is not available for 2020 due to pandemic-related disruptions to the U.S. Census Bureau’s survey collection; however, post-pandemic inflation-adjusted median incomes show a considerable increase in the years following the pandemic compared to pre-pandemic years, likely due in part to federally funded stimulus payments to individuals intended to offset economic hardship from widespread job losses. Since 2021, inflation-adjusted median household incomes in New Hampshire have remained steady except for 2022, when median household income fell behind inflation before rebounding to inflation-adjusted 2021 levels in 2023.[7]
Affordability Crisis Strikes Hardest on Key Necessities in the Northeast
Prices for basic needs, especially housing, food, and medical care, have grown much faster than other goods and services, tightening budgets even for middle-income families.
While median household incomes typically increase over long periods, if the costs of goods and services rise faster than household incomes, families will find their funds do not stretch as far as they did in previous years. Inflation, which describes the increased costs of goods and services relative to the value of the dollar, does not impact all costs equally. The federal government measures changes in prices through different versions of the Consumer Price Index (CPI). Examining long-term trends in the CPI is a helpful way to identify which goods and services might increase the cost of living in specific areas of the country during particular time periods.
When examining all components of the CPI from 2005 to 2024 in the Northeast region, education (tuition, other school fees, and child care) and communication (phone and internet services), recreation, and apparel increased the least of all expenditure categories, between approximately 11 to 36 percent. The two costs with the fastest growth during this timeframe were food (not alcohol) and the other goods and services category, which includes “tobacco and smoking products, haircuts and other personal services, funeral expenses.”[8]

These patterns suggest that some items considered “nice to haves,” such as certain types of clothing and recreational activities, remained more affordable over time. For example, the price of a television or toys, listed as recreational commodities, decreased by 96 and 64 percent, respectively, between 2005 and 2024.[9] At the same time, necessities like medical care, food, and housing costs increased comparably. These patterns make budgeting more challenging, as families can reduce spending on clothing and entertainment but scaling back on food, medical care, and housing can adversely affect the health and well-being of families.
Income Differences Among Granite Staters
The ability to withstand rising costs varies widely: households in rural counties and communities of color have seen smaller income gains and face greater financial strain. Variability in income levels among New Hampshire’s counties and its populations of color may mean that certain Granite State families have more difficulty keeping up with increasing prices, putting them at greater risk for financial hardship than others.
Coos and Sullivan Counties Experience Smallest Income Growth from 2009-2023
Median household incomes from the 2019 to 2023 period ranged from lows of $58,439 in Coos County and $75,929 in Sullivan County to highs of $100,436 in Hillsborough County and $113,927 in Rockingham County.[10] The differences in living expenses between rural and more urban areas of the state are likely reflected in these different income levels. Rural counties also have higher poverty levels than southeastern New Hampshire, though some estimated living costs are consistent across all ten counties.
Rates of median household income growth over a specific timeline can give insight into the economic well-being of families living in particular areas. The largest rates of median household income growth between 2009 and 2023 occurred in Carroll (63.1 percent), Grafton (53.0 percent), and Belknap (50.0 percent) counties. The increases likely reflect both labor market changes that raised wages and, particularly in amenity-rich areas, recent population growth due to the domestic in-migration of individuals and families from other states. Families migrating to New Hampshire may be bringing higher incomes to regions than many families who were already living in those counties.[11]
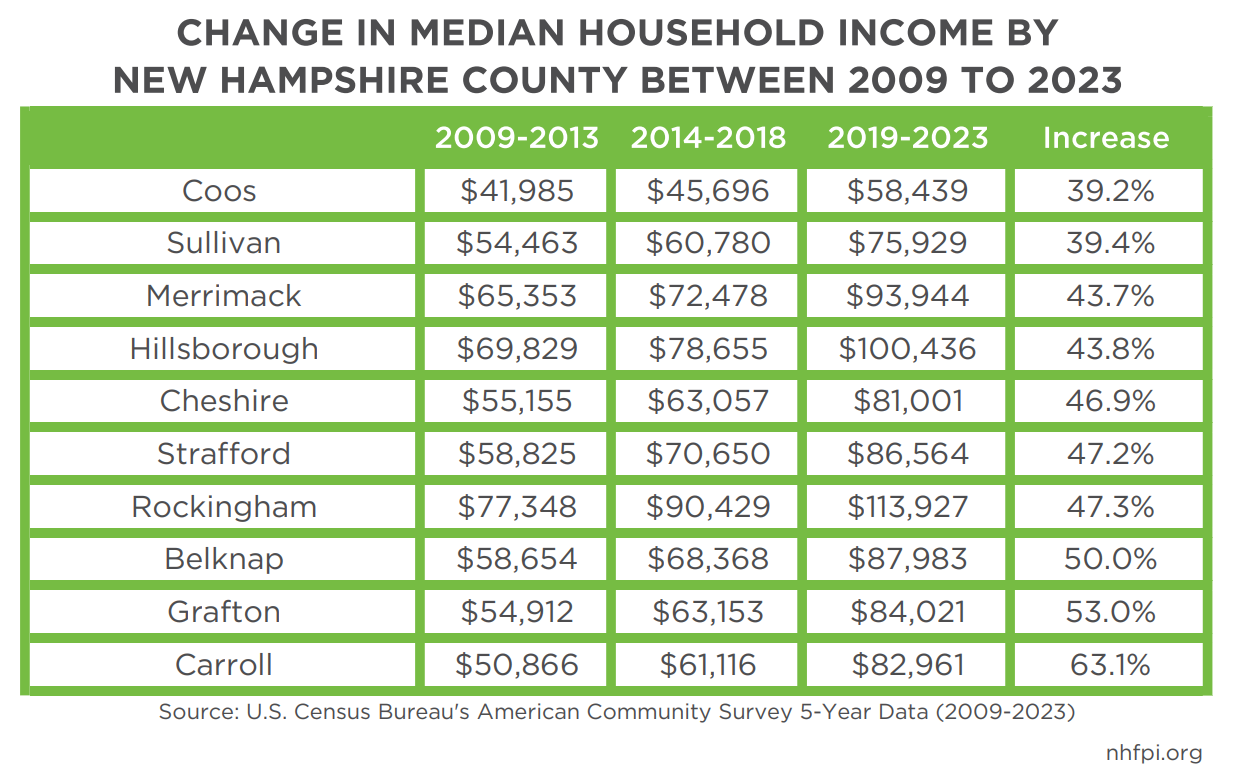
Coos and Sullivan Counties had the smallest median household income growth during the 2009 to 2023 period, at 39.2 percent and 39.4 percent, respectively. Sullivan County also had the lowest population growth rate (0.6 percent) of any New Hampshire county that grew between 2010 and 2024, while Coos County’s population experienced a 5.7 percent decline during the same period.[12]
Income Growth for Many Granite Staters of Color, But Incomes Still Lag Behind
Average per capita income provides an income estimate for every person in New Hampshire, including children. This measure helps examine income and income growth among individuals, which may be blurred at the household level because not all household members may be working. For example, New Hampshire’s median household income in 2023 was $95,628, while average per capita income was $50,867.[13] Per capita income has shown differences between races and ethnicities in New Hampshire from 2009 to 2023, reflecting historic and current systemic barriers to opportunity, including financial upward mobility for the Granite State’s families of color.[14]
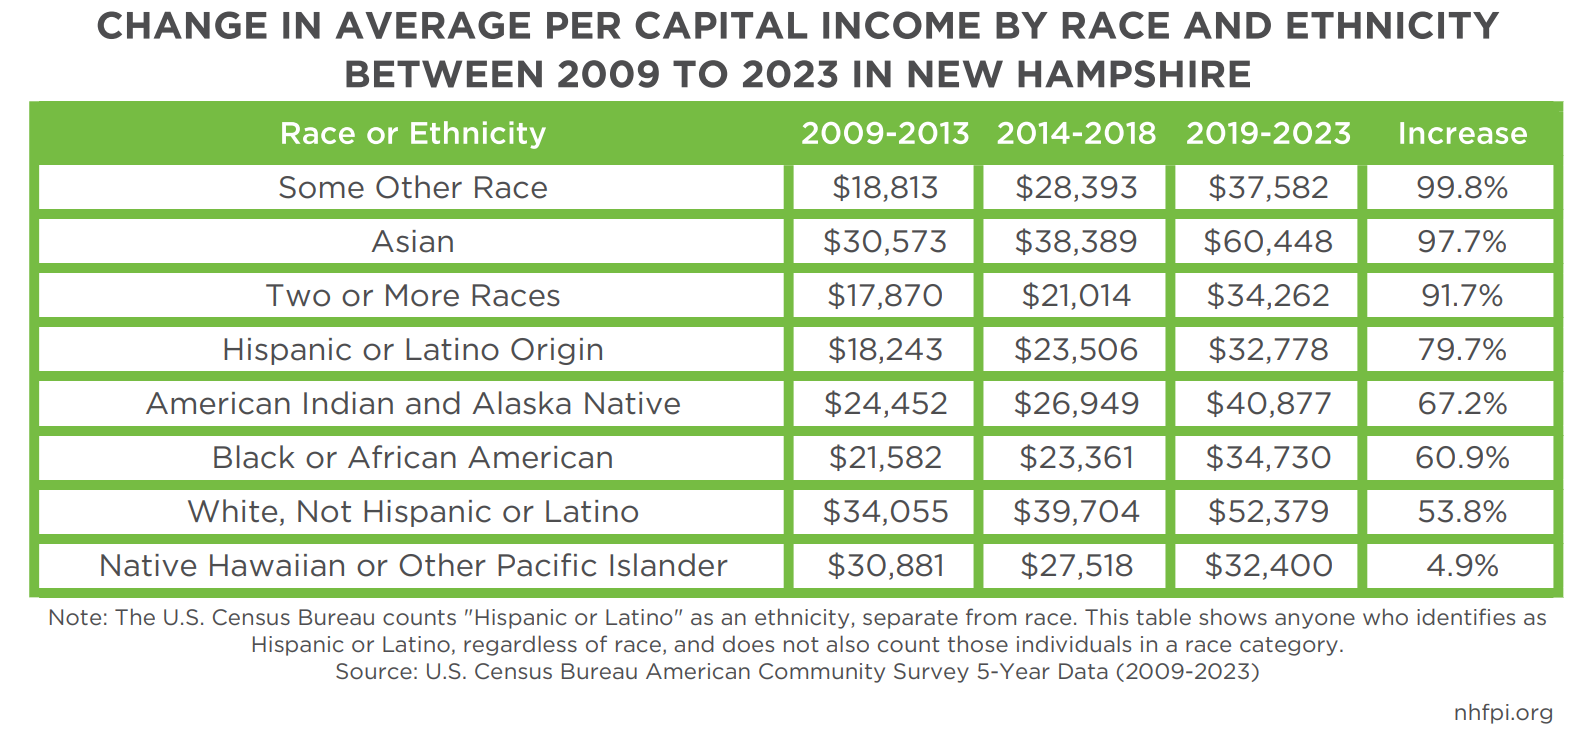
The most recently available Census data show that Granite Staters identifying as Asian and white non-Hispanic had the highest per capita incomes among all racial and ethnic groups, while New Hampshire residents identifying as Hispanic or Latino and Native Hawaiian or Pacific Islander had the lowest. When compared to per capita incomes from the 2009 to 2013 five-year Census data, average per capita incomes of Granite Staters of color are growing at a faster rate than incomes of white, non-Hispanic Granite Staters. While white, non-Hispanic average per capita incomes grew by about 54 percent during this timeframe, per capita incomes among Granite Staters of color increased between approximately 61 percent (Black or African American individuals) and about 100 percent (individuals identifying as a race not listed in the survey).[15]
Housing
Annual Mortgage Payment for a New Median-Priced House, Including Property Taxes (in 2024 dollars):
2005: $36,285
2015: $22,987
2024: $47,249
Housing has become the defining pressure point in New Hampshire’s cost-of-living crisis, with home prices and mortgage payments more than doubling in a generation.
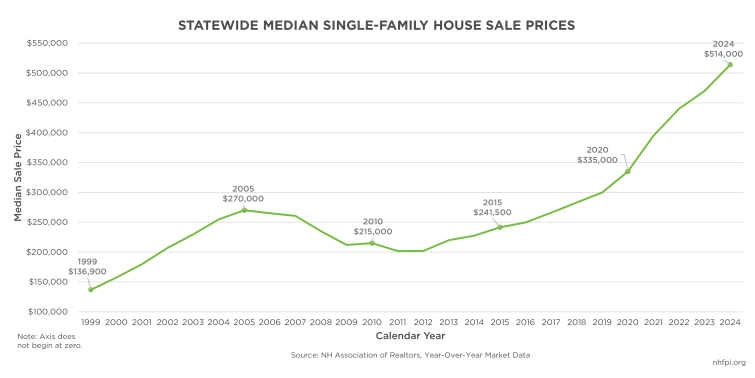
As of 2024, the cost of purchasing a median-priced single-family house in New Hampshire had risen by around 275 percent since 1999 and by around 90 percent since 2005. Median prices increased rapidly from 1999 to 2005, declined during the Great Recession, and then increased steadily during the following years of economic recovery. Housing costs continued to grow in the years leading up to and since the start of the pandemic, rising by approximately 113 percent from 2015 to 2024.[16] Median-priced single-family houses have continued to increase in 2025, reaching a record high of $569,450 in June, although costs have begun to level out in some regions of New Hampshire.[17] High housing costs have been driven by relatively low availability and inventory. This situation is influenced by multiple interrelated factors, including declines in housing construction, municipal zoning restrictions, demographic changes and in-migration, and high mortgage interest rates, which may have limited housing turnover.[18]
While prices have increased throughout the last two decades, most incomes have not kept up with high housing costs. From 1999 to 2024, the statewide median household income in New Hampshire increased by 30 percent, less than a third of the 101 percent increase in the median cost of a single-family house, after accounting for inflation.[19]
Mortgage costs as a percentage of income can also provide more insight into the cost constraints facing new homebuyers in today’s market. Using the average 30-year fixed mortgage rate, the average statewide property tax, the annual median single-family house sale price, and factoring in a five percent down payment, a Granite State family purchasing a home in 2024 would have faced a monthly mortgage payment of approximately $3,937, not including homeowners’ insurance or required fees at the time of purchase. Applying these same calculations to 2015 data, a family in New Hampshire could have expected a monthly mortgage payment of $1,489 a decade ago, around 164.4 percent less than the monthly cost in 2024, not accounting for inflation.[20] For a median-earning household purchasing a median-priced house in 2024, mortgage payments would have accounted for close to half, or about 47.4 percent, of that household’s annual income. In comparison, a household earning the median income in 2015 could have expected to pay only around a quarter, or 25.4 percent, of their income towards mortgage payments.[21]
Carroll County Experienced a 387 Percent Increase in Sale Prices Between 1999 and 2024
Although housing costs have increased statewide and have remained the highest in the southeastern part of the state, prices have risen at much faster rates in New Hampshire’s rural counties. From 1999 to 2024, Carroll County saw the most rapid growth in median single-family house sale prices, at 387.0 percent, with five of the state’s six most rural counties experiencing price growth rates above 300.0 percent. The state’s southernmost counties, including Cheshire, Hillsborough, and Rockingham Counties, experienced rates close to the statewide median, while Merrimack and Strafford Counties saw slightly higher increases.[22] Low housing inventory, combined with population changes, is likely impacting faster-growing costs in New Hampshire’s rural regions. From 2010 to 2024, Carroll County experienced the fastest population growth, while Belknap County experienced growth above the statewide average.[23] Housing constraints may affect where a Granite State family can find an affordable home, potentially leading to residents living farther from employment and educational opportunities.

Changing Demographics of Granite State Homeowners
Income differences by race and ethnicity impact who can afford homeownership in New Hampshire. Homeownership rates have increased for households of color, particularly among people identifying with two or more races and Hispanic or Latino ethnicity, likely reflecting the state’s changing demographics over the past two decades. Homeownership rates among Black or African American Granite Staters have remained relatively stable, despite Black Granite Staters making up an increasingly larger portion of the overall population. Non-Hispanic white Granite Staters continue to be overrepresented in terms of homeownership in comparison to the state’s overall population, making up 87.2 percent of the population in 2020, but 92.3 percent of the state’s homeowners during the 2019-2023 period. Communities of color are generally underrepresented among homeowners. Hispanic or Latino Granite Staters comprised 4.3 percent of the population in 2020, but 1.9 percent of homeowners in 2019-2023; Black or African American Granite Staters comprised 1.4 percent of the population, but 0.6 percent of homeowners as of the most recent data.[24]
Examining homeownership among different generations also reveals inequities. Homeownership rates among residents aged 35-54 have declined over time, likely reflecting higher housing costs outpacing income. From 2010 to 2023, the homeownership rate among Granite Staters aged 35 to 44 fell by 11.2 percent, while the rate for people aged 44 to 54 declined by more than twice that, at 35.1 percent. As the state’s population continues to age, older adults are representing a larger portion of homeowners over time. Those age 65 to 74 had the highest increase in homeownership rates (50.0 percent) across all age brackets from 2010 to 2023, while Granite Staters age 75 to 85 saw the second highest increase (41.3 percent) during that period.[25] While increased services and supports for independent living have allowed more older adults to remain in their homes for more extended periods, the lack of increased housing inventory can create challenges for younger families entering the housing market.[26]
Almost Half of Granite State Renters are Housing Cost Burdened
High housing costs have also impacted renters in the state, with the median monthly cost of a two-bedroom unit, including rent and utilities, increasing by 136.8 percent from 2000 to 2024.[27] While rental costs have not increased as drastically as single-family house prices have, renters in New Hampshire are more likely to be burdened by housing costs. Nearly half, or 49.0 percent, of renter households in New Hampshire met the definition of cost burden in 2024, compared to about 28 percent of owner households paying a mortgage and about 20 percent of owner households without a mortgage.[28] Income and wages have not kept up with rental costs across the state, contributing to high rates of cost burden among Granite State renters. From 2005 to 2024, the New Hampshire median household income increased by 12.4 percent, while the median monthly cost of a two-bedroom unit increased by 18.6 percent, after adjusting for inflation.[29] Renter households also typically have incomes far below both the median household income and the median income among homeowner households.[30]

Home Energy Costs Double Between 2005 and 2023
Granite Staters have also experienced rising energy costs over time, likely contributing to a greater housing cost burden among families. From 2005 to 2023, the average monthly residential electricity bill for homeowners in New Hampshire increased by 93.7 percent, from approximately $87 per month to almost $169, according to the most recent data.[31] Residents have also seen increases in the price of heating their homes, with the average cost of oil per gallon rising by approximately 106.5 percent from January 2005 to January 2024, excluding service costs and other fees.[32] The price of natural gas, which is also used for home heating in some households, increased by 25.1 percent from 2005 to 2024.[33]
Health Care and Health Insurance
Average Annual Expenditures for Health Care (in 2024 dollars)
2005: $6,451
2015: $9,547
2024: $10,850
Even families with employer-sponsored insurance are paying significantly more for care than a decade ago, as premiums, deductibles, and out-of-pocket expenses climb faster than wages. For a four-person family, federal survey data suggested the estimated expenditures on health care in the northeastern United States, unadjusted for inflation, was $4,127 each year, based on data from 2004-2005. That increased to about $7,422 ten years later, and $10,495 in the most recent data from 2022-2023, which is approximately $10,850 when adjusted for inflation to 2024. These expenses included the costs of health insurance, such as premiums, as well as out-of-pocket expenses paid directly by families, including for medical services, drugs, and other supplies.[34]
A premium is the amount of money an individual, family, or company pays to maintain health insurance coverage for an enrollee or group of enrollees every month. Other costs that enrollees must pay outside of their premiums are “out-of-pocket” costs paid directly; these forms of cost sharing include deductibles (typically paid before insurance coverage begins to offset costs), copayments (normally a dollar amount paid associated with a specific service), and coinsurance (a percentage amount of the total cost of a service paid by the enrollee).[35] The data discussed in this Report expresses health insurance premiums and other out-of-pocket costs as annual costs.
Per capita health expenditures totaled about $14,000 per person in 2023 in the U.S., and historical data suggest New Hampshire’s per capita health care expenditures are higher than the national average.[36] However, many of these costs were not directly paid by health care consumers, but were paid through insurance or other forms of health coverage. More than half of Granite Staters received coverage through their employer during the 2018-2022 period.[37] Despite lowering costs, employer-sponsored insurance does not necessarily eliminate out-of-pocket costs for families. Family plan costs have risen substantially, and faster than overall inflation during the 2005-2024 period, for both employers and employees.
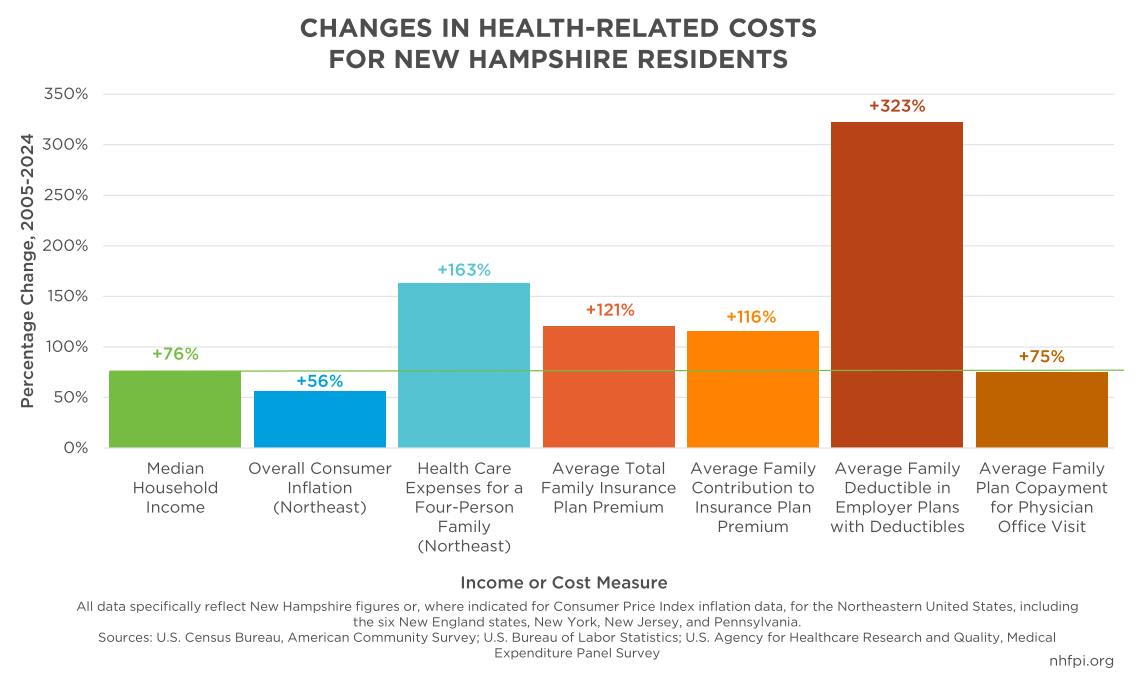
The amount paid for health care by a four-person family in the northeast increased faster (163 percent) from 2005 to 2024 than median household income and overall consumer inflation during this period (56 percent). The average employer-sponsored private insurance family plan copayment for a physician visit increased (75 percent) at about the same pace as median household income during these two decades.[38]
However, overall consumer costs may not reflect the increases that specific consumers, particularly families on employer-sponsored insurance plans, may have faced. The average premium paid by employers and employees for a family insurance plan has increased (121 percent) faster than median household income, and totaled $26,119 in 2024; that cost was about the equivalent of buying a new 2025 Honda Civic or Subaru Impreza, but unlike purchasing a car outright, premiums are a recurring annual cost.[39] While many employers cover a significant portion of the annual family insurance premium cost, the average employee contribution to the family insurance plan premium rose 116 percent during this period, reaching an estimated $6,220 average cost in 2024. The deductible that a family would be expected to pay as part of their health coverage rose 323 percent during this period, averaging $4,335 in New Hampshire in 2024. Both these costs have come down from slightly higher peaks in 2022.[40]
Certain costs for specific health needs also carry significant price tags. The highest out-of-pocket costs recorded in 2022 were for having a child. The average cost for pregnancy with delivery charged to the patient was $1,772 in 2022 and was 54 percent higher than the next-highest out-of-pocket health need, which was multiple sclerosis. The out-of-pocket costs for pregnancy and delivery increased 42 percent, from $1,246 to $1,772, between 2016 and 2022. Multiple sclerosis treatment costs went up 96 percent, from $490 to $961 during that period.[41]
These increasing costs have consequences for access to care. A 2024 survey of New Hampshire adults found that about seven out of every ten Granite State adults delayed or went without care due to cost. Additionally, about two in five reported struggling to pay a medical bill, with higher levels of reported hardship among adults with less than $100,000 in household income.[42] Individual health insurance marketplace premiums are likely to increase substantially in 2026 due to both underlying cost pressures and policy changes.[43]
Nutrition and Social Determinants of Health
Annual Cost of a Nutritious Diet for Four-Person Family (in 2024 dollars)
2005: $11,581
2015: $12,259
2024: $11,877
Access to other resources, or lack thereof, can also impact health. The Social Determinants of Health include, according to the U.S. Department of Health and Human Services, “the conditions where people are born, live, learn, work, play, worship, and age that affect a wide range of health, functioning, and quality-of-life outcomes and risks.” These conditions include economic stability, housing, access to education, social and physical environments, and access to formal health care services.[44]
Food security and consistent access to healthy food are key components of health. Food insecurity occurs when households are unable to provide enough food for one or more household members due to a lack of money or other resources. Adults who are food insecure are more likely to develop chronic and mental health conditions, and food-insecure children are more likely than their peers to experience developmental challenges, perform poorly in school, and face other adverse health outcomes.[45] In the 2021-2023 period, an estimated 42,300 households, or 7.4 percent of households in New Hampshire, were food insecure.[46]
Food costs faced by consumers in the Northeastern United States, excluding alcohol, increased 72 percent from 2005 to 2024, outpacing the overall 56 percent increase in the price of goods and services in the region.[47] The U.S. Department of Agriculture estimates changes in the annual cost of different healthy food plans. The average cost of a food plan for a family of four with two children under five years old was about $11,877 in 2024. Food costs calculated in this manner increased by about 60 percent, faster than overall inflation, between 2005 and 2024.[48]
Difficulty affording health care and other necessities for healthy living may be unevenly distributed among New Hampshire residents. New Hampshire residents who are more likely to have lower incomes, including Black or Hispanic Granite Staters or residents with disabilities, may face greater difficulty accessing health services due to cost in their home communities. Estimates of health care costs in New Hampshire counties are not substantially different. However, the median household income in Rockingham County is twice that in Coos County, suggesting rural areas may face disproportionate hardship in affording health care and insurance.[49]
Caregiving Costs
For families caring for children, aging parents, or relatives with disabilities, caregiving has consistently been one of the largest household expenses. Young families who have members who require caregiving experience a higher cost of living than families without members who need caregiving. These costs can include the cost of care itself, lost wages, slowed career trajectories, forgone payments into the federal Social Security system, and socioemotional costs associated with the mental health and well-being of family caregivers.
Families May Spend Nearly $300,000 to Send Two Children to Child Care Throughout Childhood
Average Annual Cost of Child Care for Two Children Under 5 (in 2024 dollars)
2005: $24,960
2015: $27,357
2024: $29,082
The price of unsubsidized center-based child care for two children under five years old has been one of the most significant expenses for family budgets, consistently constituting about 30 percent of median household income since 2005, or around $30,000 annually in 2024 dollars.[50] The New Hampshire Child Care Scholarship Program helps to reduce these expenses for families that earn less than or equal to 85 percent of the State Median Income, a specific measure calculated and set by the state and federal governments.[51] However, child care prices still put a strain on family budgets, including those who are not eligible or are eligible but not enrolled in the Scholarship Program. Additionally, many families with parents in the workforce need to pay for child care even after their child starts kindergarten. This is because the hours of the school day often do not align with typical work hours, and there is no regular schooling available in the summer in New Hampshire.
The combined price of unsubsidized before and after-school care and summer camp for one Granite State child in 2024 was estimated to be nearly $9,500 annually, or $19,000 annually if a family has two school-aged children under 13. These costs add up tremendously over time. If a Granite State family gave birth to one child in 2017 and another in 2020 and used center-based child care until each child reached 13 years old, the family would spend an estimated $297,133 over the course of sixteen years (2017 to 2032).[52] These are funds that are not going into the family’s retirement savings, emergency funds, or savings for the children’s futures.
Annual Cost for One Year in a Skilled Nursing Facility Costs Over $140,000 in 2024
Families who are caring for adults who need varying levels of support are also faced with high annual costs for adult care. According to the New Hampshire Department of Health and Human Services, the annual cost for a spot in a skilled nursing or intermediate care facility was nearly $141,712 in July 2024 for private pay individuals, while the yearly Medicaid cost in the same year was $114,734.[53]
New Hampshire’s Choices for Independence program, which supports older adults and individuals with physical disabilities to live and receive necessary care in their homes or in community settings outside of nursing facilities, had an average annual cost of $31,977 per enrollee.[54] Although reliable data for private pay rates are not available for individuals who pay out-of-pocket for similar home and community-based support, those rates are traditionally higher than Medicaid rates. According to cost tracking conducted by the U.S. Centers for Medicare and Medicaid Services, annual per Medicaid enrollee costs grew approximately $34,633 (43 percent) for individuals living in skilled nursing facilities and $9,372 (41 percent) for individuals receiving home health services between 2010 (the first year the indices were available) and 2024.[55] During this same period, median household income increased by 63 percent. Though these costs do not impact households equivalently, they are likely to affect an increasing number of households as the state’s population ages overall.
Other Potential Family Expenses
There are additional significant expenses that may occur for some families during specific periods, including post-secondary education tuition for families with children pursuing a degree and increased transportation costs for families in more rural areas.
New Hampshire Public Higher Education Doubled in Inflation-Adjusted Dollars Between 1995 and 2023
New Hampshire is consistently one of the lowest state funders of public higher education in the country. Without State support to offset costs, colleges and universities must rely on higher tuition dollars and fees to supplement annual operating budgets.[56] The most recent data suggest that New Hampshire ranks second for the highest percentage of graduates (70 percent) with student debt. Those graduates with debt have the highest average debt, at $39,950, compared to all other graduates in the country.[57]
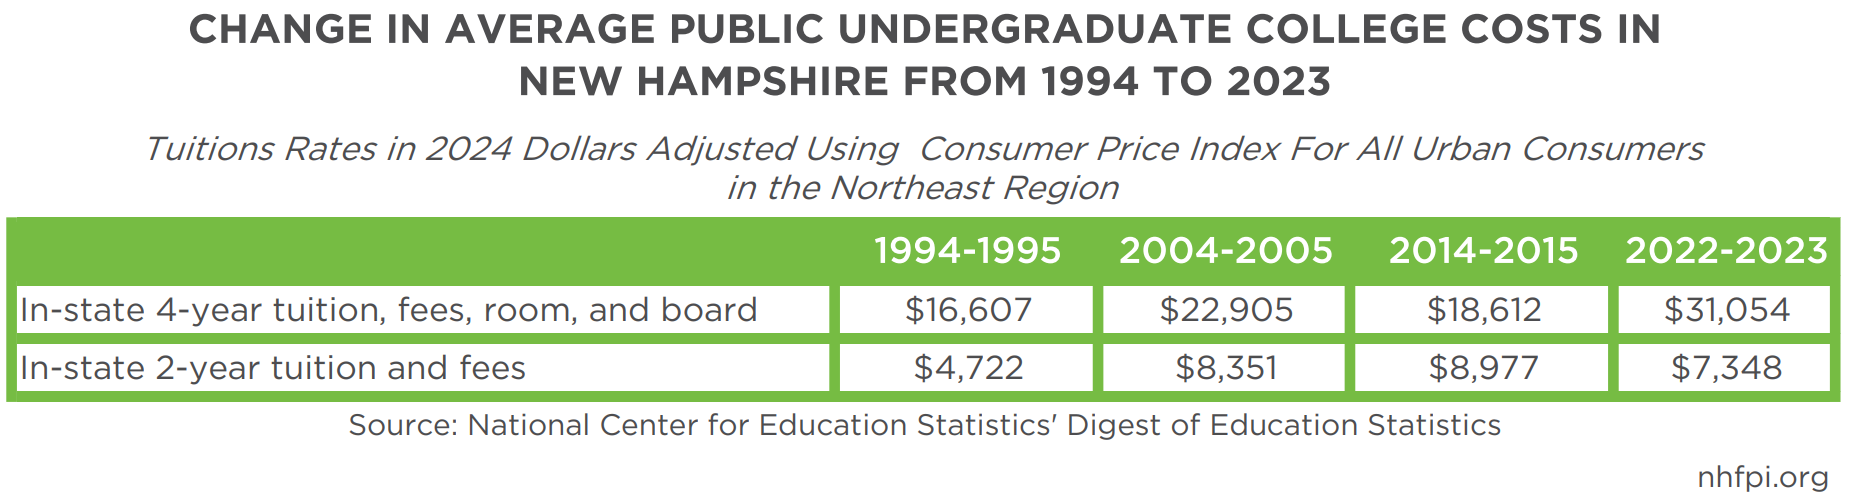
New Hampshire’s recent college graduates are paying considerably more for their college education than graduates from previous generations. In 1995, the annual average in-state tuition for a New Hampshire public four-year institution, including room and board, cost the equivalent of $16,607 in 2024 dollars, which is nearly half the 2023 average cost ($31,053) in 2024 dollars. Average tuition at New Hampshire’s two-year institutions almost doubled between 1995 and 2005 when adjusted to 2024 dollars, but it decreased from 2005 to 2023, dropping from $8,351 in 2005 to $7,348 in 2023.[58] College attendance may be advantageous to both families and the State economy; however, current college students and recent graduates may not see as high a return on investment as previous generations when adjusting for inflation and accounting for student loan debt.
Transportation Costs
Annual Cost of Gasoline (in 2024 dollars)
2005: $4,477
2015: $2,842
2024: $2,630
With limited public transportation options, Granite Staters are typically reliant on personal vehicles and the expenses associated with them to travel around their communities.[59] In rural parts of the state, where families may need to travel further distances to work, school, and other destinations, the cost of fuel can become a significant part of a family’s budget. Regular gasoline in New England was 42 percent more expensive per gallon in 2024 than in 2005, although it peaked at 75 percent more costly than 2005 levels in 2022, unadjusted for inflation.[60]
Purchasing a vehicle has also become more expensive in recent years. While the increases in prices of new cars (22 percent) and used vehicles (35 percent) were behind inflation overall between 2005 and 2024, all or almost all of those increases in car prices came between 2019 and 2024, with new car prices increasing 23 percent in five years and used cars up 32 percent.[61] The average used car price was $25,540 in the United States in 2024, according to Experian, while the average new car price was $47,218. These prices do not include borrowing costs associated with financing for purchasing a vehicle.[62]
Conclusions
New Hampshire’s rising cost of living poses a serious challenge to both family well-being and the state’s long-term economic strength. Without action to make essentials more affordable, too many families will fall behind or be forced to move.
This Report is not a comprehensive analysis of all possible household expenses, but it is intended to provide insights into the challenges Granite State families may experience trying to afford their most significant and necessary expenses. New Hampshire has relatively high living costs; the Massachusetts Institute of Technology’s Living Wage Calculator estimates that the 2025 cost of living for a Granite State household with two working adults and two children is within the top quarter of living expenses for all states. Among the highest costs the Living Wage Calculator identified for this family living in the most expensive states, including New Hampshire, child care was the largest expense in all but two states, and housing was the highest or second-highest cost in all but four.[63] The considerable increases in the cost of living for major family necessities outlined in this Report highlight the difficulties faced by young New Hampshire families and the growing number of older Granite State adults in affording core expenses compared to families in prior decades. The high cost of living Granite Staters experience poses both short- and long-term risks to the state.
In the short term, many Granite State families may struggle to make ends meet in the current New Hampshire economy. In 2024, about 99,000 Granite Staters (7.2 percent) lived below the poverty line, 4.5 percent reported they did not have health coverage, while one in seven were enrolled in Medicaid, nearly half of New Hampshire renters were housing cost-burdened; and income inequality, as measured by the Gini Index, was higher than it was in 2010.[64] Proposed changes to support services at the federal and state levels may further limit the ability of young Granite State families to meet their financial and caregiving responsibilities.[65] These challenges impact families from the lowest-income households to those above median income levels. For young New Hampshire families just starting out, and for those interested in moving to the Granite State, limited and expensive housing, child care, adult caregiving, and other high living costs may make staying or relocating to New Hampshire impossible.
For the long-term trajectory of the state, there is a clear need for young people to remain in, or move to, the state. New Hampshire’s population is aging, and a large portion of the workforce will reach retirement age in the next decade.[66] The Granite State risks a shrinking workforce and economy if there are not enough adults of traditional working ages available to fill the positions of those retiring. From an economic perspective, if New Hampshire’s households are experiencing high living costs and find themselves living paycheck-to-paycheck to afford the essentials, they will have less income to spend on other goods and services in the local and state economy, including those that support key tax and revenue streams for the state. Families may also be limited in their abilities to save for emergencies and retirement, creating a system in which more Granite State families may fall into poverty, including older adults.
Rising costs for the essentials of living, such as housing, food, and medical care, threaten the well-being of families throughout the state and its long-term economic prospects. Effectively addressing this combination of new and different challenges, relative to recent decades, will be a critical task for communities, businesses, and policymakers to help ensure New Hampshire will thrive today and in the future.
Endnotes
[1] See U.S. Census Bureau’s American Community Survey 1-Year Data Table S1901. Figures derived in the table entitled, “Costs of Basic Living Expenses for a Family of Four in New Hampshire” were calculated using the following methodology:
- Median Household Income: U.S. Census Bureau’s American Community Survey 1-Year Data 2005-2024. Incomes adjusted to 2024 dollars using the Consumer Price Index for All Urban Consumers (CPI-U) in the Northeast.
- Mortgage Payment for New Median-Price Home: Mortgage calculations assume a 5 percent downpayment and include the annual median single-family house sale price, taken from the NH Association of Realtors’ Market Data; the annual average 30-year fixed mortgage rate, taken from the Federal Reserve Bank of St. Louis; the annual average statewide property tax rate, taken from the NH Department of Revenue Administration; and factors in a five percent downpayment on a house. Mortgage payments, based on the principal less the assumed downpayment and interest rates, are calculated using the Federal Reserve Bank of Dallas, Payment Calculator for Mortgages. Estimated payments adjusted to 2024 dollars using the Consumer Price Index for All Urban Consumers (CPI-U) in the Northeast.
- Child Care for Two Children Under 5: Child care prices were derived for an infant and four-year-old using Child Care Aware of American (CCAoA) annual price reports for 2010, 2015, and 2024. Data for 2005 was not available as CCAoA did not begin collecting this data until 2010. To estimate an initial price for 2005, the 2010 data was adjusted to 2005 dollars using the national CPI-U for Day care and preschool in U.S. city average, all urban consumers, not seasonally adjusted. Estimated payments adjusted to 2024 dollars using the Consumer Price Index for All Urban Consumers (CPI-U) in the Northeast.
- Food: Estimates derived using U.S. Department of Agriculture’s USDA Food Plans: Monthly Cost of Food Reports, accessed October 8, 2025. This calculation averages June and December cost estimates from the years 2005, 2015, and 2024 for the family composition identified for the Low and Moderate cost food plans, which represent the second and third quartiles of the income distribution. Estimated costs adjusted to 2024 dollars using the Consumer Price Index for All Urban Consumers (CPI-U) in the Northeast.
- Expenditures for Health Care: Estimates derived using U.S. Bureau of Labor Statistics’ Consumer Expenditure Surveys for the Northeast in 2004-2005, 2014-2015, and 2022-2023. Total “Healthcare” cost was divided by the average number of people in a “consumer unit” and then multiplied by four to represent four people in the hypothetical family. Estimated costs adjusted to 2024 dollars using the Consumer Price Index for All Urban Consumers (CPI-U) in the Northeast.
- Gas: Estimates assume two vehicles per household. Average number of kilometers traveled per vehicle estimated using the U.S. Department of Transportation Federal Highway Administration’s Highway Statistics in 2005, 2015, and 2023 using light duty vehicles with short wheelbases and two axels. Kilometers were converted to miles where necessary. Fuel efficiency in mile per gallon was derived from S. Environment Protection Agency’s Automotive Trends Data using “Real-world MPG” for all vehicles in 2005, 2015, and 2023. Average New England gas prices derived from the U.S. Energy Information Administration’s Weekly Retail Gasoline and Diesel Prices, specifically “New England (PADD 1A) Regular Reformulated Retail Gasoline Prices (Dollars per Gallon)” for 2005, 2015, and 2024. Estimated costs adjusted to 2024 dollars using the Consumer Price Index for All Urban Consumers (CPI-U) in the Northeast.
- Remaining Funds for Other Expenses: Derived by subtracting Mortgage Payment, Child Care, Food, Health Care, and Gas expenditures from median household income. Estimated remaining funds adjusted to 2024 dollars using the Consumer Price Index for All Urban Consumers (CPI-U) in the Northeast.
[2] NHFPI original analysis using the Massachusetts Institute of Technology’s Living Wage Calculator.
[3] See U.S. Census Bureau’s American Community Survey 1-Year Data Table S1901 for median household incomes and New Hampshire Association of Realtors’ Market Data for median-priced single-family home. Mortgage calculations assume a 5 percent downpayment and include the annual median single-family house sale price, taken from the New Hampshire Association of Realtors’ Market Data; the annual average 30-year fixed mortgage rate, taken from the Federal Reserve Bank of St. Louis; the annual average statewide property tax rate, taken from the New Hampshire Department of Revenue Administration and applied to the purchase price; and factors in a five percent downpayment on a house. Mortgage rates are calculated using the Federal Reserve Bank of Dallas, Payment Calculator for Mortgages.
[4] See “Cost Burden” under “Definitions” on the U.S. Department of Housing and Urban Development’s Office of Policy Development and Research webpage.
[5] See End Note 1 for sources and methodology for figures in the “Costs of Basic Living Expenses for a Family of Four in New Hampshire.”
[6] See the Massachusetts Institute of Technology’s Living Wage Calculator and the Economic Policy Institute’s Family Budget Calculator.
[7] Median household income figures derived from the U.S. Census Bureau’s American Community Survey 1-Year Data Table S1901 and American Community Survey 1-Year Data 2005-2024. Inflation adjustments were made using the Consumer Price Index for All Urban Consumers (CPI-U) in the Northeast.
[8] See the U.S. Bureau of Labor Statistics’ Consumer Price Index for All Urban Consumers (CPI-U) in the Northeast for index changes over time and the U.S. Bureau of Labor Statistics’ Handbook of Methods – Consumer Price Index for expenditure category definitions.
[9] See U.S. Bureau of Labor Statistics Databases, Tables and Calculators by Subject. Figures calculated using All Urban Consumers (Current Series) One-Screen Tool searching for U.S. city average and “toys” and “televisions.” Specific indices for items were unavailable for the Northeast region so national estimates were used.
[10] See U.S. Census Bureau American Community Survey 5-Year ACS Data Table S1901 by New Hampshire county. Note: ACS 5-Year data is used for these analyses due to small population sizes of some counties. ACS 1-year primary estimate data are not provided for populations of less than 65,000 people because of data reliability concerns stemming from small sample sizes.
[11] For more information about New Hampshire’s changing demographics, see NHFPI’s August 2024 Issue Brief, New Hampshire’s Growing Population and Changing Demographics Before and Since the COVID-19 Pandemic.
[12] See NHFPI’s September 2025 presentation, Key Economic Trends and Household Financial Well-Being in New Hampshire, slide 6.
[13] See New Hampshire Employment Security’s GraniteStats webpage (used in place of U.S. Census Bureau data which was unavailable due to a partial federal government shutdown during final analyses of this report).
[14] See The Brookings Institution’s article, Diverging Employment Pathways Among Young Adults, and NHFPI’s August 2021 Issue Brief, Greater Investments Key for Students Facing Inequities Across New Hampshire.
[15] Available data for Granite Staters identifying as Native Hawaiian or Pacific Islander may not be reliable due to small sample sizes, but if these data, which are the best available, are correct, then this population was the only group to have a single-digit income growth rate during this period, at about 5 percent.
[16] See the New Hampshire Association of Realtors, Market Data, Year-Over-Year Data.
[17] See the New Hampshire Association of Realtors, Market Data, Monthly Statewide Data, August 2025, page 5. Note that median prices are adjusted overtime to reflect new data. For more information on regional housing costs in 2025, see NHFPI’s August 2025 blog, Housing Prices Level Off in Much of New Hampshire, While Surge Continues in Grafton, Belknap, Carroll, and Cheshire Counties.
[18] For more information on housing constraints in New Hampshire, see NHFPI’s February 2025 blog, Multiple Affordable Housing Barriers Adversely Impact Communities, Adding Housing Expands Tax Base Beyond Key Costs and NHFPI’s February 2024 factsheet, Construction and Homebuilding in New Hampshire.
[19] See the New Hampshire Association of Realtors, Market Data, Year-Over-Year Statewide Data and the Federal Reserve Bank of St. Louis, Median Household Income in New Hampshire. Note that median household income data in this calculation includes statewide data from the U.S. Census Bureau’s Current Population Survey (CPS), different from the American Community Survey (ACS). The ACS provides data dating back to 2005, so the CPS was used for this particular analysis to show price changes from 1999. For inflation adjustments, this comparison employes the U.S. Bureau of Labor Statistics Consumer Price Index-Urban for the Northeastern United States, which includes Connecticut, Maine, Massachusetts, New Hampshire, New Jersey, New York, Pennsylvania, Rhode Island, and Vermont.
[20] Mortgage calculations include the annual median single-family house sale price, taken from the New Hampshire Association of Realtors’ Market Data; the annual average 30-year fixed mortgage rate, taken from the Federal Reserve Bank of St. Louis; the annual average statewide property tax rate, taken from the New Hampshire Department of Revenue Administration; and factors in a five percent downpayment on a house. Mortgage rates are calculated using the Federal Reserve Bank of Dallas, Payment Calculator for Mortgages.
[21] See the U.S. Census Bureau, American Community Survey (ACS), Table S1901, 1-Year Estimates.
[22] See New Hampshire Association of Realtors, Market Data, Year-Over-Year County Data.
[23] For more information on population changes in New Hampshire, see the U.S. Census Bureau, Population Estimates Program, County Population Totals and Components of Change: 2020-2024 and NHFPI’s December 2024 Publication, New Hampshire Policy Points, Second Edition, Population and Demographics.
[24] See the U.S. Census Bureau, American Community Survey, Table S2502, 5-Year Estimates and Population Estimates Program, State Population by Characteristics: 2020-2024.
[25] See the U.S. Census Bureau, American Community Survey, Table S2502, 1-Year Estimates.
[26] This section uses 2023 ACS data because U.S. Census Bureau data was not available due to a federal government shutdown when the analyses were being completed.
[27] See New Hampshire Housing, Residential Rental Cost Survey, Reports for 2024 and 2017.
[28] For more information on the most recent data around housing cost burden, see NHFPI’s September 2025 blog, Latest U.S. Census Bureau Data Show Granite Staters’ Economic Well-Being Remained Steady and Did Not Improve in 2024. For more information on housing cost burden among renters, see NHFPI’s September 2024 blog, New Hampshire Renters Were Cost-Burdened by Housing at Higher Rates than Homeowners in 2023.
[29] See New Hampshire Employment Security, GraniteStats, Statewide Average Private Hourly Wages. For inflation adjustments, this comparison employes the U.S. Bureau of Labor Statistics Consumer Price Index-Urban for the Northeastern United States, which includes Connecticut, Maine, Massachusetts, New Hampshire, New Jersey, New York, Pennsylvania, Rhode Island, and Vermont.
[30] For more information on income differences between renters and homeowners, see NHFPI’s September 2024 blog, New Hampshire Renters Were Cost-Burdened by Housing at Higher Rates than Homeowners in 2023.
[31] See the U.S. Energy Information Administration (EIA), Electric Sales, Revenue, and Average Price, Residential Average Monthly Bill by State, New Hampshire.
[32] See the U.S. Energy Information Administration (EIA), Weekly New Hampshire Heating Oil Residential Price, Averages for January.
[33] See the U.S. Energy Information Administration (EIA), New Hampshire Price of Natural Gas Delivered to Residential Consumers.
[34] Data from the U.S. Bureau of Labor Statistics Consumer Expenditure Surveys by region.
[35] See the U.S. Department of Health and Human Services Health Insurance Marketplace Glossary website.
[36] For historical state-level data through 2020, see the KFF interactive table Health Care Expenditures per Capita by State of Residence. For the New Hampshire Insurance Department’s analysis, see the Annual Report on Health Care Spending – 2024. This report estimates a spend of $9,331 per capita in 2022, which is lower than the KFF and federal data estimate for the 2015 through 2020 period.
[37] See NHFPI’s 2025 New Hampshire Policy Points, the Health chapter, for a detailed breakdown of types of insurance coverage in New Hampshire. For the latest data on health coverage generally, see NHFPI’s September 11, 2025 blog Latest U.S. Census Bureau Data Show Granite Staters’ Economic Well-Being Remained Steady and Did Not Improve in 2024.
[38] Analyses in this paragraph and the subsequent paragraph stem from the U.S. Census Bureau’s measure of median household income, for all household sizes, in the American Community Survey; the U.S. Bureau of Economic Analysis measurement of per capita personal income; the U.S. Agency for Healthcare Research and Quality Medical Expenditure Panel Survey Insurance Component; and the U.S. Bureau of Labor Statistics Consumer Price Index-Urban measures for overall consumer inflation and the cost of medical care for consumers in the Northeastern United States, which includes Connecticut, Maine, Massachusetts, New Hampshire, New Jersey, New York, Pennsylvania, Rhode Island, and Vermont.
[39] For the Manufacturer’s Suggested Retail Price of these vehicles, see the Edmunds webpages 2025 Honda Civic and 2025 Subaru Impreza.
[40] For more analysis of the role increasing deductibles have had in higher health costs in New Hampshire, see the University of New Hampshire Institute for Health Policy and Practice October 17, 2024 presentation Continuing the Quest for Affordable and Equitable Healthcare.
[41] See the University of New Hampshire Institute for Health Policy and Practice February 2025 analysis Covering the Care: Pregnancy Tops the List of Highest Out-Of-Pocket Costs for New Hampshire’s Commercially Insured.
[42] See the Healthcare Value Hub’s November 13, 2024 website New Hampshire Survey Respondents Struggle to Afford High Health Care Costs; Worry about Affording Health Care in the Future; Support Government Action Across Party Lines.
[43] For more information, see the University of New Hampshire’s October 1, 2025 UNH Healthcare Vitals: Health Insurance Premiums Are Skyrocketing for 2026 – Why?
[44] For more information, see the U.S. Department of Health and Human Services Healthy People 2030: Social Determinants of Health webpage, accessed October 2025.
[45] See the NHFPI New Hampshire Policy Points 2025 chapter on Food Insecurity.
[46] For more information, see NHFPI’s September 2024 blog Food Insecurity Continues to Increase Among Granite Staters Since 2021.
[47] This comparison employs the U.S. Bureau of Labor Statistics Consumer Price Index-Urban for the Northeastern United States, which includes Connecticut, Maine, Massachusetts, New Hampshire, New Jersey, New York, Pennsylvania, Rhode Island, and Vermont.
[48] For the baseline data for this analysis, see the U.S. Department of Agriculture’s USDA Food Plans: Monthly Cost of Food Reports, accessed October 8, 2025. This calculation averages June and December cost estimates from the years 2005 and 2024 for the family composition identified for the Low and Moderate cost food plans, which represent the second and third quartiles of the income distribution.
[49] See the Economic Policy Institute’s Family Budget Calculator and the Massachusetts Institute of Technology’s Living Wage Calculator to compare estimated health and medical costs across counties. For differences in income and poverty rates by New Hampshire county and among certain groups, see NHFPI’s December 2024 blog Seven N.H. Takeaways from Recent U.S. Census Data: Income Gains, Poverty Gaps, and Housing Challenges.
[50] See U.S. Census Bureau’s American Community Survey 1-Year Data Table S1901 and Child Care Aware of American (CCAoA) annual price reports for 2010, 2015, and 2024. Data for 2005 was not available as CCAoA did not begin collecting this data until 2010. To estimate an initial price for 2005, the 2010 data was adjusted to 2005 dollars using the national CPI-U for Day care and preschool in U.S. city average, all urban consumers, not seasonally adjusted. Estimated payments from 2005 were adjusted to 2024 dollars using the Consumer Price Index for All Urban Consumers (CPI-U) in the Northeast.
[51] For more information about New Hampshire’s Child Care Scholarship Program, see the New Hampshire Department of Health and Human Services Child Development and Head Start webpage.
[52] Annual average child care prices from 2017 to 2024 were acquired through personal correspondence with Child Care Aware of America and are based on the New Hampshire Child Care Market Rate Survey which is administered every 3 years. Due to inadequate sample size for the 2024 New Hampshire Child Care Market Rate survey and missing school-age child care data for several annual time points, NHFPI used a compound annual growth rate, based on the 2017 to 2021 period, to estimate costs of before and after school care and summer child care for school-aged children for 2017 through 2032. Price of child care expenditures for two children through age 13 assumes 12 weeks of maternity leave for both children during which time child care is not paid, and that each child starts kindergarten after they turn 5-years-old, at which time before and afterschool care and summer child care prices were used in the analysis.
[53] See the New Hampshire Department of Health and Human Services’ Bureau of Adult and Aging Services July 2024 Policy Release. Annual Cost to Nursing Facility Medicaid/ProShare Payments Program Per Enrollee in SFY 2024 derived using the New Hampshire Department of Health and Human Services Operating Statistics Dashboard submitted to the Joint Legislative Fiscal Committee in September 2025 and State Fiscal Year 2024 Actual Expenses reported in the SFYs 2026-2027 Governor’s Operating Budget proposal. Nursing facility Medicaid costs include direct payments to nursing facilities, Medicaid Quality Incentive Program payments, and ProShare payments to county nursing facilities.
[54] NHFPI original analyses using the New Hampshire Department of Health and Human Services Operating Statistics Dashboardsubmitted to the Joint Legislative Fiscal Committee in September 2025 and SFY 2024 Actual Expenses from the SFYs 2026-2027 Governor’s Operating Budget.
[55] NHFPI original analysis using Centers for Medicare and Medicaid Services Market Basket Data, using the New Hampshire Department of Health and Human Services Operating Statistics Dashboard submitted to the Joint Legislative Fiscal Committee in September 2025, and SFY 2024 Actual Expenses from the SFYs 2026-2027 Governor’s Operating Budget.
[56] See NHFPI’s August 2025 Issue Brief, New Hampshire Continues to Be One of the Lowest Funders of Public Higher Education in the Country.
[57] See NHFPI’s November 2023 Issue Brief, Limited State Funding for Public Higher Education Adds to Workforce Constraints.
[58] Figures derived using the National Center for Education Statistics’ Digest of Education Statistics for 1994-1995, 2004-2005,2014-2015, and 2022-2023, and adjusting costs to 2024 dollars using the Consumer Price Index for All Urban Consumers (CPI-U) in the Northeast
[59] The New Hampshire Transit Association documented in 2022 that only 34 communities in the state are served with regular public transit routes. Nearly 80 percent of workers in New Hampshire drove alone or carpooled to get to work in 2024, while less than one percent used public transit, and about 2.4 percent walked. See the New Hampshire Department of Transportation map Public Transit Services dated May 31, 2023, and the New Hampshire Transit Association report Public Transportation in New Hampshire 2022. For more information, see NHFPI’s September 18, 2025 blog Many Granite Staters Continue to Work from Home as Pandemic Impacts Fade.
[60] See the U.S. Energy Information Administration, Petroleum and Other Liquids, Weekly Retail Gasoline and Diesel Prices, New England (PADD 1A), Reformulated Regular Gasoline, Series History.
[61] This comparison employs the U.S. Bureau of Labor Statistics Consumer Price Index-Urban for the Northeastern United States, which includes Connecticut, Maine, Massachusetts, New Hampshire, New Jersey, New York, Pennsylvania, Rhode Island, and Vermont.
[62] See Experian’s Auto Loan analysis from May 11, 2025 The Average Car Price Is Nearing All-Time High.
[63] See the Massachusetts Institute of Technology’s Living Wage Calculator.
[64] See NHFPI’s September 2025 Blog, Latest U.S. Census Bureau Data Show Granite Staters’ Economic Well-Being Remained Steady and Did Not Improve in 2024.
[65] See NHFPI’s August 2025 Issue Brief New Federal Reconciliation Law Reduces Taxes, Health Access, and Food Assistance Supports for Granite Staters and July 2025 Report The State Budget for Fiscal Years 2026 and 2027.
[66] For more information about New Hampshire’s changing demographics, see NHFPI’s August 2024 Issue Brief, New Hampshire’s Growing Population and Changing Demographics Before and Since the COVID-19 Pandemic.