The Granite State is experiencing a long-predicted workforce shortage that is, in part, related to an aging New Hampshire population, and further exacerbated by fewer residents who are employed or looking for employment than were prior to the pandemic.[1] Future workforce constraints in key industries could be disproportionately severe due to a lack of qualified job candidates. State projections suggest some of these shortfalls will occur in industries that typically require college degrees.
While not all in-demand careers in New Hampshire require postsecondary education, four of the ten occupations with the largest projected ten-year growth, and three of the top five, are in fields that require college degrees. These include registered nurses, general and operations managers, accountants and auditors, and software developers. Of the other professions in the top ten, two require some postsecondary credential or training (carpenters and truck drivers), and the remaining positions are in sales and supervisor positions that do not typically require a college degree.[2]
Given the need for workers in jobs that require college degrees, access to, and the affordability of, public higher education for Granite Staters is vital. According to key metrics used for comparison, New Hampshire ranks as one of the lowest funders of public higher education among the fifty U.S states, particularly for four-year institutions.[3] Lower state funding likely contributes to higher in-state tuition for students attending public colleges and universities. Granite Staters may choose to forego a postsecondary degree or attend college out-of-state to reduce costs. Not having a two- or four-year degree may impede future earnings, professional growth, and career advancement, particularly in areas and industries where there are existing workforce shortages in the Granite State.
Graduates from New Hampshire colleges and universities are more likely to have student debt than graduates in other states. Foregoing a postsecondary degree and its impact on earning potential, as well as accumulating high student loan debt, can limit individual and family spending that supports local and State economies. Additionally, individual and family wealth-building may be hindered by delayed readiness to buy a house or save for retirement. Increasing investment in public higher education and developing feasible funding models in collaboration with New Hampshire’s public institutions of higher education would likely make college attendance more affordable for Granite Staters, while providing a steadier pipeline of employees to contribute to the age-diverse workforce that is necessary for healthy economic growth.
This Issue Brief examines New Hampshire’s funding of public higher education, potential returns on investment in this sector, the negative impacts of underfunding, and policy considerations for possible funding models.
State Resources for Two- and Four-Year Public Higher Education
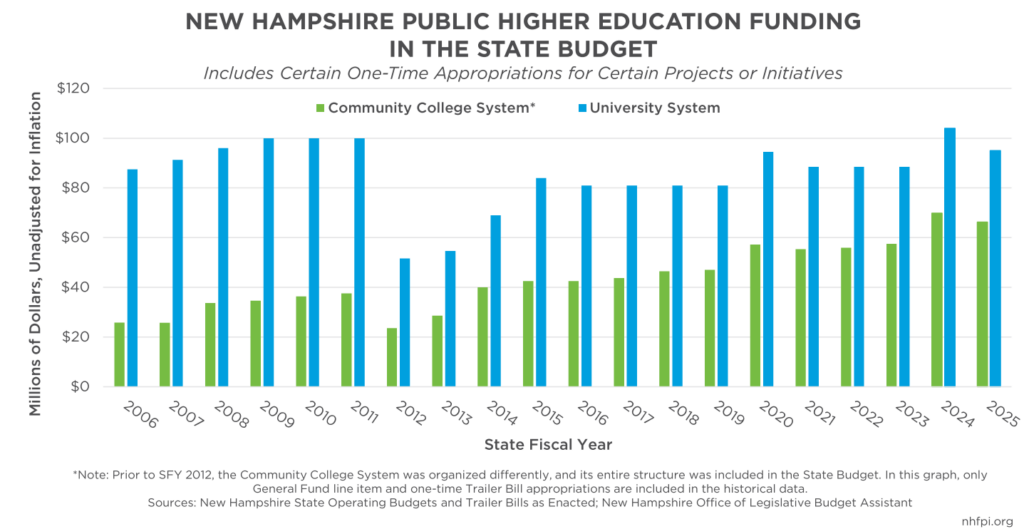
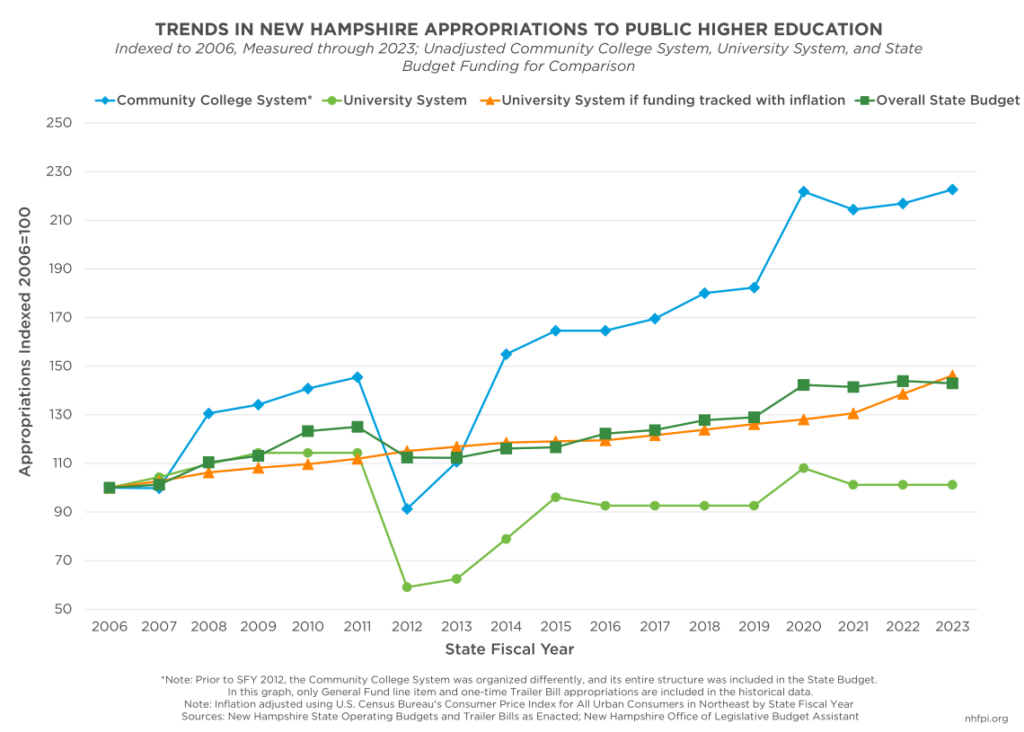
Recent New Hampshire State Budgets have increased funding for public higher education operating budgets following significant reductions in State Fiscal Year (SFY) 2012. State support for the University System of New Hampshire (USNH), which operates the State’s public four-year degree institutions, is at the highest levels since SFY 2011 in the current biennial State Budget.[4] The current State Budget also continued incremental increases in support for the Community College System of New Hampshire (CCSNH), which operates seven public institutions in the state that grant two-year and technical degrees.[5]
In academic year 2021-2022, there were 20,544 students enrolled in New Hampshire’s public two-year institutions while the four-year institutions enrolled 28,094.[6] A “full-time equivalent student” (FTE) measurement can help compare costs and subsidies between institutions serving different percentages of full- and part-time enrolled students. The FTE student metric is calculated by dividing the number of credits all students are taking at an institution by the number of credits needed for a full-time course load.[7] In academic year 2021-2022, New Hampshire’s two-year institutions had 7,080 full-time equivalent (FTE) students, while its four-year institutions had 23,359.[8] Based on FTE calculations, New Hampshire invests more funding into students attending two-year institutions than four-year institutions on a per-enrollee basis.
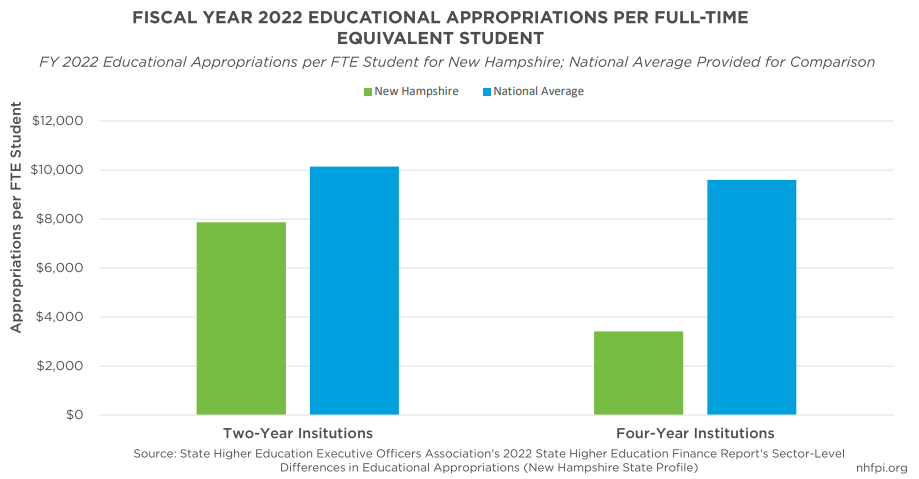
In fiscal year 2022, New Hampshire provided more financial aid per FTE student to the Community College System ($421) than the University System ($50); however, the USNH received more total funding ($88.5 million) than the CCSNH ($56 million) in SFY 2022.[9] Additionally, the educational appropriation per FTE was $7,872 at two-year institutions and $3,422 at four-year institutions in New Hampshire in 2022.[10] Nationally, the average appropriation per FTE in 2022 was higher than New Hampshire’s average and more consistent between institution types; the national average per FTE was 28.8 percent higher, at $10,141, for two-year institutions, and over one and half times higher (180.4 percent) for four-year institutions at $9,596.[11]
The most recent SFYs 2024-2025 budget provides the highest dollar amount of support to CCSNH relative to historical budgets. In this current budget, the State provides targeted appropriations toward CCSNH partnership programs with high schools; workforce credential programs that provide individuals with evidence of competencies in particular fields that do not require degree completion; funds toward recruitment, retention, and development of first responders; and the Promise Program, which ensures education at New Hampshire’s community colleges is affordable and accessible to Granite Staters.[12]
The current State Budget, SFYs 2024-2025, also increases funding for USNH from the SFYs 2022-2023 State Budget levels by $22 million to a total of $199 million. The current budget appropriates $190 million to the USNH with two additional, specific appropriations that include $6 million toward renovations of the University of New Hampshire’s Whittemore Center Arena, and $3 million specifically designated for Keene State College and Plymouth State University that policymakers intended to be matched with other USNH internal funds.
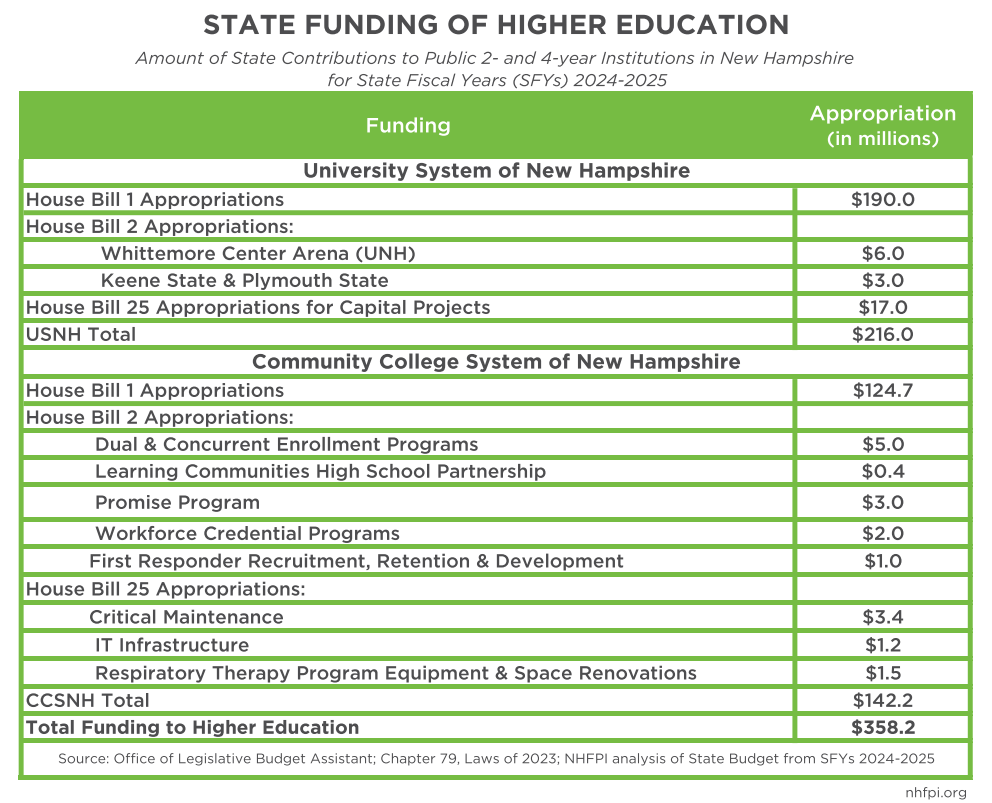
The table above also includes appropriations from House Bill 25, which supports capital projects involving maintenance, infrastructure, and renovation work for the colleges and universities.[13] Because these funds are not used as part of the college and university operating budgets, they do not directly offset tuition costs or contribute to student financial aid. Additionally, state agencies fiscally interact with higher education systems through unique State and Federal funding programs. For example, in June 2023, the University of New Hampshire’s College of Professional Studies (formally Granite State College) received $600,000 of State-approved Federal funds to provide tuition assistance to child care staff taking relevant coursework at participating institutions of higher education in SFYs 2024-2025.[14] These funds are not appropriated from the State Budget to New Hampshire’s institutes of higher education, but the funds are administered through a contract generated by a state agency.
New Hampshire State Public Higher Education Funding Lowest in Country
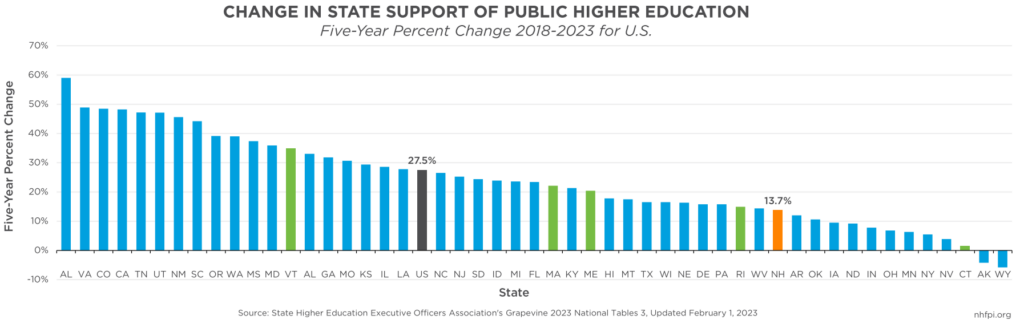
The funding changes in recent New Hampshire State Budgets, including past one-time appropriations and enhanced operating grants, have increased State funding for public higher education relative to the low levels in the years immediately following the Great Recession of 2007-2009.[15] Data collected by Illinois State University and the State Higher Education Executive Officers Association (SHEEOA) estimated a 13.7 percent increase in State financial support for public higher education in New Hampshire between fiscal years 2018 and 2023; however, this increase trailed the aggregate fifty states funding increase average of 27.5 percent.[16]
For nearly a decade, CCSNH funding has tracked with, and in some cases outpaced, inflation; however, State support for USNH has lagged behind inflation. To keep pace with inflation since 2006, USNH would have needed to receive approximately $128 million in State appropriations in SFY 2023, over $39 million more than what was appropriated.
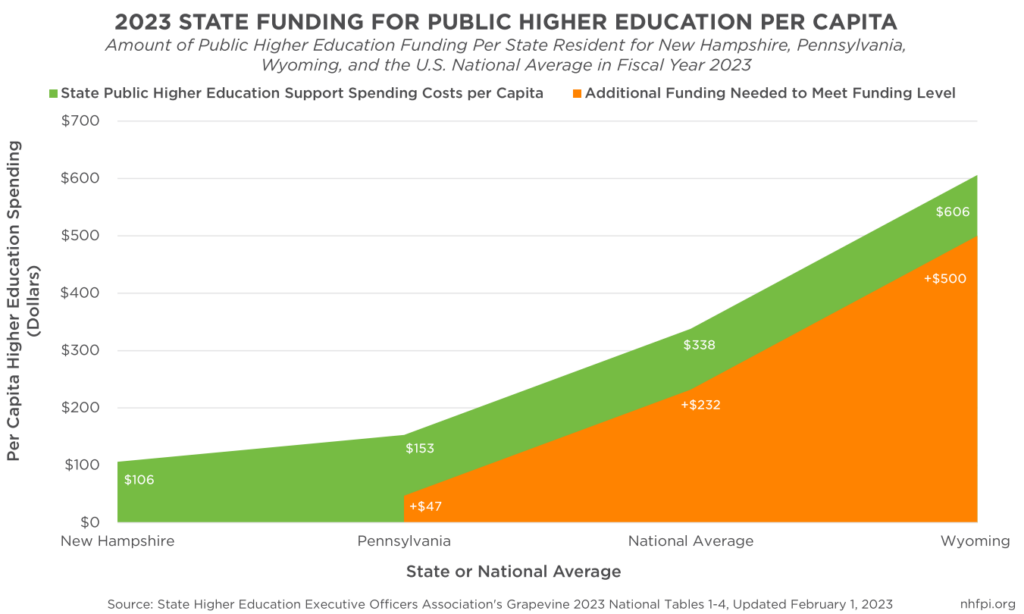
SHEEOA estimates indicated that New Hampshire fell behind all other states in three key metrics for funding of public higher education. The first measure is relative to state populations. For every person in New Hampshire, the State budgeted $106 for public higher education in fiscal year 2023.[17] This value was the lowest amount of any state, with Pennsylvania being the next-lowest funder of public higher education that year at $153 per capita. Nationwide, state government support for public higher education averaged $338 per capita. To fund public higher education in New Hampshire at the same rate as the national per capita average, New Hampshire would need to increase funding by $232 per capita, over three-fold the current per capita levels, resulting in a total higher education appropriation of more than $464 million, approximately $318 million higher than what was appropriated in 2023.[18]
The second key metric compares funds appropriated to public higher education per $1,000 of personal income. This metric provides insight into a state’s ability to pay for higher education by dividing total state and local support for higher education by pre-tax income, including from employment and asset-based sources, earned by all residents in a state.[19] New Hampshire appropriated $1.43 per $1,000 in income.[20] This level indicates that, for a New Hampshire household earning the median income of $89,992 in 2022 (the most recent estimate), $128.69 would go toward funding public higher education.[21] The national average was $5.22 per $1,000 of personal income.
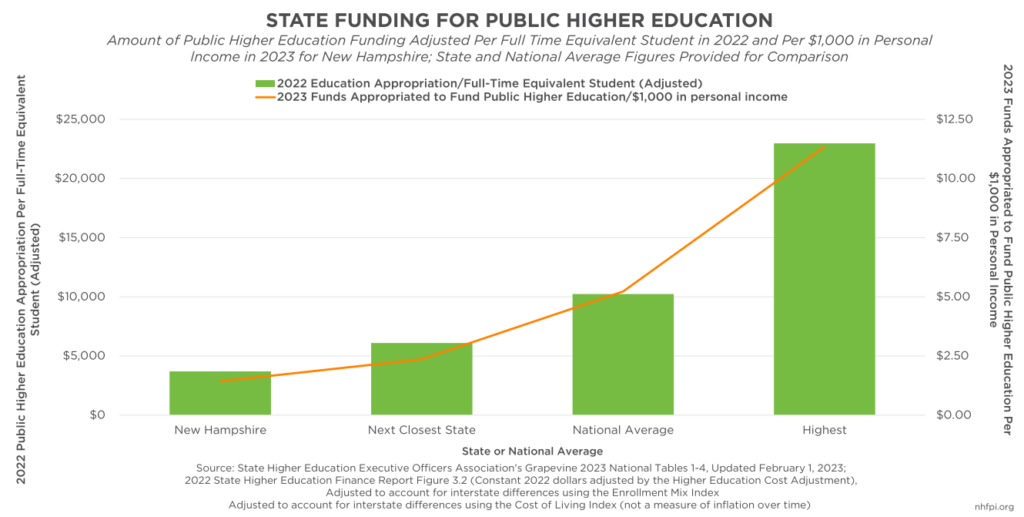
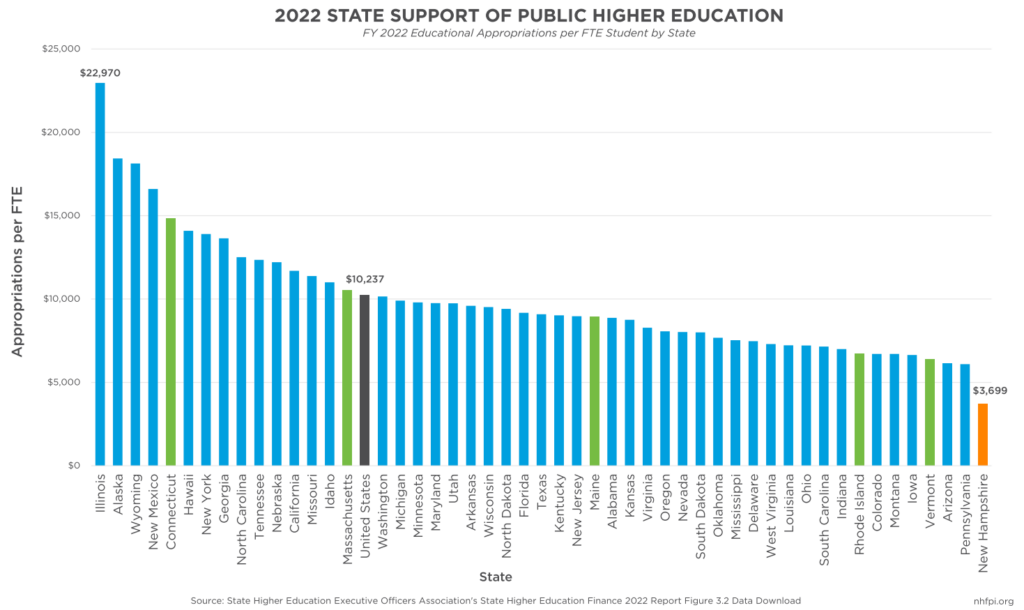
The third comparative funding metric calculated by SHEEOA is the amount of money appropriated per FTE student enrolled at a public institution of higher education. New Hampshire appropriated the lowest amount of all fifty states in fiscal year 2022, the most recent estimate available, with $3,699 per FTE.[22] Illinois had the highest appropriation among all fifty states, at $22,970 per FTE. The national average was $10,237.
Limited State Funding Increases Costs for Granite State Students
Without State support to offset costs, colleges and universities must rely on tuition dollars and fees to supplement annual operating budgets. New Hampshire’s public institutions relied heavily on student tuition payments for revenue (72 percent of all revenue was from tuition) compared to the national average of student contributions (42 percent).[23] Within the State, students at two-year institutions paid 42 percent of CCSNH revenues, while students at four-year institutions paid 80 percent of the USNH’s revenues.[24]
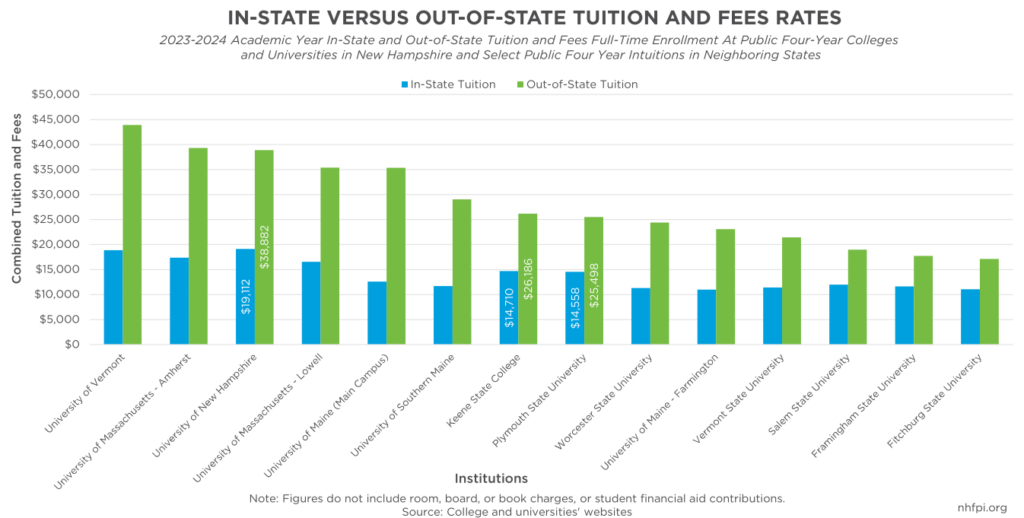
In the 2023-2024 academic year, New Hampshire’s public four-year institutions had the highest in-state tuition and fees rates among neighboring states. Combined tuition and fees ranged from $14,558 at Plymouth State University to $19,112 at the University of New Hampshire’s main campus in Durham. Public four-year institutions in neighboring states had in-state tuition and fees that ranged between $11,046 at Fitchburg State University to $18,890 at the University of Vermont. New Hampshire’s four-year institutions also have some of the highest out-of-state tuition rates among public colleges and universities in New England, making recruitment of students challenging in the highly competitive Northeastern U.S. higher education market, where key research suggests demographic changes are expected to result in an enrollment cliff for postsecondary institutions beginning around 2025.[25]
When students are eligible to use the New England Board of Higher Education’s (NEBHE) “Tuition Break” program, particularly the Flexible Policy, cost of in-state tuition for Granite State residents at New Hampshire’s four-year public colleges and universities is comparable to many public colleges and universities in neighboring states. This program offers discounts to New England students who pursue a degree outside their home state at a New England institution of higher education.[26] Originally, the program was developed for New England students pursuing majors unavailable at institutions of higher education in the states in which they resided; however, the Flexible Programs Policy was approved in 2018 and allows participating four-year institutions to offer any major at a NEBHE discounted rate for New England students.[27] The Flexible Policy has been in place for community colleges since 1975.
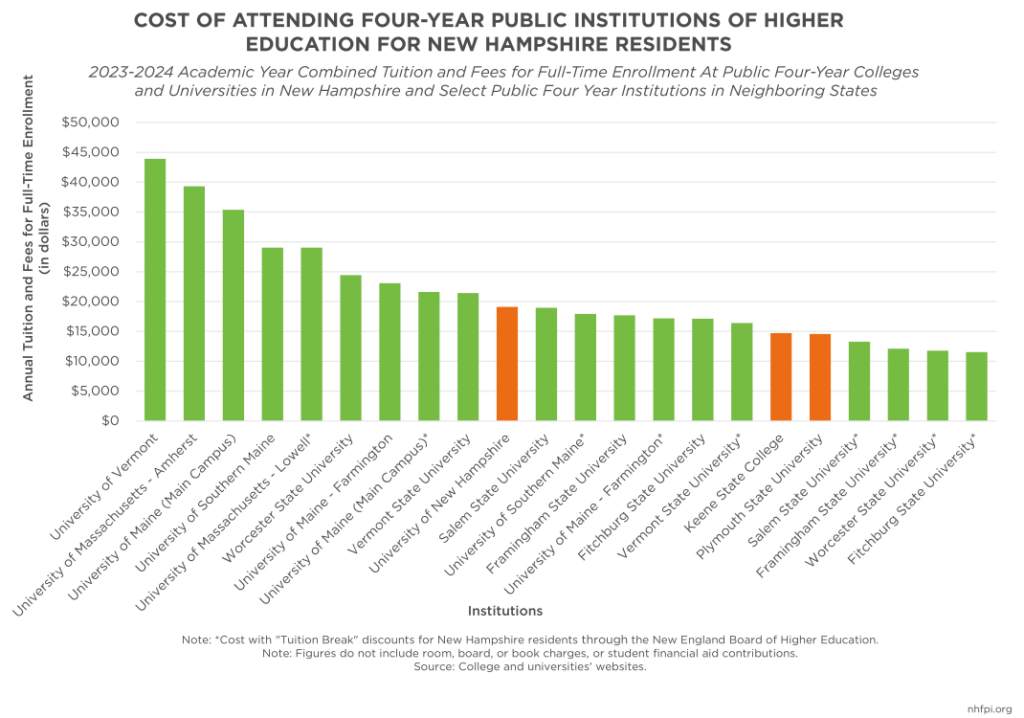
The NEBHE’s 2021-2022 Tuition Break Regional Student Program Annual Report notes that 9,101 students enrolled in academic programs through the Tuition Break program, and that full-time students participating in the program saved, on average, $8,600 in tuition.[28] While New Hampshire institutions participate in the Tuition Break program, over 1,000 more students left the Granite State as part of the Tuition Break program than attended a New Hampshire institution of higher education from other states as part of the program.[29] As an example of the Tuition Break program’s cost savings, for the 2023-2024 academic year, a Granite State student could attend the University of New Hampshire’s main campus as an in-state student to study Computer Science and pay $19,112 in tuition and fees or, through the Tuition Break Flexible Policy, enroll in the same program at the University of Southern Maine for $17,940.[30]
In contrast to four-year institutions, the 2023-2024 tuition at New Hampshire’s community colleges is $215 per credit hour, which equates to $6,450 for a standard full-time (30-credit hour) course load.[31] Some CCSNH colleges charge a $100 tuition deposit, as well as fees per credit hour ranging from $9 to $25, meaning the most an in-state resident would pay in standard tuition and fees at a CCSNH institution would be $7,300.[32] This amount is approximately half of the in-state tuition and fee rates of New Hampshire’s two smaller four-year institutions, Keene State College ($14,710) and Plymouth State University ($14,558). Higher levels of State funding for CCSNH relative to USNH may be helping to reduce the cost barriers for students seeking postsecondary education in New Hampshire.
Cost of tuition and financial aid packages are often ranked as two of the most important factors that are considered as part of the college decision-making process. In 2022, when a sample of students at two-and four-year institutions were asked about aspects that influenced their college-selection decision, the top reasons endorsed were major or program of interest offered (65 percent), academic reputation (56 percent), proximity to home (53 percent), quality of academic programs (49 percent), cost of tuition (46 percent), and financial aid packages/scholarships (45 percent). When asked to identify the two most important factors, 33 percent of the sample endorsed proximity to home, 29 percent noted the offering of their major or program of interest, and 27 percent identified cost of tuition.[33] While cost of attending college is not the only aspect of higher education students and their families consider when choosing a school, it appears to be an important part of many decision-making processes.
Beyond factors related to cost, young adults in the Granite State may not consider New Hampshire’s institutions to have unique value when compared to colleges in other states. According to the New Hampshire Quality of Life 2023 survey, about 58 percent of respondents from ages 20 to 25 years, the youngest age category, reported colleges in New Hampshire were “about the same” as colleges in other places, and approximately one in ten said New Hampshire’s offerings were “somewhat worse” in quality.[34] If the youngest adult residents of New Hampshire see their in-state institutions of higher education to be comparable, but more expensive, than other colleges, they may be more likely to leave the state to pursue their higher education.
Consequences of Low State Funding of Public Higher Education
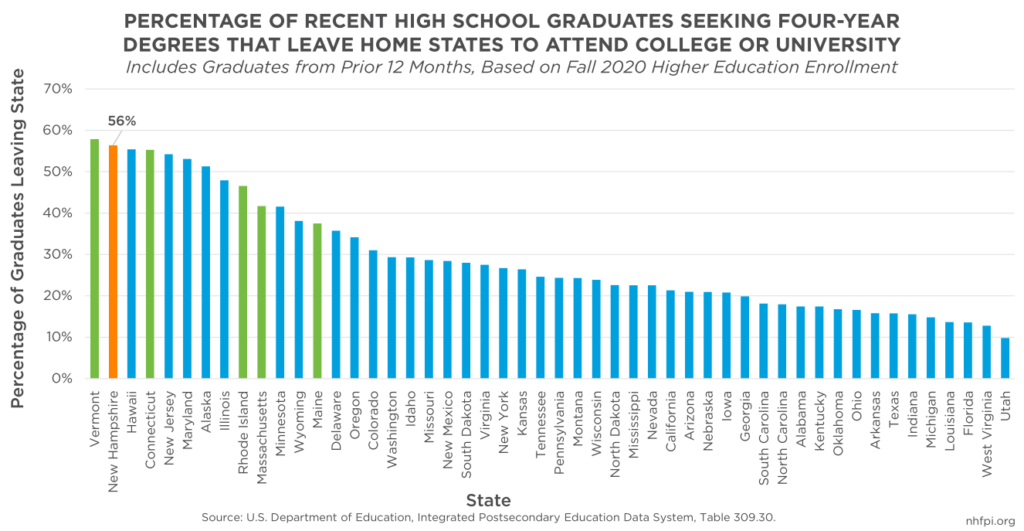
Low state funding may contribute to young Granite Staters leaving the state to pursue higher education opportunities. While the University System of New Hampshire notes in its 2023 Annual Financial Report that over 11,000 out-of-state students enroll in New Hampshire’s four-year public colleges and universities every year, in 2020, the most recently available data from the U.S. Department of Education revealed that 56 percent of New Hampshire high school graduates seeking four-year degrees left the state for their education.[35] The Granite State is second only to Vermont on this metric. While Vermont, like New Hampshire, is a geographically small state, it also has relatively low levels of state funding for public higher education. Maine had the lowest rate, 38 percent, of high school graduates bound for four-year colleges attending out-of-state institutions in New England. In 2020, Maine appropriated $7,838 per FTE student enrolled at a four-year institution compared to New Hampshire’s $2,494.[36]
To match Maine’s funding levels in that year, New Hampshire would have needed to appropriate a total of approximately $201 million toward four-year public higher education, or about $106 million more than what was appropriated in 2020. If this additional investment had allowed New Hampshire to match Maine’s rate of retaining four-year college-bound students within the state, then New Hampshire would have retained 1,329 more high school graduates in 2020 who may have subsequently been more likely to join the Granite State’s workforce. Using National Center for Education Statistics data from 2010 to 2020 and applying Maine’s rate of retention to the total number of New Hampshire first-year students attending college, New Hampshire had the potential to retain 14,692 workers over the course of the decade. For context, approximately 15,600 fewer Granite Staters, on average, were in the labor force during the first eight months of 2023, than during pre-pandemic 2019.[37]
Low state funding of public two-year, four-year, and graduate institutions may also contribute to more people foregoing a college degree due to cost, resulting in a state population that may not be equipped to meet the projected workforce needs in the Granite State. According to Projections Central, the Projections Management Partnership for state employment forecasts sponsored by the U.S. Department of Labor, over the next ten years, New Hampshire will need individuals with college degrees to fulfill in-demand positions like registered nurses and nurse practitioners, software developers, accountants, financial and investment analysts, education administrators, K-12 teachers, mental health counselors, and logisticians.[38]
Making college degrees more affordable in New Hampshire for both in-state and out-of-state students may be a key component to addressing current and future workforce constraints. There is some evidence to suggest that students who attend public four-year institutions in New Hampshire remain in the state to work. According to a 2023 report from the USNH, students are more than twice as likely to stay and join New Hampshire’s workforce when they attend a four-year, in-state public college or university and participate in an internship program. Additionally, the report notes that more than 2,000 USNH graduates go into the Granite State workforce every year.[39]
Young Granite Staters who want to remain in or move back to New Hampshire after completing their degrees may face difficulty affording living expenses, particularly in the housing and child care sectors. New Hampshire’s 2023 Quality of Life Survey, conducted by Stay Work Play New Hampshire, revealed that 53 percent of Granite Staters between 20 and 40 years old reported affordable housing was worse in New Hampshire than in other states, and 36 percent reported access to child care was worse in the Granite State than in other places.[40] With an aging population, New Hampshire risks losing components of the robust, age-diversified workforce that helps enable strong economic growth and enhanced well-being of the state.
Low state funding for public higher education may also contribute to higher student loan debt. The 2020 Institute for College Access and Success report, which is the most recently published to date, found graduates from New Hampshire’s colleges and universities who have higher education loan debt carry the highest average debt, at $39,950, compared to all other graduates in the country. Additionally, New Hampshire ranks second for the highest percentage of graduates (70 percent) with student debt.[41] Student debt burden is not equally distributed across racial and ethnic groups. A 2022 national report from the Institute of Education Sciences revealed that Black graduates with federal loans owed, on average, 105 percent of the original amount borrowed four years after graduation, compared to approximately 73 percent owed by white, non-Hispanic or Latino graduates during the same period. American Indian or Alaska Native graduates owed approximately 87 percent, Asian graduates owed 63 percent, Hispanic or Latino (any race) graduates owed 84 percent, Native Hawaiian or Other Pacific Islander graduates owed 82 percent, and graduates identifying as two or more races owed 84 percent.[42]
In addition to the individual financial ramifications, academic research suggests that higher student debt is related to a variety of factors that directly and indirectly influence state and local economies. These factors include lower rates of homeownership, more demand on the rental market resulting in increased prices for rent, and poorer health-related decisions such as increased smoking and drinking, as well as insufficient sleep, that contribute to later health problems.[43]
Cost Savings and Revenue Generation from Funding Higher Education
Investment in public higher education results in a variety of long-term, cost-saving benefits such as decreased crime levels and reduced use of economic support programs, including food stamps, Medicaid, and unemployment compensation.[44] These benefits may be related to the relationship between educational attainment, higher incomes, and the likelihood of being hired into professions that typically offer employer-sponsored health care programs and retirement contributions.
Nationally, incomes twenty years after earning an associate degree were particularly strong for individuals in fields related to health, technology, construction, and engineering.[45] According to a 2020 National Bureau of Economic Research working paper examining public higher education in Georgia, completing a bachelor’s degree at a four-year public college in the University System of Georgia increased an individual’s income at age 30 by about 20 percent, depending on the degree field; young people from low-income high schools saw an income increase of approximately 40 percent.[46]
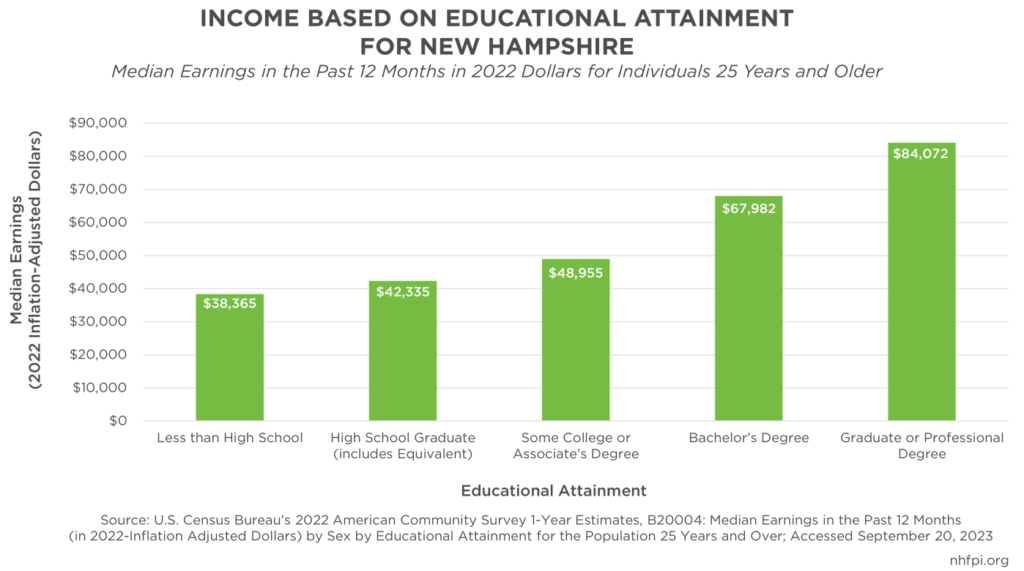
In 2022, the median earnings nationally for individuals over age 25 who completed some college without a degree was $45,830, compared to $40,500 for those who completed high school (including those who completed GEDs).[47] Incomes steadily increased with educational attainment as individuals with associate or bachelor’s degrees earned $49,860 or $67,260, respectively. In New Hampshire, an individual completing some college or an associate degree earned $48,955 according to the U.S. Census Bureau’s 2022 estimates, approximately $6,600 more per year than a high school graduate, while an individual who had a bachelor’s degree earned about $25,600 more per year. [48]
In 2022, the percentage of people living in poverty in New Hampshire was smaller for groups with more formal educational attainment when compared to those with less. For individuals with less than a high school degree, 17.6 percent earned below the poverty rate. Among individuals with some college or an associate degree, 7.4 percent earned below the poverty rate, compared to 2.8 percent of those with a bachelor’s degree.[49] National data showed that, as educational attainment increased, use of key public benefit programs decreased, including use of Medicaid; the Supplemental Nutrition Assistance Program; the Women, Infants, and Children Nutrition Program; free or reduced-priced school meals; and Temporary Assistance for Needy Families.[50]
Educational attainment, however, does not guarantee equally increased earnings across all racial and ethnic backgrounds or genders. Nationally in 2022, men who completed a bachelor’s degree earned a median income of approximately $85,000 annually, while women with the same education level earned about $65,000.[51] White and Asian women with bachelor’s degrees earned approximately $65,500 and $72,500, respectively, in 2022 compared to around $56,000 earned by Black women and $58,000 by Hispanic women, earnings similar to the median for all men with some college or an associate degree, regardless of race (approximately $58,000 annually).[52] Additionally, authors of a 2019 paper published by the Federal Reserve Bank of St. Louis reported that the college wealth premium, which considers individuals’ savings, assets, and debts, instead of income alone, is at an all-time low for white college graduates born in the 1980s and close to zero for all other racial and ethnic group graduates in that age cohort.[53]
State investment in higher education can help offset initial tuition costs for New Hampshire students, bringing down the overall cost of college resulting in a reduced reliance on loans. This cost reduction could help younger generations of college graduates, particularly graduates of color, build wealth and incentivize high school students to pursue in-demand careers that require four-year degrees. While there are potentially lucrative trade careers that require some postsecondary training and not a college degree, heavy and tractor-trailer truck drivers and carpenters are the only trade careers in the top ten highest projected job openings in New Hampshire through 2032; occupations typically requiring a postsecondary degree occupy three of the top five spots and four of the top ten, suggesting there may be more demand, and potentially unmet demand, for workers in careers requiring a college degree in the Granite State over the next decade.[54]
Funding public higher education can create robust returns on investment for a state over the course of an individual’s lifetime. A 2008 Federal Reserve Bank of Boston analysis estimated that the net state government revenue collected per four-year degree in New Hampshire was $56,000 over the course of an individual’s lifetime.[55] Adjusted for inflation to the first half of 2023, that equates to roughly $76,600 per four-year degree.[56] Higher long-term resident earnings benefit state and local economies through tax revenues and reduced reliance on public services. State funding for public higher education keeps student debt down, which makes car or home ownership more feasible.[57] Having a bachelor’s degree is also associated with better health behaviors, including reduced incidents of binge drinking and smoking, less fast-food consumption and obesity, and higher rates of physical activity.[58] Better health outcomes and behaviors can help to lower health care costs for everyone, further contributing to cost-savings and returns on investment for a state.
Policy Considerations
The State Budget currently invests in initiatives through the CCSNH to address acute workforce shortages by appropriating funds toward programs devoted to first responder training, workforce credentialling, and the Promise Program. Similar strategic State funding toward USNH may bolster support for occupations projected to be in-demand in the short- and long-term that require bachelor- and graduate-level degrees.[59] Such funding may enhance and expand programs currently receiving federal resources, such as the ApprenticeshipNH program operated through CCSNH.[60]
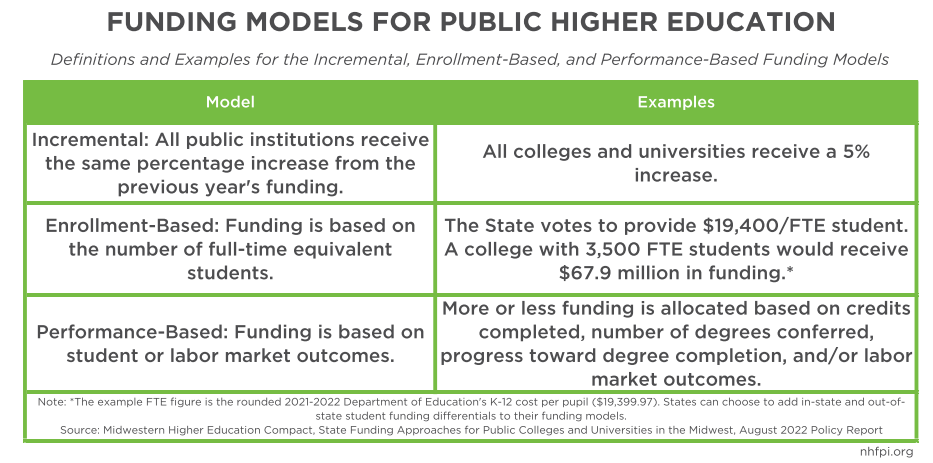
State governments across the U.S. have adopted a variety of funding model approaches to public higher education that strive for adequate and equitable funding across public college campuses. Simple models include 1) incremental approaches that provide the same percentage increase in funding for all institutions without accounting for student enrollment, 2) enrollment-based models that fund institutions based on the number of full-time equivalent students attending the institution, and 3) performance-based funding that requires public colleges and universities to meet predetermined accountability metrics to receive funding.[61]
Another approach is to combine strategies to create hybrid funding models that take into consideration system-wide enrollment, performance, prior-year enrollment funding, or a combination of these factors to determine appropriations.[62] Because the effectiveness of hybrid funding models is related to a variety of factors, particularly the performance-based components, policymakers must carefully consider how performance is defined, especially for institutions serving groups traditionally underrepresented in higher education, like students of color, first-generation college students, and students from families with low-incomes.[63] Additionally, due to the COVID-19 pandemic’s impacts on student learning, institutions of higher education should work closely with policymakers to determine the costs of additional supports that are necessary to assist with student learning, including funding to support student mental health, motivation, and academic initiatives.[64]
A not-for-profit research group, ITHAKA S+R, examines changes in “academic and cultural communities” and summarizes a variety of funding approaches, recommending states consider adopting funding models from other sectors like K-12, health care, and international higher education in other industrialized countries.[65] One example provided by this group identifies that states can work with higher education leadership to develop funding models for each public campus that is determined by meeting collaboratively developed standards. By collaborating with educational leadership, policymakers can help ensure that standards achieve goals for both the educational institution, as well as the state, in order to receive funding increases. ITHAKA S+R researchers recommend that state and higher education leadership should help ensure the greatest amount of state and federal funding goes to campuses and students with the most pronounced needs, based on student demographics. These researchers discourage withdrawal of funds from underperforming institutions, and instead recommend that states work with institutions to develop data-driven continuous improvement plans to ensure the institutions meet their goals and serve the public.[66]
Policy considerations may be discussed as part of a newly formed higher education task force. On October 26, 2023, New Hampshire’s Governor signed an executive order forming the Public Higher Education Task Force to Study the Strategic Alignment of Public Higher Education in New Hampshire.[67] The order noted the important roles of New Hampshire’s institutions of higher education, including training the State’s workforce, as well as declining revenues at both USNH and CCSNH. Part of the Task Force’s role will be to help Granite Staters increase their educational attainment, particularly to address workforce demands, while also reducing redundancies among programs and administrative offices to reduce overall costs.
Conclussion
Educating Granite Staters and keeping young people in New Hampshire is vital for building a pipeline of potential workers to in-demand careers and for helping ensure a robust, age-diverse labor force. Currently, New Hampshire high school students seeking four-year programs are leaving to earn their degrees in other states at one of the highest rates in the country. Those who have recently attended college or university in New Hampshire have graduated with some of the highest average student loan debt in the country, limiting wealth-building among these Granite Staters. By increasing State funding and considering use of thoughtfully crafted financial models developed in collaboration with public higher education institutions, New Hampshire could proactively create pathways to in-demand careers in the State’s labor force that require both two- and four-year degrees using resources and systems that are already in place. These steps could incentivize more New Hampshire residents to obtain a postsecondary degree in the state, both improving individual wealth by reducing reliance on student loans and creating positive returns on investment for the Granite State.
Endnotes
[1] See New Hampshire Fiscal Policy Institute’s August 2023 Issue Brief Granite State Workers and Employers Face Rising Costs and Significant Economic Constraints, under the heading “New Hampshire’s Recovery Slowed by Workforce Constraints.” See the Carsey Institute’s 2012 publication, New Hampshire Demographic Trends in the Twenty-First Century, and the NH Center for Public Policy Studies 2017 archived post, NH Economic Outlook 2018, more information about on-going demographic trends in New Hampshire.
[2] See the New Hampshire Department of Business and Economic Affairs’ State of New Hampshire Workforce Assessment from August 2022, Updated April 2023 (used to determine number of projected job openings), and New Hampshire Employment Security’s New Hampshire Employment Projections by Industry and Occupation: Base Year 2020 to Projected Year 2030 report from January 2022 (used to confirm necessary educational attainment and training for occupations).
[3] See State Higher Education Executive Officers Association’s Public Higher Education State Financial Aid per FTE by State, FY2022 (Adjusted).
[4] To read more about the General Fund, see the NHFPI’s April 2023 post New Hampshire Policy Points: How We Fund Public Services. For more information about USNH, which includes the University of New Hampshire – Durham, the University of New Hampshire School of Law, the University of New Hampshire at Manchester, the University of New Hampshire College of Professional Studies (formally Granite State College), Plymouth State University, and Keene State College, see the University System of New Hampshire website’s About page. Read more about the SFY 2024-2025 budget in NHFPI’s June 2023 post, Senate Modifies State Budget Proposal, House Concurs with Senate Changes and Sends Budget to Governor.
[5] For more information about CCSNH, which includes Great Bay Community College, Lakes Region Community College, Manchester Community College, Nashua Community College, NHTI-Concord’s Community College, River Valley Community College, and White Mountains Community College, see the Community College System of New Hampshire’s website’s About page.
[6] See the National Center for Education Statistics Trend Generator, Question “ Student Enrollment: How many students enroll in postsecondary institutions annually? Results generated for New Hampshire’s public four-year and public two-year institutions.
[7] See State Higher Education Executive Officers Association’s State Higher Education Finance Report’s Data Definition for “Net full-time equivalent (FTE) Enrollment.”
[8] See the National Center for Education Statistics Trend Generator, Question “Student Enrollment: How many full-time equivalent students enroll in postsecondary institutions annually?” Results generated for New Hampshire’s public four-year and public two-year institutions. Accessed November 2023.
[9] See the State Higher Education Executive Officers Association’s Public Higher Education State Financial Aid per FTE by State, FY 2022 (Adjusted) and the New Hampshire Fiscal Policy Institute’s August 2021 Issue Brief: The State Budget for Fiscal Years 2022-2023.
[10] See the State Higher Education Executive Officers Association’s Percent Difference in Two-Year and Four-Year Public Higher Education Appropriations per FTE by State, FY2022.
[11] See the State Higher Education Executive Officers Association’s State Higher Education Finance Report’s Sector-Level Differences in Educational Appropriations (New Hampshire State Profile). Accessed November 2023.
[12] For more information on targeted State Budget appropriations to CCSNH, see Chapter 79, Laws of 2023.
[13] For more information about the New Hampshire’s Capital Budget, please see NHFPI’s 2017 publication, Building the Budget: New Hampshire’s State Budget Process and Recent Funding Trends, p. 6.
[14] See the Governor & Executive Council’s June 28, 2023 Regular Agenda Item #18. For more information about the Early Childhood Tuition Assistance Grant, see the University of New Hampshire College of Professional Studies or the CCSNH webpages.
[15] For more information on historical higher education funding trends, see NHFPI’s November 2019 publication New Hampshire Trails in Higher Education Funding. For more information on the 2007-2009 Great Recession, see the National Bureau of Economic Research’s September 2010 publication Business Cycle Dating Committee Announcement September 20, 2010.
[16] See the State Higher Education Executive Officers Association’s State Higher Education Finance report Grapevine 2023 National Table 2.
[17] See the State Higher Education Executive Officers Association’s State Higher Education Finance report Grapevine 2023 National Table 3.
[18] Figure calculated using U.S. Census Bureau’s 2021 American Community Survey Total Population 5-Year Estimate (B01003).
[19] For more information about the State Higher Education Executive Officers Association’s State Higher Education Finance Report methodology, see their Data Definitions webpage.
[20] See the State Higher Education Executive Officers Association’s State Higher Education Finance report Grapevine 2023 National Table 3.
[21] See U.S. Census Bureau’s 2022 American Community Survey 1-year estimate of Income in the Past 12 Months (in 2022 Inflation-Adjusted Dollars) Table S1901.
[22] See the State Higher Education Executive Officers Association’s State Higher Education Finance report Public Higher Education Appropriations per FTE by State, FY 2022 (Adjusted).
[23] See the State Higher Education Executive Officers Association’s State Higher Education Finance Net Tuition Revenue.
[24] See the State Higher Education Executive Officers Association’s State Higher Education Finance Net Tuition Revenue.
[25] For undergraduate tuition and fees of referenced institutions of higher education, see the following websites: University of Vermont, University of Massachusetts – Amherst, University of New Hampshire, University of Massachusetts – Lowell, University of Maine-Orono, University of Southern Maine, Keene State College, Plymouth State University, Worcester State University, University of Maine-Farmington, Vermont State University, Salem State University, Framingham State University, Fitchburg State University. For more information on the anticipated enrollment cliff, see the Trellis Company June 2023 report, Navigating the Enrollment Cliff in Higher Education.
[26] For more information, see the New England Board of Higher Education’s Tuition Break webpage, accessed August 2023.
[27] See the New England Board of Higher Education’s Regional Student Program, Tuition Break document.
[28] See the New England Board of Higher Education’s 2021-2022 Tuition Break Regional Student Program Annual Report.
[29] See the New England Board of Higher Education’s 2021-2022 Tuition Break Regional Student Program Annual Report.
[30] For more information about programs available at New England higher education institutions participating in the Tuition Break program, see theNEBHE’s Bachelor’s Degree Programs for Residents of New Hampshire document.
[31] See CCSNH’s Tuition and Fees webpage, accessed August 2023.
[32] See CCSNH’s Tuition and Fees Supplement, access November 2023.
[33] See Inside Higher Ed and College Pulse’s 2022 Student Voice survey.
[34] See Stay Work Play’s 2023 New Hampshire Quality of Life Survey, pgs. 12, 70, and 71.
[35] See the University System of New Hampshire’s 2023 Annual Financial Report, p. 36. See the National Center for Education Statics Digest of Education Statistics Table 309.30 Residence and migration of all first-time degree/certificate-seeking undergraduates in 4-year degree-granting postsecondary institutions who graduated from high school in the previous 12 months, by state or jurisdiction: Fall 2020.
[36] See State Higher Education Executive Officers Association’s State Higher Education Finance Report FY2020 Table 3.2A Public Higher Education Appropriations Per FTE by Sector and State FY 2019-2020 (Constant Adjusted Dollars).
[37] Figure calculated using National Center for Education Statistics Digest of Educational Statistics Table 234 in 2010 and Table 309.30 for all other years. Because the Digest is only released every two years, numbers were imputed for years 2019, 2017, 2015, 2013, and 2011 using averages from preceding and proceeding years for number of state residents enrolled in institutions and the migration of students out of state for college. The number of workers in the labor force in 2019 compared to 2023 was generated from New Hampshire Employment Security’s Granite Stats Portal, Unemployment Rate and Labor Force, accessed October 2, 2023.
[38] Short- and long-term state employment projections can be found at Projections Central, the Projection Managing Partnership sponsored by the U.S. Department of Labor. The data presented in this Issue Brief were accessed during August 2023.
[39] See the University System of New Hampshire’s 2023 Annual Financial Report, p. 36.
[40] See Stay Work Play New Hampshire’s Quality of Life Survey 2023 report, p. 33 and p. 37.
[41] See The Institute for College Access and Success’ Student Debt and the Class of 2020 (November 2021) Table 3: Percentage of Graduates with Debt and Average Debt of Those with Loans, By State.
[42] See the Institute of Education Sciences’ 2022 report, Baccalaureate and Beyond (B&B:16/20), p. 19.
[43] See the 2021 peer-reviewed article, Does Student Loan Debt Hinder Community Well-Being? In the International Journal of Community Wellbeing.
[44] See the 2021 peer-reviewed article, It’s Not Just the Money: The Benefits of College Education to Individuals and to Society in Government and Civic Life; See the Urban Institute’s September 2018 analysis Evaluating the Return on Investment in Higher Education: An Assessment of Individual- and State-Level Returns, p. 10: “Reliance on food stamps, Medicaid, or public assistance, as well as the probability of unemployment, all decline in lockstep with level of education…Trostel (2008) estimates total savings to state and local governments to be roughly $34,773 for each individual who completes a college degree instead of stopping after high school….”
[45] See the 2019 peer-reviewed article Are They Still Worth It? The Long-Run Earnings Benefits of an Associate Degree, Vocational Diploma or Certificate, and Some College, in The Russell Sage Foundation Journal of the Social Sciences.
[46] See the National Bureau of Economic Research’s May 2020 working paper, The Economic Impact of Access to Public Four-Year Colleges.
[47] See the U.S. Census Bureau’s Current Population Survey Table for Personal Income, PINC-03. Educational Attainment-People 18 Years Old and Over, by Total Money Earnings, Work Experience, Age, Race, Hispanic Origin, and Sex. Personal Income 25 Years and Over, Both Sexes, Total Work Experience. Accessed September 2023.
[48] See the U.S. Census Bureau’s American Community Survey’s 2022 1-year Estimates for New Hampshire in B20004 Table: Median Earning in the Past 12 Months (in 2022 Inflation-Adjusted Dollars) By Sex By Educational Attainment for the Population 25 Years and Over.
[49] See the U.S. Census Bureau’s American Community Survey 2022 1-year Estimates for New Hampshire in S1501 Educational Attainment.
[50] See the U.S. Census Bureau’s June 2023 visualization, Who is Receiving Social Safety Net Benefits?
[51] See the U.S. Department of Labor Women’s Bureau 2022 visualization, Median Weekly Earnings by Educational Attainment and Sex (annual).
[52] See the U.S. Department of Labor Women’s Bureau 2022 visualization, Women’s Median Weekly Earnings by Educational Attainment, Race, and Hispanic Ethnicity.
[53] See the Federal Reserve Bank of St. Louis’ 2019 Fourth Quarter Review article, Is College Still Worth It? The New Calculus of Falling Returns.
[54]See the New Hampshire Departments of Business and Economic Affairs’ State of New Hampshire Workforce Assessment from August 2022, Updated April 2023.
[55] See the Federal Reserve Bank of Boston’s 2008 Communities and Banking article, High Returns: Public Investment in Higher Education.
[56] Adjustment calculated using Bureau of Labor and Statistics’ Consumer Price Index for All Urban Consumers in the Northeast for the first half of 2023.
[57] See the National Bureau of Economic Research’s May 2020 working paper, State Investment in Higher Education: Effects on Human Capital Formation, Student Debt, and Long-Term Financial Outcomes of Students.
[58] See the 2022 peer-reviewed article, The Relationship between Postsecondary Education and Adult Health Behaviors, in the journal SSM-Population Health.
[59] See Projections Central, State Employment Projections, Projections Managing Partnership’s Downloads for Short-and Long-Term Employment Projections. Accessed August 2023.
[60] For more information, see the CCSNH’s ApprenticeshipNH website.
[61] See the Midwestern Higher Education Compact’s August 2022 policy report, State Funding Approaches for Public Colleges and University in the Midwest.
[62] See InformEdStates Higher Education Policy Initiative’s December 2021 working paper, The Landscape of State Funding Formulas for Public Colleges and Universities.
[63] See the 2023 peer-reviewed article, The Impact of Performance Funding Policy Design on College Access and Selectivity, in the journal Educational Evaluation and Policy Analysis; See InformEdStates Higher Education Policy Initiative’s July 2021 working paper, A National Analysis of the Impact of Performance Funding on Completion Outcomes Among Under Served Students, later published in 2023 in the peer-reviewed journal The Review of Higher Education. See InformEdStates Higher Education Policy Initiative’s January 2022 working paper, The Unequal Impacts of Performance-Based Funding on Institutional Resources in Higher Education.
[64] See The Healthy Minds Network’s The Health Minds Study 2021-2022 Data Report. See results from the question, “In the coming academic year, what concerns, if any, do you have about your ability to complete coursework and get good grades?“, from the College During Covid Study conducted by College Pulse during May 2021.
[65] For more information about ITHAKA S+R, see the About section of their website. See ITHAKA S+R’s December 2020 Issue Brief, An Overview of State Higher Education Funding Approaches: Lessons and Recommendations.
[66] See ITHAKA S+R’s December 2020 Issue Brief, An Overview of State Higher Education Funding Approaches: Lessons and Recommendations,p. 13, “The Quality Improvement Organizations (QIOs), used to evaluate Medicare providers, use data-driven metrics to provide feedback on patient care and actionable steps to improve quality, but the government does not withdraw Medicare funding when the provider does not initially meet those metrics. Research suggests that when a provider uses QIOs rigorously, patient care and outcomes can improve.”
[67] See Office of the Governor’s Executive Order 2023-06.