The State of New Hampshire relies on corporate taxes for a greater percentage of tax revenue than any other state. In fiscal year 2021, New Hampshire raised about 31 percent of total tax revenue through corporate income taxes, while the next highest state was New Jersey, with about 14 percent of tax revenue coming from state taxes on corporate income.[1] As a result, changes in taxes on businesses in New Hampshire have the potential to create significant fiscal impacts on the State Budget, as well as have effects on the broader economy.
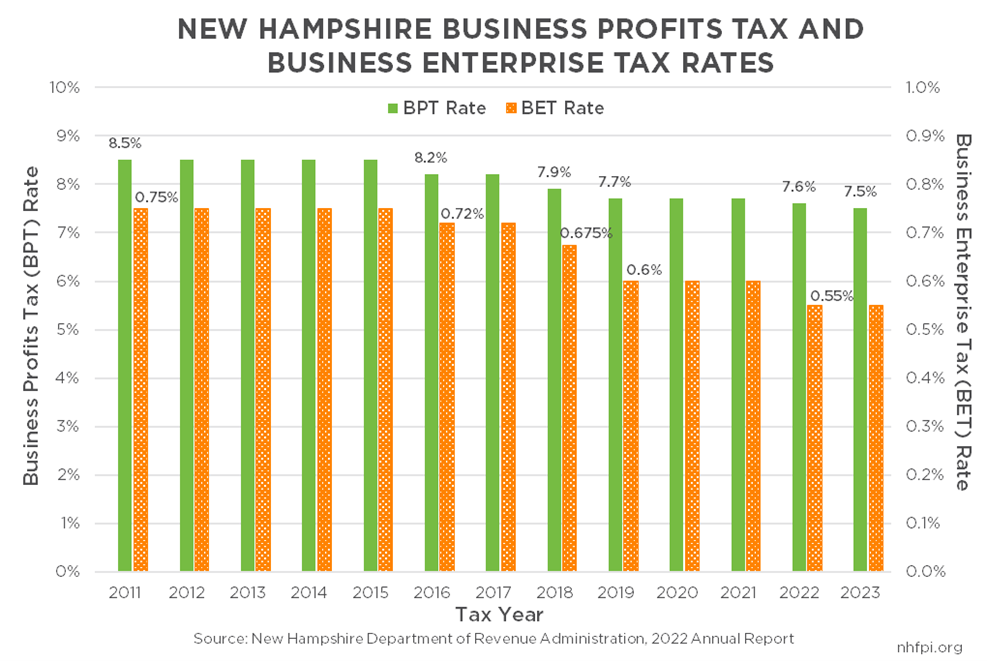
New Hampshire has two primary business taxes, the Business Profits Tax (BPT) and the Business Enterprise Tax (BET). The BPT and BET are filed together by business entities that pay them, and the revenue from each is counted together in the state’s initial accounting. However, these two taxes are very different, as the BPT taxes corporate income after certain expenses and adjustments, while the BET is based largely on compensation paid to employees by businesses, as well as interest and dividends paid by businesses.[2] The rates of these two taxes have been successively lowered several times since 2015. The tax rates remained the same from 2001 to 2015, at 8.5 percent for the BPT and 0.75 percent for the BET, respectively. Starting in 2016, both taxes were incrementally lowered, dropping to 7.5 percent and 0.55 percent, respectively, by 2023.[3]
In the period between 2015 and 2022, combined receipts from the BPT and BET rose substantially even as rates were reduced, leading to discussions of the potential reasons for the rise in tax revenues that included speculation as to whether economic growth spurred by tax rate reductions may have offset losses from those rate reductions and generated additional revenue.
This Issue Brief assesses the extent to which revenue was gained, or lost, by the reductions in the BPT and BET rates. It includes a review of relevant national and multi-state research, a review of factors likely generating the three recent increases in business tax receipts between 2015 and 2022, an assessment of the interaction between the business tax rates and the economy in New Hampshire, and an evaluation of the revenue impacts of the BPT and BET rate reductions between 2015 and 2022.
National and multi-state research suggests little relationship between state corporate tax rates and economic or job growth, with identified correlations limited to temporary effects, specific economic contexts, or certain types of businesses. Available research does not indicate business tax rate reductions would generate sufficient economic activity to fully offset revenue losses. Increases in business tax revenues in New Hampshire during the last eight years appear to be due to factors beyond the BPT and BET rates, including an uptick in economic growth that was delayed after the end of the Great Recession, federal tax policy changes spurring business repatriation of corporate profits from other countries, and a surge in national corporate profits paired with increases in wages during and after the COVID-19 public health emergency. Corporate tax revenues also rose sharply in other states in fiscal years 2019 and 2021, suggesting the pattern was not limited to New Hampshire and likely not caused entirely by changes in State policy. While BPT revenues increased during the 2015 to 2022 period, BET revenues have remained relatively steady, with falling revenues or slowing growth after key rate reductions. BET revenues correlated closely with the growth in wages paid in New Hampshire prior to rate reductions, but had fallen far behind that key part of the tax base by 2020, with lower revenues in both 2020 and 2019 than in 2015, before the rate reductions.
While BPT revenues have increased substantially, analyses in this Issue Brief sought to determine if a strong relationship exists in New Hampshire between BPT rates and economic growth; this research found little evidence of any relationship, and found no relationship between BPT rates and job growth. Additional analysis would be required to determine the extent and magnitude of the relationship between both BET and BPT rates and aspects of the economy and business decision-making, but there is not a statistical relationship strong enough to suggest the reductions in tax rates spurred significant enough growth to pay for lost revenue. This finding matches the conclusions of national-level research; other policy interventions, particularly those targeted at directing resources to people with low and moderate incomes, are likely more effective economic stimuli.
Using available data to make projections for BPT and BET revenues specific to taxable periods in 2021 and 2022, and employing a wide, research-derived range of possible levels of revenue-generating economic response to tax rate reductions, this Issue Brief concludes that New Hampshire has forgone a substantial amount of revenue for public services by reducing the BPT and BET rates. Business tax rate reductions are estimated to have reduced revenues from these taxes by between $496 million and $729 million from the 2016 to 2022 taxable periods. These figures rely on both published historical data and revenue projections, and subsequent research could provide opportunities to refine these estimates. For context, the combined General and Education Trust Funds in the State Budget, which receive the revenues collected by the business taxes, collected $3.2344 billion in State Fiscal Year (SFY) 2022; estimated revenue losses, aggregated over the 2016 to 2022 period, are between 15 and 22 percent of that SFY 2022 one-year total. These estimated foregone revenues are approximately the equivalent of the total State funds contributed to mental health services during SFYs 2013 through 2019.[4]
Corporate Tax Policy and the Economy: Reviewing the Research
Taxes can and do impact economic activity, particularly in extreme or very specific cases. Depending on the economic effects of the services funded by tax revenue, taxes can slow economic growth by discouraging work or investments, particularly in response to very high tax rates. Taxes on specific items or situations can also impact behavior, such as specific purchases of goods taxed at different rates or spending and investment decisions, including charitable giving in response to available deductions or building a house in one jurisdiction rather than another.[5] However, while individuals and companies may respond differently to changes in taxes, research on the aggregate effects suggests small or marginal changes in taxes have a relatively limited overall impact on the economy, including at the state level.
Effects of Federal Tax Policy Changes
Considering tax rate reductions specifically, Co-Director of the Tax Policy Center William Gale testified to a U.S. House of Representatives Committee in June 2022 that: “An avalanche of evidence indicates that tax cuts in general, and tax cuts for high-income households in particular, have had very small impacts on economic growth.”[6] While the Tax Foundation posited in 2013 that tax reforms in some situations can lead to higher revenues even when individual rate reductions are included, it also wrote: “Can a tax cut pay for itself? Most economists would probably agree that the answer is generally ‘rarely, but usually not.’”[7]
The U.S. Congressional Research Service also examined top federal income and capital gains tax rates between 1945 and 2010 and found little or no relationship between savings, investments, and growth in productivity, but did identify that the national share of income accruing to labor, rather than capital, decreased with lower maximum tax rates. More income was also concentrated for the highest-income households in environments with lower maximum income and capital gains tax rates.[8]
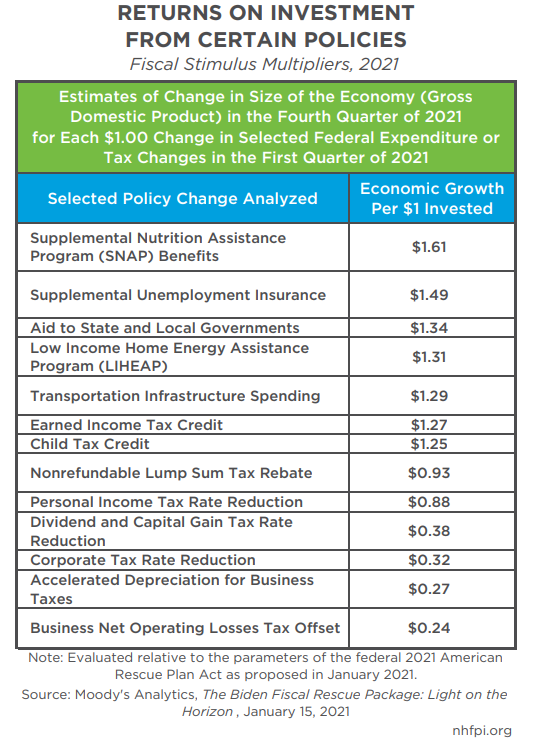
Moody’s Analytics has also conducted economic modeling to estimate the effects of various fiscal policies on the economy. In January 2021, Moody’s estimated each additional dollar in food assistance through the Supplemental Nutrition Assistance Program (SNAP) in the first quarter of 2021 would have boosted the size of the overall economy by $1.61 by the end of 2021, as individuals would have spent their income support on food in the local economy. Supplemental unemployment insurance would have boosted the economy by $1.49 per dollar invested over the same time period, as unemployed individuals with fewer resources would have quickly used these benefits in the economy. The same analysis estimated a dividend and capital gain tax rate reduction would generate $0.38 for each dollar of foregone revenue, while a corporate tax rate reduction would generate $0.32, and a business net operating loss tax offset would produce $0.24 on the dollar in return on investment.[9] These estimates are similar to Moody’s analyses of the economic impacts of similar policies for 2009 and 2015, when federal corporate tax rate reductions were estimated to generate $0.32 and $0.30, respectively, per dollar invested.[10]
This analysis echoes those performed by researchers at the nonpartisan U.S. Congressional Budget Office (CBO). Assessing the multiplier effect of federal American Recovery and Reinvestment Act policies six years after enactment, the CBO identified the highest potential multiplier from purchases of goods and services by the federal government (2.5 on the high end of the range of multiplier estimates, with 0.5 at the low end), which directly stimulated demand in the economy. Transfer payments to state and local governments for infrastructure had the next highest potential positive impact (2.2 to 0.4), while transfer payments to individuals, including SNAP benefits and unemployment compensation (2.1 to 0.4), and transfer payments to state and local governments for non-infrastructure purposes followed with the next highest potential benefits (1.8 to 0.4). A one-year tax cut for higher-income individuals (0.6 to 0.1) and corporate tax provisions primarily designed to help business cash flow (0.4 to 0) had the smallest economic multipliers evaluated, suggesting they had the least positive impact on the economy per dollar allocated to them.[11]
Additional CBO analysis focused on the employment impacts of policy options in 2011 also identified that increasing aid to unemployed workers and reducing taxes for firms that increase their payroll had the highest potential positive impacts on employment, while reducing taxes on business income or on repatriated foreign business profits showed the lowest estimated impact on increased employment.[12] The CBO noted that increases in disposable income for lower-income households are more likely to boost the economy than increases for higher-income households due in part to the more limited fiscal capacities of low-income households to spend.[13] Described with an example, a $500 addition to the budget of a household with a baseline annual income of $25,000 would more likely be spent fully in the local economy in an expedited manner than the same addition to the budget of a household with a $350,000 annual income, as the lower-income household may have more deferred needs due to lower capacity for spending and investment in well-being.
Analyses of State Tax Policy
Different studies frequently find conflicting impacts of state tax policy choices. In a December 2015 literature review published in National Tax Journal, authors found “[m]ajor recent studies reach almost every conceivable finding: tax cuts raise, reduce, do not affect, or have no clear effect on growth.” Relative to state corporate taxes, the authors identify several studies that show no statistically significant negative effects of corporate tax rates on economic growth, while some research suggests higher property taxes have negative impacts.[14]
Other state-level tax policy research shows mixed impacts from corporate tax rate changes on economic growth. Research findings likely depend on the scope of the particular study. A published, peer-reviewed 2014 study from researchers at Harvard University and Texas A&M University focused on business taxes in all 50 states from 1977 to 2005, which examined overall economic conditions and concluded “state business tax cuts have little to no positive impact on gross state product, job creation, personal income, poverty rates, and business establishments.”[15] A subsequent analysis from researchers at Stanford University and the Massachusetts Institute of Technology, published in 2019, focused on larger, multi-state firms and corporate taxes between 1977 and 2011, and found short-run effects of state corporate taxes on employment and the number of establishments for certain corporations.[16]
A 2013 academic study published in the journal Business Economics found that corporate tax rate reductions were effective at generating job growth, but only for one year, after which the effects disappeared; this study posited that reducing corporate tax rates would be revenue negative in states without individual income taxes, but data were too limited to draw conclusions.[17] Another 2018 working paper analysis, which examined 250 state corporate tax rate changes from 1970 to 2010 and both sought to adjust for larger economic trends and focused only on counties bordering neighboring states, found corporate tax rate increases reduced job and income growth, but that rate reductions were only effective for generating job and income growth during recessions. This study, which noted controlling for all relevant variables is difficult, also did not find substantial evidence of firms moving across borders to avoid higher corporate tax rates.[18] An international study published in August 2022 could not conclude that corporate tax reductions helped overall economic growth based on a review of 42 other studies across different countries, although results varied within those studies.[19]
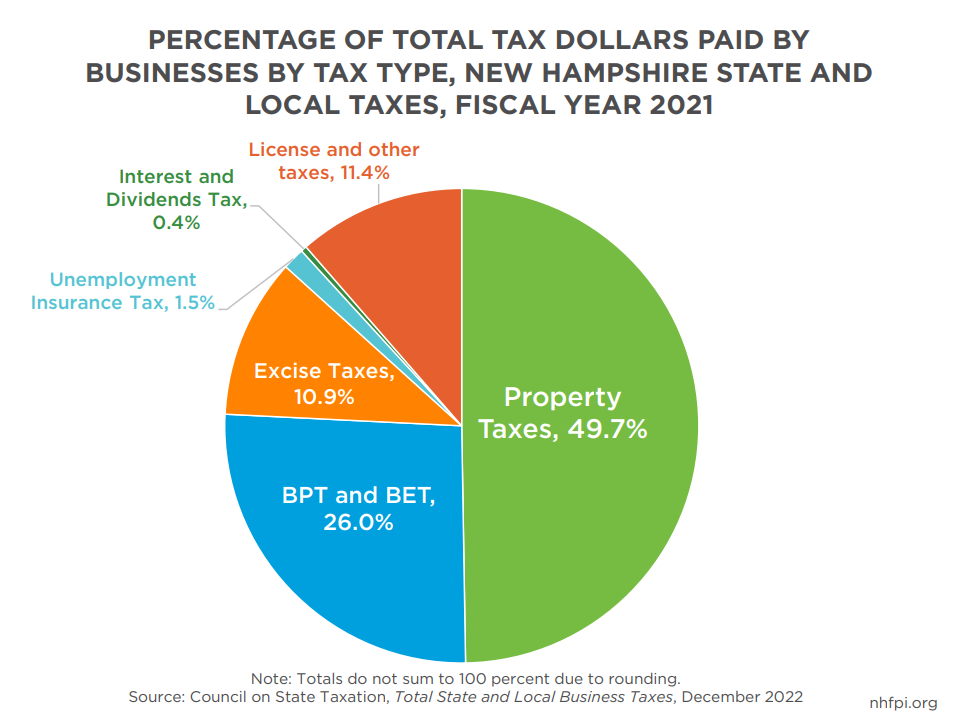
New Hampshire’s own Commission to Study Business Taxes, which published its final report in 2014, concluded, “New Hampshire businesses do not consider the current BPT rate [of 8.5 percent] as a primary factor in making decisions to expand or locate within the State. Factors such as energy costs, skilled and educated work force, state infrastructure, and real estate costs (including property taxes) are more of a concern to New Hampshire businesses.”[20] According to the Council on State Taxation, about half (49.7 percent) of all State and local tax dollars paid by businesses during fiscal year 2021 in New Hampshire were property taxes, while just over a quarter (26.0 percent) were paid to the BPT and the BET.[21]
Robust, positive economic effects from state corporate tax rate reductions would be required to substantially offset revenue losses from rate reductions. Available research does not indicate business tax rate reductions generate sufficient enough economic activity to fully offset revenue losses, although a portion may be offset as a result of state tax policy changes. One researcher estimated in 2005 that a higher business tax base would offset about a quarter of the initial revenue loss associated with a business tax rate reduction. Two economic models constructed by separate states in 1996 and 2001 both estimated, primarily through projections of increased employment following tax rate reductions, that about 16 percent of lost revenue would be recouped through increased economic activity. A separate model generated for the State of Arizona in 2010 by an economic modeling firm estimated each $1 in forgone revenue from a state corporate tax rate cut would generate between $0.05 and $0.18 in new revenue from feedback effects.[22]
New Hampshire business tax reductions in 2016 and 2018 do not appear to have spurred significant new economic growth, including economic growth substantial enough to offset the revenue lost due to tax rate reductions. NHFPI analyses conducted in 2019 examining prior State business tax reductions found no evidence that those policy changes spurred sufficient economic growth to generate revenue increases, and little evidence these rate changes impacted economic and job growth overall.[23]
Limited state-level economic growth resulting from a corporate tax rate reduction is likely due in part to where the forgone tax revenue flows to instead of into state government services. The businesses paying the most in state-level corporate taxes are typically large multi-state and multi-national entities, and may be less likely to reinvest the revenue from a state tax reduction specifically into the particular state that enacted the tax reduction.[24]
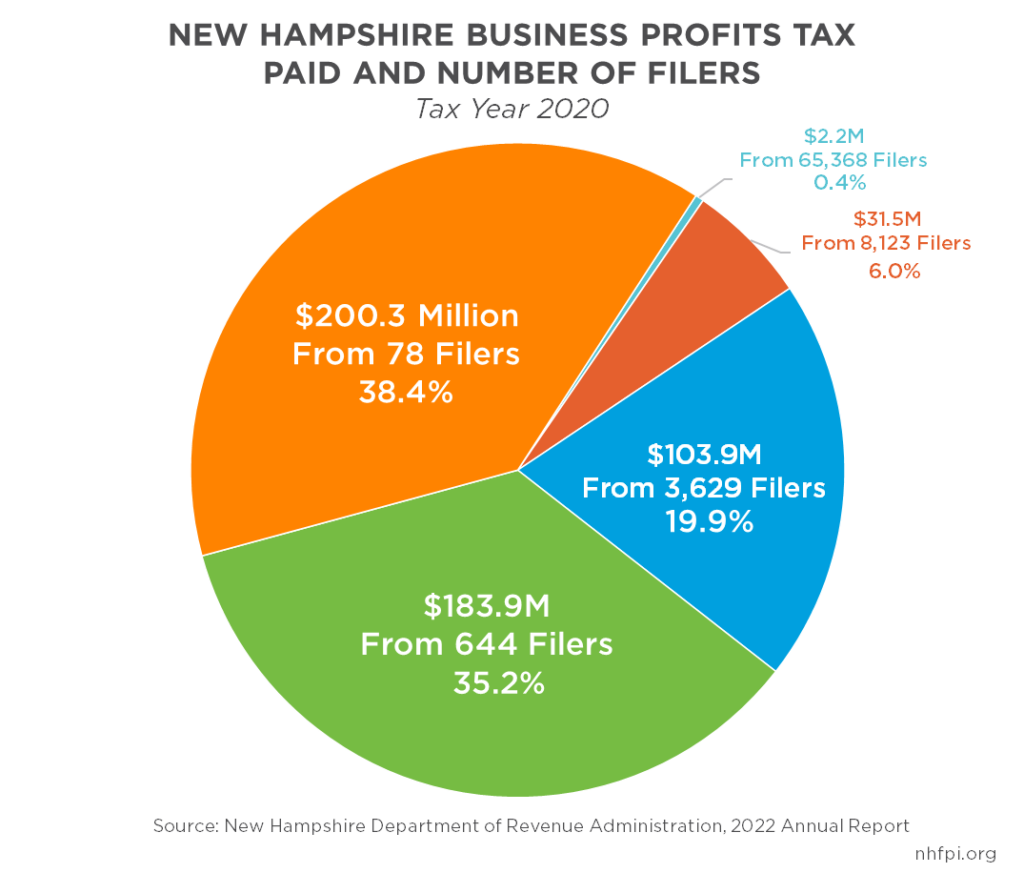
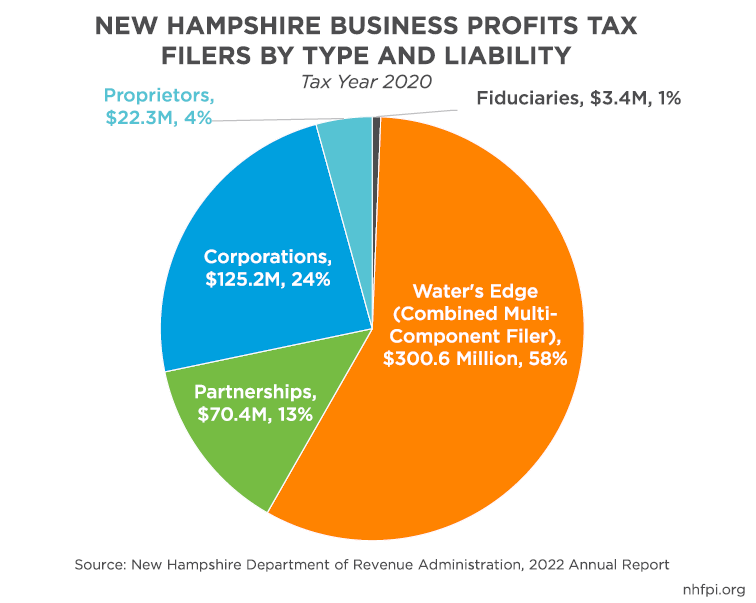
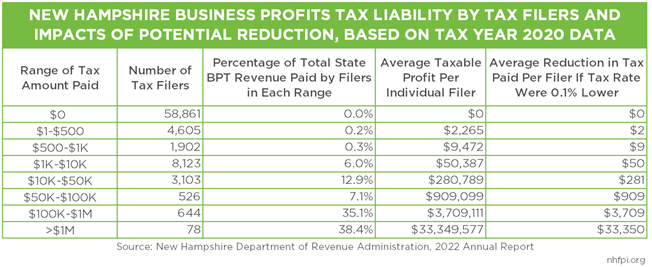
This typical composition of corporate taxpaying entities reflects New Hampshire BPT payers. In Tax Year 2020, 78 entities paying more than $1 million in tax revenues collectively provided 38.4 percent of the total revenue collected by the BPT, New Hampshire’s largest tax revenue source, that year. About 57.6 percent of all BPT revenue was paid by “Water’s Edge” filers, which are multi-part businesses that report as one combined filer, and may have component businesses operating primarily outside of the United States.[25] Reductions in state corporate taxes, such as the BPT, may result in higher payments to shareholders through dividends, and many of those shareholders may be outside of the state.[26]
A 2014 National Bureau of Economic Research working paper from researchers at Duke University and the University of Chicago found that about 40 percent of benefits from a state corporate tax rate reduction would flow to firm owners, while workers would receive 30-35 percent of the benefits and landowners would receive 25-30 percent. These authors found lower corporate tax rates lead to increased business establishment growth over a ten-year period, but also conclude “[i]f a business is especially productive in a given location, small changes in taxes won’t have large enough impacts on profitability to make changing locations attractive.”[27] Other research suggests a greater share of corporate tax rate reductions benefits owners. The Tax Policy Center estimates that investment returns pay 80 percent of corporate income taxes, while wages and other compensation for labor accounts for the remaining 20 percent.[28] Additional research suggests that the private sector revenues from corporate tax rate reductions that are allocated to increased compensation primarily accrue to employees already at the top of the pay scale within companies.[29]
A 2020 analysis from the Tax Policy Center estimated that about 40 percent of U.S. corporate stock shareholders are foreign investors, suggesting a large portion of enhanced profits shared through dividends may not only leave the state, but could leave the country, as a result of state corporate tax rate reductions. Other data also indicate a significant percentage of all corporate shareholders are in the wealthiest percentiles of the nation’s residents, potentially making a corporate tax rate reduction effectively a tax savings for residents who already have significant resources.[30]
Balancing State Budgets and Policy Tradeoffs
In contrast to reduced taxation of corporate profits potentially resulting in dollars leaving the state’s economy, revenue raised by state corporate income taxes, such as the BPT, would likely be spent on goods and services within the state.[31] For example, additional dollars raised by the BPT could fund salaries of public employees that are subsequently spent in the local economy, or be used to offset property tax increases, which disproportionately reduce the after-tax financial resources of Granite Staters with low and moderate incomes.[32]
Like most other states, New Hampshire has a balanced budget requirement.[33] That requirement translates into budgeted operating expenditures needing to match concurrent State revenues and any surplus from the prior State budget.[34] As a result, a dollar of foregone State revenue results in a dollar less invested in public services locally.
The analyses from Moody’s Analytics and the CBO described earlier suggest that spending on direct support to individuals with low incomes, or on state and local government infrastructure investments, are likely more economically stimulative than corporate tax rate reductions. Research regarding longer-term and societal-level returns on investment suggests that other policies funded by public revenue may also have higher returns. Two RAND Corporation studies of potential New Hampshire policy initiatives estimate that investments in early childhood interventions of home visiting, preschool education, and nurse-family partnerships would return between $2 and $6 for every dollar invested; these analyses estimated preschool targeted at children from families with low incomes would also yield positive returns.[35] Analysis from researchers at Opportunity Insights, a non-profit based at Harvard University, found the highest value investments of public dollars relative to overall social well-being were the health and education of children with low incomes; these researchers also estimated that many forms of these investments paid for themselves.[36]
This research and economic modeling suggests that, in some instances, raising tax revenue from corporate profits and investing those revenues in children, infrastructure, and assistance to individuals and families with low incomes may be substantially more beneficial for state economies than tax reductions. New Hampshire’s balanced budget requirements make these tradeoffs active components of the State Budget process.
Likely Causes of Recent Revenue Growth
New Hampshire’s State tax revenues have climbed substantially in recent years, including revenue from the BPT. These increases in BPT revenues have occurred even while the BPT rate was reduced in Tax Years 2016, 2018, 2019, 2022, and 2023.[37] About 90 percent of businesses have a Tax Year that coincides with the Calendar Year.[38] Available data suggest significant recent revenue growth has largely been limited to the BPT, however, while BET revenue has been comparatively stagnant.
Business Taxes and Recent Revenue Growth
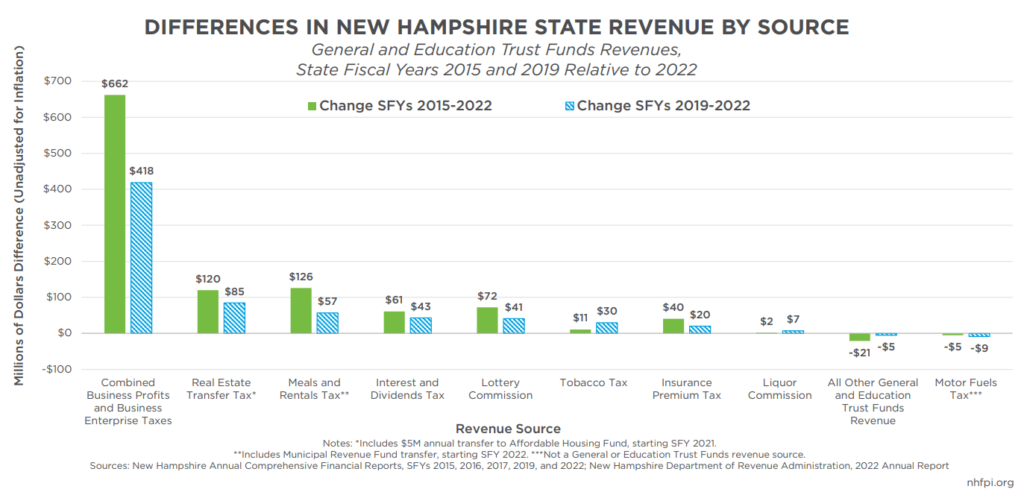
Combined receipts from the two business taxes, the BPT and the BET, have been a primary driver of recent revenue growth. Between State Fiscal Year (SFY) 2015 and 2022, combined business tax receipts rose $662.3 million (117.9 percent), from $516.7 million in SFY 2015 to $1,224.1 million in SFY 2022.[39] The combined business tax receipts were not the only State tax revenue source that grew substantially in this time period; comparable receipts were $126.1 million (44.8 percent) higher for the Meals and Rentals Tax in SFY 2022 than in SFY 2015, and $120.0 million (102.0 percent) higher from the Real Estate Transfer Tax.[40]
However, while combined business tax receipts have risen substantially, BET revenues were slightly lower in Tax Year 2020 than in Tax Year 2015, before the tax rate reductions began. State reporting, and revenue projections created by the House and Senate Ways and Means Committees, typically measure receipts from the BPT and the BET together. Most of the revenue from these two taxes comes in the form of quarterly estimate payments from businesses, which do not necessarily indicate whether these revenues are the result of a BPT or BET liability. Only when the final tax returns are filed, which is between four and eleven months after the end of the tax year, does the New Hampshire Department of Revenue Administration know definitively the portion of the total BPT and BET revenue generated that results from each individual tax. The figures published in the New Hampshire Annual Comprehensive Financial Reports showing the split between BPT and BET revenues by State Fiscal Year are based in part on historically-rooted assumptions of the portions of quarterly estimate payment revenues that are paid to fulfill BPT and BET liabilities.[41]
The schedule of rate reductions for the BET has been more aggressive than BPT rate reductions. The BPT rate was 8.5 percent in 2015, and was lowered to 7.5 percent in 2023, which was an 11.8 percent reduction (and a 1.0 percentage point reduction) in the rate. The BET was lowered from 0.75 percent to 0.55 percent, a 26.7 percent reduction (and a 0.2 percentage point reduction), over the same period.
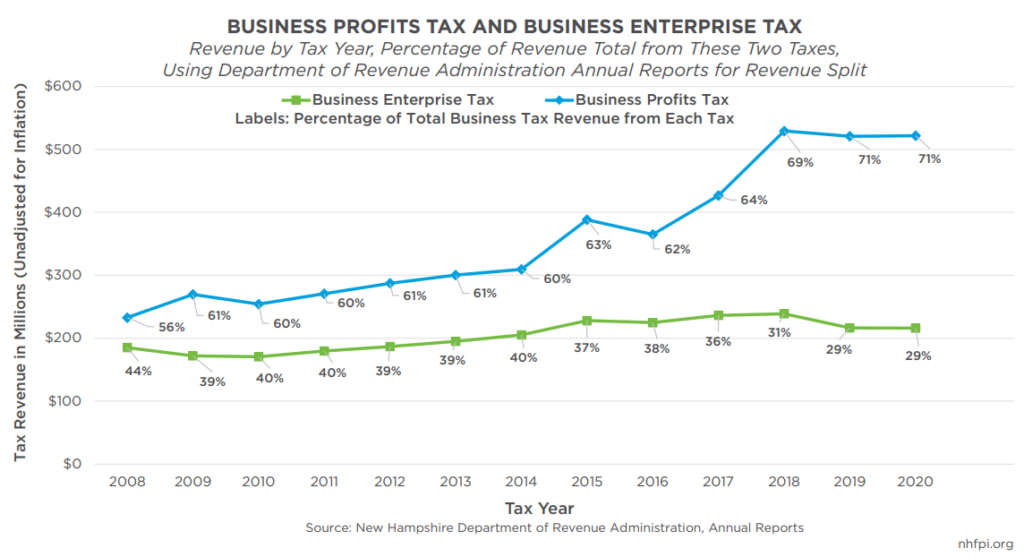
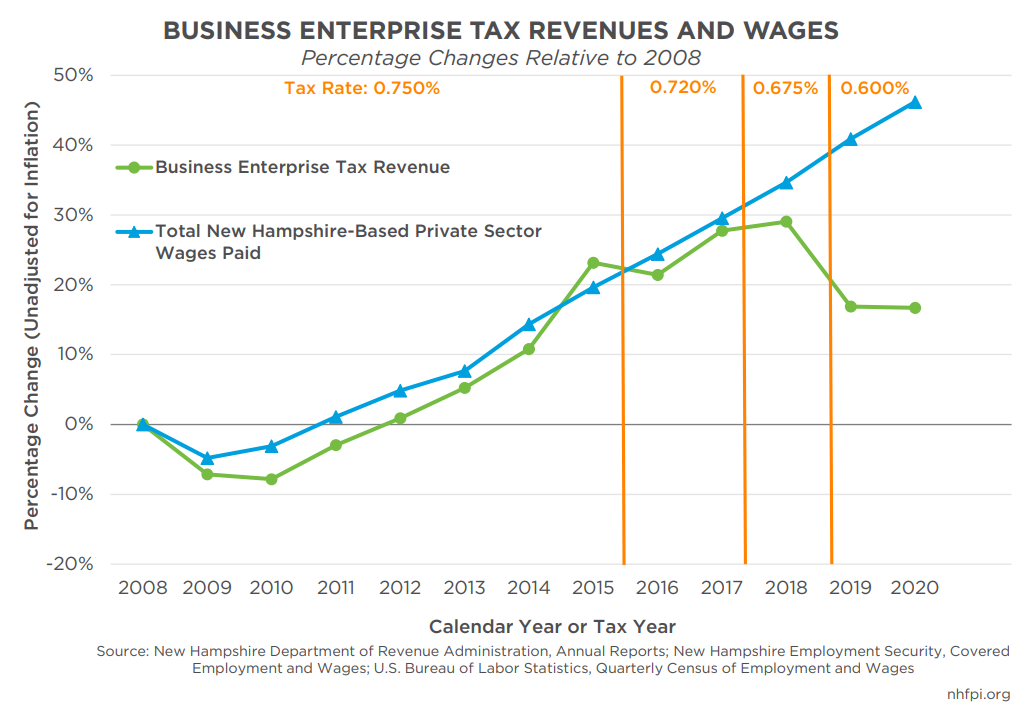
This disproportionate overall change in the BPT and BET rates appears to have had two consequences. First, data from Tax Years 2008 to 2020 show that the BPT has become a larger percentage of the two taxes; the draft 2020 data are the most recent published by the New Hampshire Department of Revenue Administration showing the Tax Year split between the two taxes. The second is that since the BET rate reductions began in Tax Year 2016, revenues for the BET have been stagnant. In Tax Year 2015, the BET collected $228.1 million. The tax rate declined for Tax Year 2016, and revenues declined 1.4 percent to $224.8 million. Revenues grew 5.2 percent in 2017, and then grew by only 1.0 percent in 2018, when a new rate reduction took effect. Revenues fell 9.4 percent in 2019, when the rate dropped from 0.675 percent to 0.60 percent, the largest decrease of the tax rate reductions. Revenues in Tax Years 2019 and 2020 were $216.5 million and $216.1 million, respectively, below the level collected in 2015, the year before the tax rate reductions began.[42] This decrease in revenue occurred even as the total amount of wages, the primary driver of the BET base, paid by businesses to employees at establishments in the state rose by 22.2 percent, unadjusted for inflation, from 2015 to 2020. This discontinuity in trends suggests that BET revenues would have risen in line with prior growth without the rate reductions.[43]
Tax rate reductions appear to have reduced BET receipts substantially relative to their potential since 2015. However, total business tax revenues have risen during this time; these BET data, regarding both revenues and changes in the tax base, suggest those overall increases have been driven largely by boosts to BPT revenue since 2015.
Business Profits Tax Revenue and Rates
As research outlined above indicates, the BPT rate reductions were unlikely to spur sufficient economic activity to generate revenue increases. Available evidence does not suggest New Hampshire’s situation is a substantial deviation from these research findings.
In dollar terms, an incremental BPT rate reduction of 0.1 percentage points, which was the increment of the last three reductions, does not provide a substantial tax reduction to all but the most profitable of businesses. In Tax Year 2020, a 0.1 percent reduction in the BPT rate would have reduced tax liability for the 78 most profitable tax filers by $33,350; this amount is about $12,348 less than the equivalent of 40 hours per week and 52 weeks per year of the median hourly wage paid by employers in New Hampshire in June 2021.[44] For the 8,123 businesses that paid between $1,000 and $10,000 in BPT in Tax Year 2020, representing 42.8 percent of all businesses that paid BPT, the average tax payment reduction would have been $50.39. These figures suggest that very few businesses would receive enough of a tax reduction to reinvest resources into the state economy that would be sufficient to hire more employees or make significant additional investments that would spur substantial economic growth due to a 0.1 percentage point rate reduction.
Businesses paying both the BET and the BPT can use the amount of BET paid as a dollar-for-dollar credit against the amount of BPT they owe.[45] Lower BET liabilities, a result of a lower BET rate, would generate higher BPT revenues. However, revenues would be lower in total if this shift were the only factor increasing BPT revenues relative to the BET. Not all forgone BET revenues would translate into BPT dollars due to some BET-paying businesses not having a BPT liability. Combined business tax revenues have more than doubled, however, between SFYs 2015 and 2022.
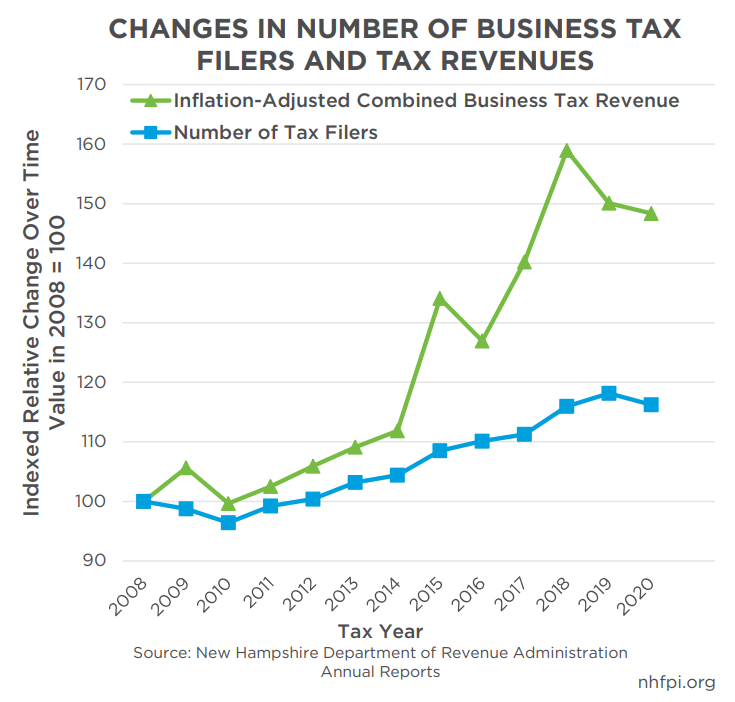
The rise in business tax revenues also did not appear to be primarily driven by more businesses moving into New Hampshire. The number of businesses filing for BET and BPT rose between 2008 and 2020, the Tax Years for which data are published, but revenues rose much faster. While changes in combined BPT and BET revenues generally correlated with the number of entities filing BPT or BET returns with the State between 2008 and 2014, revenues began growing much faster than the number of filers starting in 2015. Between 2008 and 2020, the number of filers grew by 16 percent, but inflation-adjusted revenues grew by 48 percent.[46] Using a different dataset associated with unemployment insurance, the number of worksites (such as establishments) in the state reported by businesses increased 18 percent between 2015 and 2022, while inflation-adjusted revenues increased by 87 percent between SFYs 2015 and 2022.[47] If tax revenue growth were driven primarily by businesses moving to, expanding in, or being created within the state, the number of filers or worksites would likely increase more consistently relative to revenue, rather than falling substantially behind revenue growth.
While multi-state research and New Hampshire-level data indicate BPT rate reductions did not spur growth in the economy sufficient enough to offset revenue losses and boost BPT revenues overall, several other factors offer likely explanations for three bursts of tax revenue. The first occurred in about 2016, while the second began in 2018, and the third pushed revenues up in 2021 and 2022.
The rise in revenue leading up to 2016 appears to have been driven by revenues other than the two primary business taxes during 2015. The two business taxes started generating significant increases in revenue over the prior year in 2016, when returns for Tax Year 2015 were being filed alongside quarterly estimate payments for Tax Year 2016. NHFPI analysis published in 2019 examined overall growth in employment and New Hampshire’s Gross State Product, a measure of the size of the state’s economy, and found growth in these areas was increasing following a very slow recovery from the Great Recession. Overall economic growth in New Hampshire was very slow in the 2011 to 2013 period before increasing more rapidly in 2014, and employment growth reached a peak in early 2016 following a rise in 2015. This increase in economic activity, and the timing of other tax receipts, suggest economic growth spurring a rise in business tax revenues preceded the rate reductions that took effect in Tax Year 2016, rather than being enabled by more resources available to businesses after they took effect.[48]
The second rise in revenue started in early 2018, immediately following the December 2017 passage of the federal Tax Cuts and Jobs Act (TCJA). This revenue increase was not only led by growth in business taxes, but was almost entirely a phenomenon created by business tax revenue growth. The TCJA changes relative to corporate taxation likely had a substantial impact, including changes with respect to the treatment of foreign-source income earned by multi-national companies. The TCJA provided a tax incentive to bring assets to U.S. affiliate companies, rather than hold them overseas. The TCJA also created a new deemed repatriation tax on company cash and assets held and untaxed overseas from previous years. New Hampshire’s BPT did not automatically update to match the TCJA policies, so revenues that were actually repatriated would have been included in the BPT base, and likely were. Once New Hampshire conformed to the federal tax code in Tax Year 2020, the broader corporate tax base created by the TCJA likely helped boost BPT revenues as well.[49] Without significant underlying changes in economic activity, and with limited changes in other tax revenue sources, NHFPI analysis in 2019 concluded that this upswing was likely spurred by the TCJA. Both the Governor and the Legislature made this conclusion as well, and included one-time anomalous payments in their State Budget revenue projections in 2019 to reflect the TCJA-related boost in revenues.[50] Subsequently, revenues from the combined business taxes declined in Tax Year 2019 relative to Tax Year 2018. While timing of revenue collections differs across states and between Tax Years and fiscal years, as does the structure of corporate taxes (including the lack of a BET-equivalent in other states), comparisons across states can provide insight into the context for New Hampshire’s recent revenue increases. Combined BPT and BET revenues in New Hampshire between SFYs 2017 and 2019 grew 26 percent. Data from the U.S. Census Bureau show combined state corporate tax revenues nationwide rose 34 percent between those two fiscal years. Neighboring states also had similar revenue growth patterns during this time period; corporate tax revenues rose 44 percent in Maine, 34 percent in Massachusetts, and 35 percent in Vermont, suggesting the increases in taxable corporate profits were not unique to New Hampshire.[51]
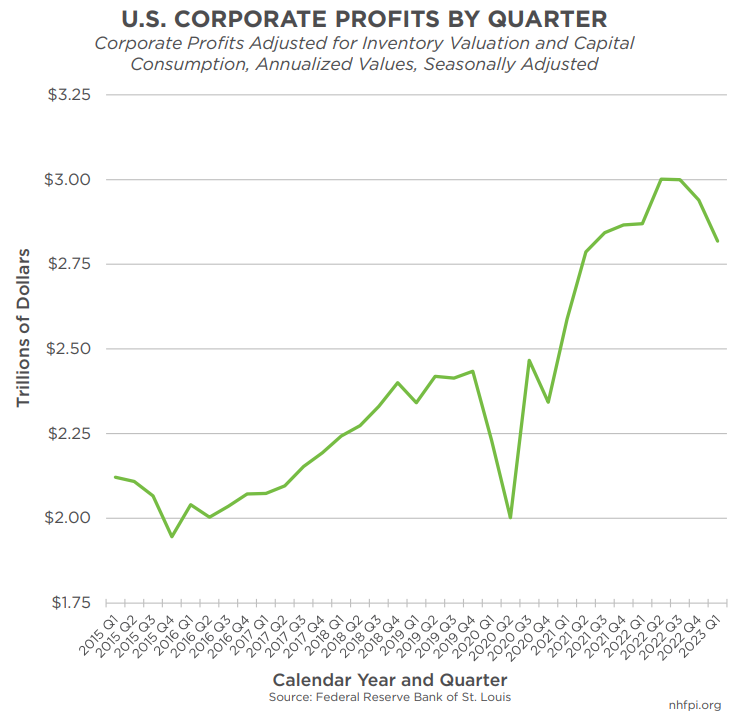
The third increase appears to be driven primarily by the overall economic rebound from the pandemic, spurred by significant federal action, and a rapid surge in national corporate profits. The federal government’s contributions to the state and national economies provided effective economic stimulus, which has substantially boosted growth.[52] Corporate profits have also risen sharply since the initial negative shock at the beginning of the COVID-19 pandemic, rising even with the increases in underlying costs for companies, including labor and supply chain constraints.[53] A key measure of national corporate profits shows total profits were 51.1 percent higher in the fourth quarter of 2022 than they were seven years earlier, and up 21.6 percent in the two years following the third quarter of 2020, immediately after the pandemic’s initial impacts.[54]
As large, multi-national filers are a key part of the BPT base, the increase in national corporate profits is likely a major contributor to the rise in BPT revenues. The apportionment process is used to divide overall business entity profits among states for multi-state operations. New Hampshire apportionment policy has historically been based on the percentages of a company’s sales, property, and payroll based within the state; New Hampshire policy is shifting to being based only on the geography of sales, but overall corporate profits still constitute the basis for calculations regardless of where in the country those profits are earned. As a result, increases in national corporate profits likely impact New Hampshire BPT revenues, potentially disproportionately relative to economic activity in New Hampshire depending on where or how a business entity earned its profits.[55] Other states have also seen corporate tax revenues rise. Using the most recently available aggregated data, while combined BPT and BET revenues rose 41 percent in between SFYs 2020 and 2021, aggregate state corporate income tax revenues nationwide rose 71 percent between fiscal years 2020 and 2021. Among neighboring states, corporate tax revenues rose 32 percent in Maine, 45 percent in Massachusetts, and 18 percent in Vermont, all indicating increased revenues were not unique to New Hampshire.[56]
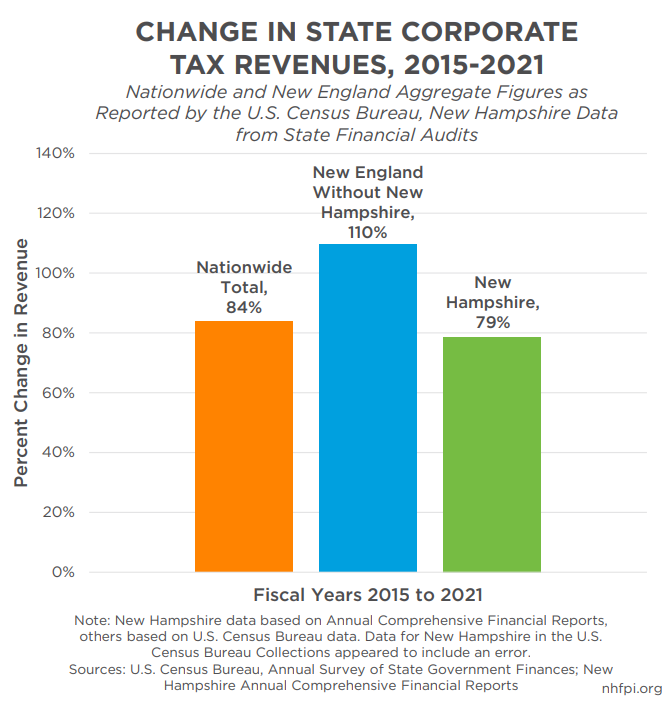
These factors offer the most feasible explanations for the three recent rises in revenue. In the latter two, policy changes did have a substantial impact on revenues, but those policy changes were at the federal level. In total, between fiscal years 2015 and 2021, the most recent year with comprehensive data available from the U.S. Census Bureau, state corporate income tax revenues grew 84 percent nationally, and 110 percent in the New England states excluding New Hampshire, while New Hampshire’s combined BPT and BET revenues grew 79 percent.[57] State BPT rate changes were not likely the primary driver of these significant BPT revenue increases.
New Hampshire Business Tax Rates and Economic Growth
Data specific to New Hampshire can provide indications as to whether business tax rate changes have correlated with economic growth. To be successful at discerning the details of the economic reality in New Hampshire and the interactions with State policy, any model used to reflect reality in quantitative research would have to control for many variables, including external changes in the economy, and require rigorous evaluation. Several simple models, however, could provide some insight as to whether or not BPT rates are deterministic, or an overriding factor, for economic growth in New Hampshire.
NHFPI analysis published in 2019 suggested business tax rate reductions in New Hampshire from 2016 to 2019 did not generate economic activity sufficient to offset revenue losses. These rate reductions also did not appear to have produced significant new economic activity distinguishable from underlying economic conditions.[58]
Examining a longer time horizon could provide some indication as to whether there is a relationship in New Hampshire that is similar to, or different from, the lack of a clear relationship between state corporate tax rates and economic growth found in the academic literature.
Business Profits Tax Rates and Economic Growth
Using a simple comparison of the BPT rate to private sector economic growth from 1970 to 2022, the relevant data for New Hampshire shows a limited relationship between lower BPT rates and higher overall activity. A lower BPT rate would correlate with higher economic growth if a lower rate spurred the economy. Annual Gross State Product (GSP) measures the size of the state’s economy overall, but the data have a methodological discontinuity between 1997 and 1998, so this analysis measures the two periods separately.[59]
To determine that a statistical relationship is significant in quantitative research, rather than a result of random chance that would prevent researchers from concluding a correlation exists, statistical confidence levels in that relationship should be at least 90 percent, and more commonly, 95 percent. In other words, researchers typically seek to obtain statistical evidence that there is only a one in twenty (5 percent) chance or less that a correlation between two variables is spurious before concluding there is a statistically significant relationship.[60] Separately, the strength of statistical relationships can be measured by the percentage of variation in a second variable that appears to be explained by changes in the first variable. In these evaluations, a higher percentage indicates changes in the first variable successfully predicted more of the changes in the second variable.
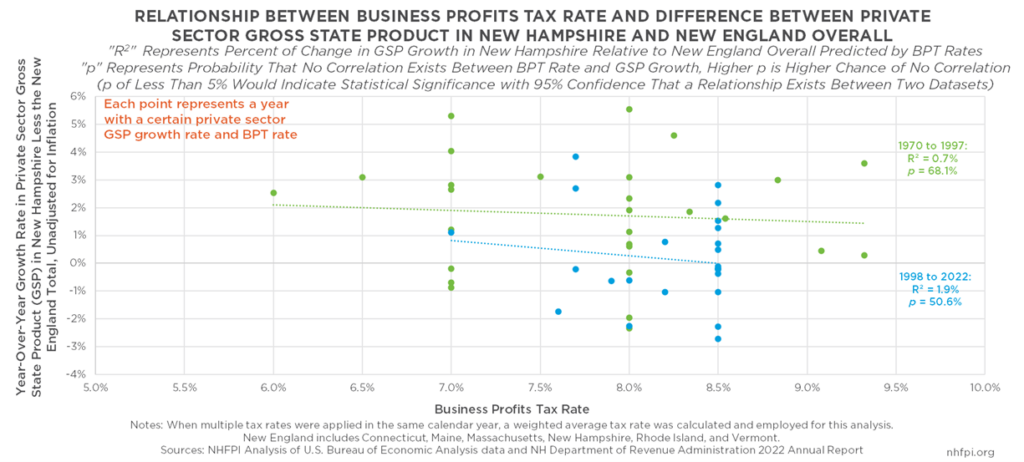
Private sector GSP growth from 1970, the year of the BPT’s establishment, to 1997 shows no statistically significant relationship between private sector growth GSP and the BPT rate; as confidence that a correlation between GSP growth and the BPT rate exists is below 90 percent (and, in this case, below 72 percent) other variables are likely more important for GSP growth. Additionally, only 4.4 percent of the changes in GSP appear to be related to changes in the BPT rate. Between 1998 and 2022, the relationship appears to be stronger and statistically significant at the 90 percent level, although not statistically significant at the 95 percent confidence level. This relationship suggests GSP growth may be higher while tax rates are lower, although a relatively low 15.4 percent of the variation in private sector GSP between 1998 and 2022 correlates with changes in the BPT rate.
However, national and regional economic trends have substantial influences on the New Hampshire economy; for example, removing the data from the private sector GSP decline in 2008, when the BPT rate was 8.5 percent, and the fast economic rebound in 2021, when the BPT rate was 7.7 percent, yields a non-statistically significant relationship, suggesting controlling for national economic variables can provide insight into the robustness of the correlation between BPT rates and GSP growth. Disregarding the methodological differences before and after 1997 and analyzing the entire 1970-2022 dataset also yields no statistically significant relationship; this lack of confidence in any relationship suggests there is not a clear, overriding connection between BPT rates and state-level economic growth.
Analysis that controls for overall economic growth in New England allows for a comparison of the effects of the BPT rate on the New Hampshire economy relative to the New England economy overall. If a lower BPT rate led to higher economic growth in New Hampshire relative to New England overall, that would suggest the lower BPT rate was 1) spurring more economic activity in New Hampshire, 2) attracting more businesses to the state, or 3) a combination of both.[61]
Controlling for economic growth in New England shows there is no statistically significant relationship between the BPT rate and overall economic growth in New Hampshire relative to New England. The BPT rates between 1970 and 1997 only appear to explain 0.7 percent of the variation in the difference between New Hampshire’s economic growth and overall economic growth in New England, and there is not a statistically significant relationship between BPT rates and economic growth. In the 1998 timespan, only 1.9 percent of the variation in the difference between economic growth in New Hampshire and New England as a whole can be explained by the BPT rate, and the relationship is not statistically significant.
Analysis of the difference between annual private sector GSP growth in New Hampshire compared to overall U.S. Gross Domestic Product growth and relative to BPT rates also does not yield a statistically significant relationship.[62]
Inflation-adjusted private sector GSP for New Hampshire has also been calculated by the federal government for the years 2001 to 2021. During most of this time period, including the global Great Recession of 2007-2009, the BPT rate was 8.5 percent. Only six years had lower rates, including the first two years impacted by the COVID-19 pandemic, which limits the utility of this particular analysis. However, the relationship between BPT rates and inflation-adjusted private sector GSP growth during this time period is not statistically significant, and little of the variation in GSP growth could be explained by BPT rate levels.
Separately examining relative GSP growth immediately following recent rate declines to determine if there was a burst of activity that was not sustained did not yield evidence of substantial increases in economic activity. Throughout the 2003-2022 period, GSP growth in New Hampshire outpaced combined growth in New England by 0.1 percent annually. In the years immediately following the recent BPT and BET rate reductions, including 2016, 2018, 2019, and 2022, New Hampshire’s average GSP growth rate was 0.5 percent less than the comparable rates for all of New England.
Overall, these analyses suggest there is likely not a strong relationship between lower BPT rates and higher economic growth. Controlling for economic growth in New England eliminates the statistical significance of the strongest correlation between BPT rates and New Hampshire’s economic growth in the time periods used in these analyses, suggesting factors other than the BPT rate have stronger relationships with GSP. Additional research would be needed to control for other factors before a conclusion on the exact magnitudes of the effects of different BPT rates on the economy could be concluded with a higher degree of certainty.
Business Profits Tax Rates and Employment Growth
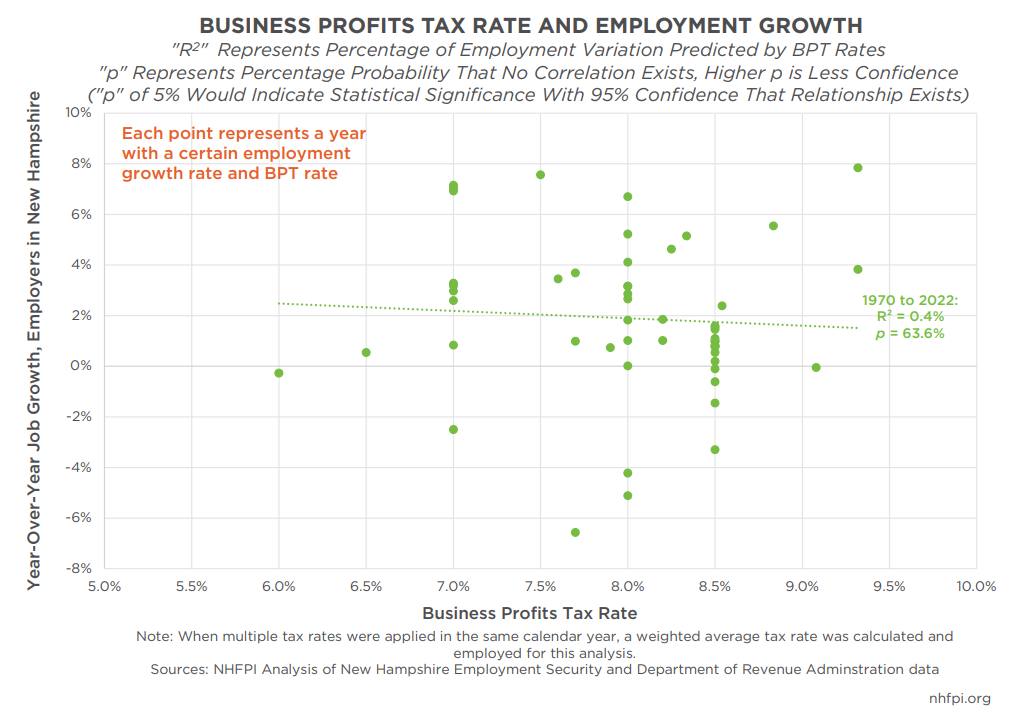
Changes in taxes on businesses in New Hampshire could theoretically alter growth in employment as well, which provides another potential measure of economic vitality. Surveys of employers conducted by the federal government provide annualized data on the number of filled jobs based in New Hampshire since 1939.[63] Year-over-year growth figures provided by this dataset, which includes public, private for-profit, and private non-profit employees, show that there is no discernable and statistically significant relationship between BPT rates and employment from 1970 to 2022.
The BET is more directly a tax on employment, as compensation paid is taxable under the BET, than the BPT. The simple regression model suggests the BET may have more of an impact on employment than the BPT. BET rates from 1993, at the inception of that tax, to 2022 appear to correlate in a statistically significant manner with employment growth, with higher growth occurring when the BET rate was lower. Much of that trend is driven by higher job growth in the 1990s, when the tax rate was 0.25 percent and employment growth was strong nationwide.[64] However, separate analyses adjusting New Hampshire job growth relative to both job growth nationwide and in Massachusetts show a statistically significant relationship between relative annual job growth in New Hampshire and the BET rate. Comparatively rapid population growth in New Hampshire during the 1990s may have spurred faster job growth relative to Massachusetts and the nation overall during the 1990s and more recent decades in New Hampshire.[65]
Separately examining job growth rates showed higher levels of average job growth (1.8 percent) in the years immediately following recent BPT and BET rate reductions than the 2003-2022 average (0.6 percent), but controlling for job growth nationally or in neighboring Massachusetts showed relative growth lagged in the post-tax reduction years of 2016, 2018, 2019, and 2022. Job growth in New Hampshire during 2003 to 2022 averaged 0.2 percent less annually than the national job growth rate, and 0.1 percent less annually than Massachusetts during this period. During the four years immediately following tax rate reductions, job growth in New Hampshire was 0.5 percent behind the national average and 0.4 percent behind Massachusetts. These data suggest there was not a one-time burst of job growth spurred by recent BPT and BET rate reductions in New Hampshire.
These simple analyses do not definitively prove or disprove an association between BPT or BET rates and any particular form of economic growth. More complex modeling inclusive of additional variables would be required to robustly reach such conclusions. However, these analyses strongly suggest that BPT rates are not a primary, overriding driver of changes in the state economy. Other factors are likely to be more influential than tax rate changes, including trends in the national and regional economies, and these analyses do not provide any clear indication that the response of the New Hampshire economy to BPT changes has fundamentally different or unique characteristics than those described by multi-state research on state corporate income taxes.
Lost Revenue from Business Tax Rate Reductions
The economic response to a change in corporate income tax rates appears to be limited, both in New Hampshire and in other states. While there may be some dynamic response, data do not indicate a sufficient response to generate more revenue than is lost as a result of the tax rate reduction. Stagnant BET revenues following rate cuts, even while the tax base grew, shows the BET is not generating more revenue in response to tax rate reductions. The lack of consistent, significant correlations between BPT rates and economic or employment growth in New Hampshire, as well as national and multi-state research showing mixed effects from state corporate tax rate changes, suggests the increases in BPT revenue in recent years have explanations other than tax rate reductions.
Methodology Discussion
While limited data availability complicates precise analysis, estimating a range of potential revenue losses associated with BPT and BET rate reductions in New Hampshire between 2015 and 2022 is possible. The final separation of BPT and BET revenues out of the overall collection of business tax revenues requires a series of assumptions, including estimating the dynamics of the economic response to tax rate reductions. Without the breakdown between the BET and the BPT after 2020, a projection for each tax individually is required to understand the revenue shortfall through 2022.
BET revenues between 2008 and 2015, when Tax Year data are available in the New Hampshire Department of Revenue Administration’s annual reports, correlate well with wages paid to private sector employees based in the state, which are tracked as part of business participation in the State’s unemployment compensation system.[66] The relationship between wages paid, which is a key part but not all of the tax base, in a Calendar Year and the Tax Year BET revenues is quite strong; variation in total wages paid predicts approximately 95.0 percent of the variation in BET revenues in this simple model. The relationship between this measure of wages and BET revenues is statistically significant relationship at rigorous testing levels. The largest error in the model for the 2008 to 2015 time period in any single year, relative to actuals, was $5.6 million (3.0 percent) relative to total revenues of $185.2 million; the median error for all years analyzed was $1.68 million (0.9 percent) relative to actual median revenues of $186.0 million. This model can be used to project BET revenues through 2021 without the tax rate reductions that began in 2016; imputed and preliminary values can be used to estimate for 2022. With BET projections calculated, the BPT can be isolated for 2021 and, with a set of assumptions based on known revenue collections to date, for 2022.
Using the estimates in other economic models and the research findings presented earlier in this Issue Brief, a reasonable range of possible returns would be from zero, with business tax rate reductions having no impact on the economy, to 32 percent of the revenue returned in spurred economic growth. The 32 percent figure would be higher than the estimate offered by a researcher in 2005 of one-quarter of revenue returned, and double the two state tax models that assumed 16 percent. A 0 percent to 32 percent feedback effect range would be wider than the 5 to 18 percent used in economic modeling in Arizona. Collecting 32 cents back for each dollar devoted to a tax reduction would only match the modeling from Moody’s Analytics if all of the increased economic activity stimulated by a tax reduction were paid back entirely in tax revenue collections, which is an unlikely scenario. This high-end returns assumption, however, does leave additional recoupment potential in the estimates if other taxes collect more revenue spurred by economic activity from lower business taxes, which is a theoretical possibility but difficult to quantify with accuracy in New Hampshire’s tax structure.[67]
The estimates produced by this methodology do not include changes in the tax base resulting from policy decisions. For example, changes in filing thresholds, apportionment, and conformity with federal tax law changes are not incorporated into this modeling of revenue losses. The estimated tax bases used to determine the revenue differences from changes in rates already incorporate prior adjustments. This modeling assumes all other changes to the tax base were enacted as scheduled in current law.[68]
Building Business Tax Revenue Estimates
While the breakdown of BPT and BET revenues are reported based on prior assumptions, substantial changes in national corporate profits and the rapid increase in total business tax revenues suggests those prior assumed breakdowns may not reflect tax receipts in 2021 and 2022. The strong correlation between BET revenues and total private sector wages paid in New Hampshire provides confidence that those data are likely a reliable indicator of BET revenues; wage data are available from 2021 and the first three quarters of 2022, allowing for imputation of the final quarter.[69] The wage-based estimated Calendar Year tax base also closely matches the final revenues reported by the BET in each Tax Year when the tax rate for that year is applied, with an average error rate of 0.3 percent between 2008 and 2020, or an average dollar amount error of $1.3 million. The average error rate of any magnitude, positive or negative, is 2.9 percent, and the magnitude of the average annual deviation in either direction from the actual revenue collected by the BET is $6.1 million. This model and the imputed data allow for the construction of estimates of Tax Year 2021 and 2022 BET revenues, totaling $252.3 million and $232.8 million, respectively.
These Tax Year estimates can be subtracted from Tax Year estimates for total business tax receipts. Those estimates are not available, but can be reconstructed using estimates provided by the New Hampshire Department of Revenue Administration for the percentage of business tax revenue by State Fiscal Year that is attributable to different Tax Years. While about 90 percent of businesses have a Tax Year that coincides with the Calendar Year, the State Fiscal Year starts July 1 and ends June 30, shifting six months from most business’s Tax Years. For SFYs 2018 and 2020, the Department of Revenue Administration has provided estimates for the percentages of each State Fiscal Year’s combined business tax revenues based on the Tax Year, and thus the tax rates, to which they can be attributed.[70]
Using this methodology, State Fiscal Year business tax revenues can be converted into Tax Years, and from there a business tax base can be calculated to understand the amount of potential tax collections at alternative tax rates. Audited business tax revenues for SFYs 2021 and 2022 are known.[71] For SFYs 2023, 2024, and 2025, the cash basis June 2023 combined BPT and BET revenues and the estimated total business tax revenues used in the SFYs 2024-2025 State Budget and created by the New Hampshire Senate Ways and Means Committee’s on May 10, 2023 were employed as aggregate figures for constructing revenue estimates for Tax Years 2021 and 2022.[72] The BET revenues previously estimated were subtracted from these projected aggregate Tax Year totals of $1.18 billion in Tax Year 2021 and $1.25 billion in Tax Year 2022 to obtain estimated BPT amounts for 2021 and 2022.
Revenue Loss Estimates
With published tax bases for Tax Years 2016 through 2020 and estimated tax bases for each individual tax for 2021 and 2022, different rates can be applied to understand the amount of revenue that would have been collected if different tax rates had been in effect. These estimates are subject to considerable uncertainty; prior Tax Year data may continue to be updated, and projections used for future tax revenues may not be accurate. Additionally, the economic changes associated with business tax rate reductions cannot be expressed with a clear relationship, and may change over time. As a result, a wide range of estimates was used to model the revenue impacts of rate reductions, ranging from tax rate reductions having no impact on the tax base to boosting it in a manner sufficient to generate 32 percent of lost tax revenue back in enhanced economic activity.
These estimates suggest total public revenue forgone due to business tax rate reductions from Tax Years 2016 through 2022 total between $496 million and $729 million. The low estimate for lost revenue assumes that 32 percent of the revenue forgone due to tax rate reductions since 2015 would be recouped due to enhanced economic activity triggered by the rate reductions, while the higher estimate aligns with the research that shows little discernable relationship between state corporate tax rate reductions and economic growth by assuming no revenue is recouped from the loss.
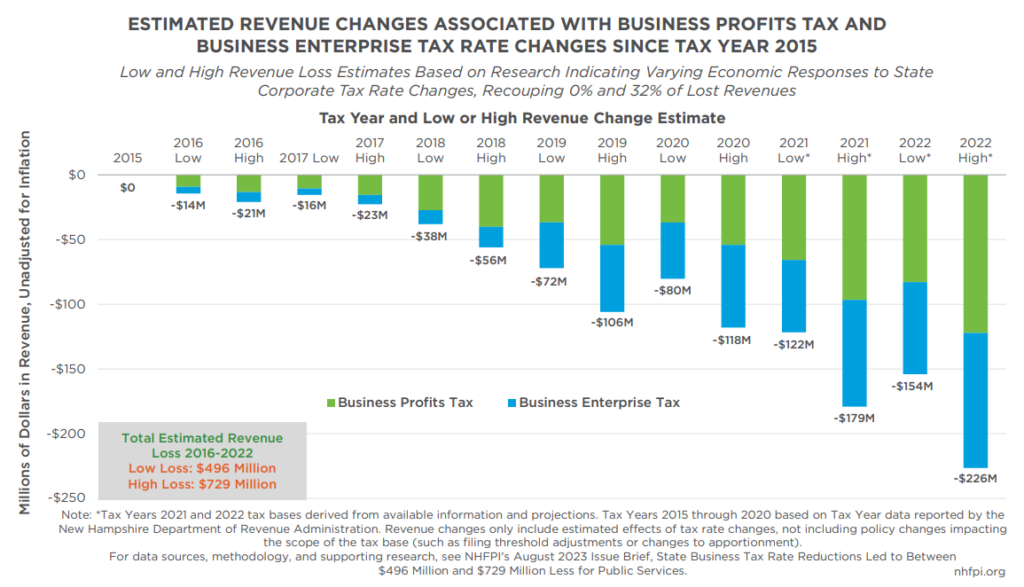
The first rate reductions in Tax Year 2016 resulted in between $14 million and $21 million in foregone revenue. Subsequent tax rate reductions added to those totals, rising to between $80 million and $117 million in Tax Year 2020 alone. The total lost revenue across Tax Years 2016 to 2020, which have tax bases that are derived directly from published State data and not based on estimates or projections of future revenues, was between $218 million and $321 million. The rise in business tax revenues following the end of the pandemic and associated with both the surge in national corporate profits and increases in total wages paid in New Hampshire has expanded the BPT and BET tax bases, likely resulting in much greater revenue losses from the tax rate reductions, particularly as additional rate reductions were implemented for Tax Year 2022. Revenue loss estimates for Tax Year 2022 alone range from $154 million to $226 million.
These revenue loss estimates suggest that the State could have collected and deployed between $496 million and $729 million more through the State’s General Fund and Education Trust Fund during this time period. For context, the New Hampshire Department of Health and Human Services estimated that, over the seven-year period from SFYs 2013 to 2019, State General Fund spending for mental health services totaled $517.5 million, not including matching federal funds.[73] An additional $496 million to $729 million in revenue could have eliminated the Statewide Education Property Tax in its current form for one or two years, which may have provided more effective economic stimulus for the New Hampshire economy than corporate tax rate reductions.[74] Alternatively, the State could have doubled the State Budget contribution to the University System each year as early as 2019, or doubled the current budget of the Veterans’ Home starting as early as 2018, with additional funds remaining in future years relative to the growing impacts of the tax rate reductions over time.[75]
Discussion and Conclusions
Business tax rate reductions enacted in New Hampshire since 2015 have resulted in significant losses of State revenue available for public services.
The available evidence, including both sophisticated multi-state modeling and simple quantitative relationships based on New Hampshire data, cannot conclusively quantify the effects of tax rate reductions on the economy. However, Business Profits Tax rate reductions do not appear to have an impact on the economy that is definitively distinguishable from underlying economic activity and national trends. Additional research would be required to understand the impacts of rate changes in the Business Profits Tax and the Business Enterprise Tax on the New Hampshire economy conclusively, particularly the relationship between the Business Enterprise Tax and employment. However, reductions in tax rates do not appear to be a driver of economic growth sufficient to override other regional and national economic factors affecting the state’s economy.
More conclusively, New Hampshire’s business tax rate reductions do not appear to have resulted in more revenue. Rate reductions have lowered Business Enterprise Tax revenue in a clear manner when those receipts are fully disaggregated from Business Profits Tax payments. Business Enterprise Tax revenues have stagnated even while total wages paid to private sector employees in the state have increased substantially, and recent rate cuts appear likely to limit revenue growth even while the amount of wages paid statewide rises in response to a substantial workforce constraint.
Business Profits Tax revenues have increased robustly even as rates have been reduced, but that increase appears to be largely driven by factors beyond the control of the State policy changes enacted during that time. Increases in other tax revenues preceded the rise in business tax receipts in the 2015-2016 period, as economic growth during the long, slow recovery from the Great Recession began to accelerate. The rise in tax revenues in 2018 followed the federal tax overhaul that substantially changed corporate taxes, triggering a repatriation of revenue, subsequent tax-base broadening, and other changes that were taxable under the Business Profits Tax. The 2021-2022 increase in business tax receipts appears to have been driven by a dramatic rise in corporate profits and an increase in wages paid by New Hampshire employers. Other states also experienced sharp increases in corporate tax revenues in 2019 and 2021, including states that did not have rate reductions. Business Profits Tax rates appear to have limited correlation with growth in size of the New Hampshire economy, with no correlation after making adjustments for outliers driving regional and national economic changes or after adjusting for inflation. Similarly, lower Business Profits Tax rates do not appear to have led to higher job growth in New Hampshire during the 1970-2022 period. If Business Profits Tax rate reductions had spurred sufficient economic growth to both offset their costs and increase revenue substantially beyond prior years at higher tax rates, there would likely be a strong, consistent correlation between Business Profits Tax rates and either economic or employment growth. This research did not find such a relationship.
The rates of the Business Profits Tax and the Business Enterprise Tax do not appear to be deterministic regarding the direction of New Hampshire’s economy, but are key revenue sources for funding public services. Balanced budget requirements result in policy outcome tradeoffs for each dollar of revenue raised or deployment of dollars spent on services. Policymakers seeking to use resources for the benefit of Granite Staters and their local economy may seek to consider reductions in taxes that more directly impact New Hampshire residents with low and moderate incomes, or increases in services that support Granite State families and individuals in a manner that supports the workforce and more directly keeps resources in the local economy.
Endnotes
[1] See the Pew Research Center, How States Raise Their Tax Dollars, FY2021, updated April 28, 2023. See also The Tax Foundation, Unpacking the State and Local Tax Toolkit: Sources of State and Local Tax Collections (FY 2020), August 25, 2022.
[2] For more information on the Business Profits Tax and the Business Enterprise Tax, see NHFPI’s May 2017 publication Revenue in Review: An Overview of New Hampshire’s Tax System and Major Revenue Sources. See also NHFPI’s presentations from August 10, 2022, How Public Services are Funded in New Hampshire at the State and Local Levels, January 17, 2023, New Hampshire State Revenues and the Economy, and April 19, 2023, The New Hampshire Economy and State Revenues.
[3] For a history of Business Profits Tax and Business Enterprise Tax rate changes, see the New Hampshire Department of Revenue Administration’s 2022 Annual Report, pages 50-57.
[4] Information not specifically cited in the introductory paragraphs is supported by citations in subsequent sections of this Issue Brief.
[5] For more discussion, see the Tax Policy Center’s Briefing Book chapters How Do Taxes Affect the Economy in the Long Run? and Do Tax Cuts Pay for Themselves?, accessed May 2023.
[6] Read the entire testimony at the Tax Policy Center’s website, Tackling the Tax Code: Evaluating Fairness, Efficiency, and Potential to Spur Inclusive Economic Growth, June 22, 2022, presented to the House Select Committee on Economic Disparity and Fairness in Growth.
[7] See the Tax Foundation’s May 10, 2013 discussion Do Tax Cuts Pay For Themselves?
[8] See the U.S. Congressional Research Service, Taxes and the Economy: An Economic Analysis of the Top Tax Rates Since 1945 (Updated), December 12, 2012.
[9] See Moody’s Analytics, The Biden Fiscal Rescue Package: Light on the Horizon, January 15, 2021. See also NHFPI’s March 2023 blog post Households with High Incomes Disproportionately Benefit from Interest and Dividends Tax Repeal.
[10] For more details and policy options analyzed, see the Center on Budget and Policy Priorities, The Financial Crisis: Lessons for the Next One, October 15, 2015.
[11] For the full analysis of potential economic multipliers and modeling, see the U.S. Congressional Budget Office, Estimated Impact of the American Recovery and Reinvestment Act on Employment and Economic Output in 2014, February 2015.
[12] See the November 2011 testimony from the Director of the Congressional Budget Office Policies for Increasing Economic Growth and Employment in 2012 and 2013 for estimates on employment effects from selected policy options, particularly Figure 1.
[13] See the November 2011 testimony from the Director of the Congressional Budget Office Policies for Increasing Economic Growth and Employment in 2012 and 2013 for estimates on employment effects from selected policy options. See also the Congressional Budget Office’s September 2020 report The Effects of Pandemic-Related Legislation on Output and the February 2023 The Budget and Economic Outlook: 2023 to 2033, Box 2-1.
[14] See The Relationship Between Taxes and Growth at the State Level: New Evidence as published during December 2015 in the National Tax Journal.
[15] For the final abstract, see The Journal of Politics, Volume 27, Number 2, April 2014 Taxes, Incentives, and Economic Growth: Assessing the Impact of Pro-business Taxes on U.S. State Economies. For a full pre-published draft, see the Social Science Research Network’s publication of the American Political Science Association’s 2012 National Meeting Taxes, Incentives, and Economic Growth: Assessing the Impact of Pro-business Taxes on U.S. State Economies.
[16] For the final abstract, see Journal of Political Economy, Volume 127, Number 3, June 2019 State Taxation and the Reallocation of Business Activity: Evidence from Establishment-Level Data. For a full pre-published draft, see the Hoover Institution’s Economics Working Papers State Taxation and the Reallocation of Business Activity: Evidence from Establishment-Level Data, February 2016.
[17] See the journal article The Effect of State Corporate Income Tax Rate Cuts on Job Creation in the July 2013 (Vol. 48, No. 3) publication of Business Economics.
[18] See National Bureau of Economic Research Working Paper 20753, To Cut or Not to Cut? On the Impact of Corporate Taxes on Employment and Income, December 2014, Revised October 2018.
[19] See the European Economic Review, Volume 147, Do Corporate Tax Cuts Boost Economic Growth?, August 2022.
[20] Read the full set of conclusions and recommendations from the Commission to Study Business Taxes, Final Report, October 2014 on the State of New Hampshire’s website.
[21] See the Council on State Taxation’s Total State and Local Business Taxes, State-by-State Estimates for FY21, December 2022, Table A3 and the Council on State Taxation analysis of fiscal year 2016 tax revenues for the prior methodological note of incorporating Business Enterprise Tax revenues into the corporate income tax calculations.
[22] See the Center on Budget and Policy Priorities, Cutting State Corporate Income Taxes is Unlikely to Create Many Jobs, September 14, 2010. The two states that constructed models finding 16 percent of lost tax revenue would be recouped were California and Oregon.
[23] See NHFPI’s May 2019 Issue Brief Funding the State Budget: Recent Trends in Business Taxes and Other Revenue Sources. See also NHFPI’s March 2022 blog post Proposed Business Profits Tax Reduction Benefits Limited for All But The Most Profitable Businesses and NHFPI’s April 19, 2023 presentation The New Hampshire Economy and State Revenues.
[24] See the Center on Budget and Policy Priorities, Cutting State Corporate Income Taxes is Unlikely to Create Many Jobs, September 14, 2010.
[25] For more information, see the New Hampshire Department of Revenue Administration’s 2022 Annual Report, page 47. See also NHFPI’s March 2022 blog post Proposed Business Profits Tax Reduction Benefits Limited for All But The Most Profitable Businesses. The description of Water’s Edge and associated filers by type pie graph was revised on November 1, 2023 to clarify that not all Water’s Edge filers must have international activities to file as a Water’s Edge combined reporting business.
[26] See the Center on Budget and Policy Priorities, Cutting State Corporate Income Taxes is Unlikely to Create Many Jobs, September 14, 2010.
[27] For the full research results, as revised in 2016, see the National Bureau of Economic Research Working Paper 20289: Who Benefits from State Corporate Tax Cuts? A Local Labor Markets Approach with Heterogeneous Firms.
[28] For supporting research and more information about the Tax Policy Center’s modeling, see the Tax Policy Center, Briefing Book, Who Bears the Burden of the Corporate Income Tax? As updated May 2020.
[29] For more insight into existing research on within-firm wage effects of corporate tax rate changes, see the Tax Policy Center, Rethinking the Incidence of the Corporate Income Tax, May 10, 2022.
[30] See the Center on Budget and Policy Priorities, Corporate Rate Increase Would Make Taxes Fairer, Help Fund Equitable Recovery, May 25, 2021.
[31] See the Center on Budget and Policy Priorities, Corporate Rate Increase Would Make Taxes Fairer, Help Fund Equitable Recovery, May 25, 2021.
[32] See NHFPI’s May 2022 blog post Newly Expanded Low and Moderate Income Homeowners Property Tax Relief Program Open for Applications.
[33] For more on State Balanced Budget Requirements, see the Tax Policy Center’s November 28, 2017 report Balanced Budget Requirements: How States Limit Deficit Spending.
[35] See the RAND Corporation’s 2019 analysis Advancing Investments in the Early Years: Opportunities for Strategic Investments in Evidence-Based Early Childhood Programs in New Hampshire and 2017 study Investing in the Early Years: The Costs and Benefits of Investing in Early Childhood in New Hampshire.
[36] For more information and analysis of other policies, see Opportunity Insights, A Unified Welfare Analysis of Government Policies, July 2019.
[37] For a history of Business Profits Tax rate changes, see the New Hampshire Department of Revenue Administration’s 2022 Annual Report, pages 50-54.
[38] Figure reported by the New Hampshire Department of Revenue Administration, and is representative of the number of businesses, but not necessarily the percentage of revenue paid. See NHFPI’s May 2019 Issue Brief Funding the State Budget: Recent Trends in Business Taxes and Other Revenue Sources and September 2019 Issue Brief Business Tax Revenue and the State Budget.
[39] Access the State of New Hampshire’s Annual Comprehensive Financial Reports on the New Hampshire Department of Administrative Services website.
[40] Receipts based on State Annual Comprehensive Financial Reports. Meals and Rentals Tax receipts include municipal revenue sharing for SFY 2022, which was diverted away from the General Fund, but do not include revenues devoted to RSA 78-A, I(a). Real Estate Transfer Tax revenues for SFY 2022 include the $5 million distribution to the Affordable Housing Fund per RSA 78-B:13, III.
[41] See NHFPI’s May 2019 Issue Brief Funding the State Budget: Recent Trends in Business Taxes and Other Revenue Sources. Additional information provided by the Department of Revenue Administration, including the Department’s presentation to the House and Senate Ways and Means Committees in the January 11, 2023 Joint Economic Briefing.
[42] For Tax Year data split between the Business Profits Tax and the Business Enterprise Tax, see the New Hampshire Department of Revenue Administration’s Annual Reports.
[43] For aggregate wage data, see the U.S. Bureau of Labor Statistics Quarterly Census of Employment and Wages and New Hampshire Employment Security’s Annual Census of Employment and Wages, which use the same underlying data and similar methodologies, although they are presented on different timescales that require conversion.
[44] See New Hampshire Employment Security’s New Hampshire Occupational Employment and Wages 2021, published September 2021.
[45] See NHFPI’s May 2017 publication Revenue in Review: An Overview of New Hampshire’s Tax System and Major Revenue Sources, page 6.
[46] For the data used in this analysis, see the Annual Reports published by the New Hampshire Department of Revenue Administration. Note all BPT and BET figures published by Tax Year in the Department’s Annual Reports are draft figures and are subject to subsequent revisions. Data used in this report were those available as of the publication date.
[47] Data for this analysis were collected in July 2023 from New Hampshire Employment Security’s GraniteStats data interface, and the analysis employed a four-quarter rolling average of the counts of worksites in the Quarterly Census of Employment and Wages to match the State Fiscal Year timeframes. Combined BPT and BET revenue data were collected from the New Hampshire Annual Comprehensive Financial Reports.
[48] For NHFPI’s 2019 analysis that examined these trends, see NHFPI’s May 2019 Issue Brief Funding the State Budget: Recent Trends in Business Taxes and Other Revenue Sources. See also NHFPI’s analysis of the post-Great Recession economy in a June 2018 Issue Brief New Hampshire’s Economy: Strengths and Constraints.
[49] For more information about the base-broadening provisions of the Tax Cuts and Jobs Act, see the Tax Policy Center, Effects of the Tax Cuts and Jobs Act: A Preliminary Analysis, June 13, 2018. New Hampshire conformed to the federal tax code for the purposes of the Business Profits Tax beginning in Tax Year 2020; see Chapter 346:251, Laws of 2019 and NHFPI’s December 2019 Issue Brief The State Budget for Fiscal Years 2020 and 2021.
[50] For NHFPI’s 2019 analysis that analyzed the rise in revenue in 2018, see NHFPI’s May 2019 Issue Brief Funding the State Budget: Recent Trends in Business Taxes and Other Revenue Sources.
[51] To see these data, see the U.S. Census Bureau’s Annual Survey of State Government Finances data tables, accessed May 2023.
[52] For more information on federal stimulus and impacts on the economy, see NHFPI’s December 6, 2022 presentation Federal Pandemic-Related Funding in New Hampshire: Impacts, Opportunities, and Benefits and NHFPI’s May 10, 2022 blog Significant Revenue Surplus Largely Generated by Business Taxes in Federally-Boosted Economy. See also Moody’s Analytics February 24, 2022 analysis Global Fiscal Policy in the Pandemic and the Brookings Institution Hutchins Center Fiscal Impact Measure, updated April 28, 2023.
[53] See analysis from the Federal Reserve Bank of St. Louis on The FRED Blog, Corporate Profits are Increasing Rapidly Despite Increases in Production Costs, July 18, 2022 and the Economic Policy Institute’s March 30, 2023 blog Even with Today’s Slowdown, Profit Growth Remains a Big Driver of Inflation in Recent Years.
[54] Analysis based on data from the U.S. Bureau of Economic Analysis, Corporate Profits with Inventory Valuation Adjustment (IVA) and Capital Consumption Adjustment (CCAdj) [CPROFIT], retrieved from FRED, Federal Reserve Bank of St. Louis on May 23, 2023.
[55] For more information on the apportionment formula, see NHFPI’s June 2021 Issue Brief The Senate’s Budget Proposal for State Fiscal Years 2022 and 2023. See also the New Hampshire Department of Revenue Administration’s June 19, 2017 presentation Market Based Sourcing and Singles Sales Factor Analysis and the New Hampshire Postponement and Rescheduling of a Rulemaking Hearing, Notice Number 2022-85. Read more about apportionment and considerations in the Vermont Legislative Counsel and Joint Fiscal Office’s October 15, 2021 presentation Corporate Income Taxes.
[56] To access these data, see the U.S. Census Bureau’s Annual Survey of State Government Finances data tables, accessed May 2023. For more information about increases in state corporate tax revenues nationwide, see the Urban Institute’s August 2022 report State Tax Revenues Still Strong, But for How Long? and May 2023 report Continued Weakness and Variability in State Tax Revenues.
[57] To see these data, see the U.S. Census Bureau’s Annual Survey of State Government Finances data tables, accessed May 2023. Connecticut was a key driver of the increase in New England corporate tax revenues during this period. However, corporate tax rates across the New England states appeared to be fairly stable between 2015 and 2021, although tax bases may have changed in this period.
[58] See NHFPI’s May 2019 Issue Brief Funding the State Budget: Recent Trends in Business Taxes and Other Revenue Sources. See also NHFPI’s March 30, 2022 blog Proposed Business Profits Tax Reduction Benefits Limited for All But The Most Profitable Businesses.
[59] This decision reflects caution urged by the U.S. Bureau of Economic Analysis regarding use of these data. See Cautionary Note About Annual GDP by State Discontinuity.
[60] For examples and more discussion of testing statistical significance, see the October-December 2011 issue of the Indian Journal of Urology, Understanding Results: P-values, Confidence Intervals, and Number Need to Treat and the September 2016 issue of the Journal of Thoracic Disease, P Value Interpretations and Considerations. See also the U.S. Census Bureau, A Basic Explanation of Confidence Intervals, and NHFPI’s October 26, 2017 blog Interpreting the Significance of the October County Census Data Release.
[61] In 2022, New Hampshire’s private sector Gross State Product was 8.1 percent of the New England region’s combined Gross Domestic Product. New England includes Connecticut, Maine, Massachusetts, New Hampshire, Rhode Island, and Vermont.
[62] Relative to the differential between U.S. Gross Domestic Product growth overall and private sector Gross State Product Growth in New Hampshire and BPT rates, during 1970 to 1997, p=17.0% and R2=7.1%, and during 1998 to 2022, p=44.2% and R2=2.6%.
[63] See the U.S. Bureau of Labor Statistics BLS Data Viewer and New Hampshire Employment Security’s GraniteStats portal. Data from 1939 to 1989 benchmarked in 2004, and 1990 to 2022 benchmarked in 2022.
[64] U.S. Bureau of Labor Statistics, All Employees, Total Nonfarm [PAYEMS], retrieved from FRED, Federal Reserve Bank of St. Louis, May 23, 2023.
[65] See the University of New Hampshire, Carsey School of Public Policy’s What is New Hampshire: Demography resource showing historical population growth by decade.
[66] Private sector wages in the Quarterly Census of Employment and Wages data include private non-profit employment that is not taxed by the BET.
[67] A possible exception to this difficulty would be the Insurance Premium Tax, which interacts with the two primary business taxes in various parts of State law; for example, a lower BET liability could translate into higher Insurance Premium Tax liabilities. See NHFPI’s May 2017 publication Revenue in Review: An Overview of New Hampshire’s Tax System and Major Revenue Sources, page 20.
[68] The only impact the tax base changes may have on the modeling is the boost in the BET filing threshold in Tax Year 2022. This change was expected to reduce BET revenues by $3.1 million during the SFYs 2022-2023 biennium. This change may impact the assumed split between BET and BPT revenues for Tax Year 2022 generated by modeling in this analysis, which could alter the calculations of the impacts of rate reductions on tax revenues by a small amount. For more information on the BET threshold change, see NHFPI’s August 2021 Issue Brief The State Budget for Fiscal Years 2022 and 2023.
[69] The imputation of 2022 Q4 was conducted using an average of the total wages paid in the prior three quarters. Monthly data from the Current Employment Survey, which is less precise but more timely than the Quarterly Census of Employment and Wages data, show a slight increase in employment between 2022 Q3 and 2022 Q4 in New Hampshire. Average wages paid in 2022 Q4 matching the average of 2022 Q1-Q3 is likely to be near to the actual number, with a higher risk that estimated wages using this method are lower than actual wages paid. This risk would lead to lower revenue projections for the BET, and reduce the amount of revenue estimated to be lost in this modeling.
[70] See the Fiscal Notes for Senate Bill 135 of the 2019 Legislative Session and House Bill 10 of the 2021 Legislative Session. For both SFYs 2018 and 2020, the figures were very similar despite the disruptions of the pandemic in SFY 2020. This analysis used an average of those estimates, which resulted in estimating that 14 percent of State Fiscal Year business tax revenues were from the Tax Year two years prior, 63.5 percent were from the prior Tax Year, and 22.5 percent were from the same numbered Tax Year as the State Fiscal Year. See also the Fiscal Note from House Bill 15 of the 2023 Legislative Session. Notably, this estimation strategy produced somewhat higher total revenues that those published by the Department of Revenue Administration for Tax Years 2018, 2019, and 2020, particularly for Tax Year 2020. The differences may be due to the timing of refunds relative to State Fiscal Years already reported, or certain impacts associated with the timing of tax payments associated with the pandemic. Attempts at other estimation strategies using monthly cash receipts data did not appear to produce more reliable results on a theoretical basis or practically.
[71] See the State of New Hampshire Annual Comprehensive Financial Report for SFY 2022.
[72] To test this estimation methodology, revenues were reconstructed for Tax Years 2018, 2019, and 2020. The estimation method produced figures that, relative to the draft figures reported by the Department of Revenue Administration, were 2.4 percent high in 2018, 4.8 percent high in 2019, and 31.2 percent high in 2020. These differences suggest that pandemic-related impacts may have complicated the timing of calculations for State Fiscal Year and Tax Year receipts in 2020, and that the Tax Year data published by the Department of Revenue Administration may have a more complete accounting of refunds, credits carried forward, or other adjustments than the receipts reported for each State Fiscal Year. The data for Tax Year 2020 were published as draft data as of July 19, 2022. As noted previously, attempts at other estimation strategies using monthly cash receipts data did not appear to produce more reliable results on a theoretical basis or practically. For the New Hampshire Senate Ways and Means Committee’s estimates, see the Office of Legislative Budget Assistant’s May 10, 2023 document Senate Ways and Means and House Passed General Fund and Education Trust Fund Estimates. See the cash basis revenues for SFY 2023 from the June SFY 2023 Monthly Revenue Focuspublished by the New Hampshire Department of Administrative Services. From SFYs 2015 to 2022, the average error rate between the final audited numbers and the cash basis figures first reported for combined BPT and BET revenues was -1.1%, and the average of the absolute value of the error rates was 2.5%.
[73] See the New Hampshire 10-Year Mental Health Plan, published January 2019.
[74] Learn more about the Statewide Education Property Tax in NHFPI’s May 11, 2021 blog post Statewide Education Property Tax Change Provides Less Targeted Relief.
[75] For agency budget totals, see the Governor’s Executive Budget Summary for Fiscal Years ending June 30, 2024-2025, page 20.