State funding for local public education in New Hampshire comprises a significant component of both the State Budget and local public school budgets, and is the primary method through which resources for local public education are shared statewide. Federal funding typically constitutes a relatively small portion of school budgets, and locally-raised revenue, almost entirely from property taxes, is the source for most local public school funding in New Hampshire.[1] The Legislature established the Commission to Study School Funding to better understand the consequences of this funding system, with particular regard to the equity of student outcomes, and offer recommendations for improvements.
The Commission’s recommendations, issued in a December 2020 report, included a substantial proposed revision to the education funding formula. The proposed formula was developed based on statistical research examining student outcomes at New Hampshire school districts relative to the characteristics of the school districts and their students. This revised formula would substantially boost the amount of money granted on a per pupil basis to all students as part of the State’s Adequate Education Aid for public schools, and would have raised the base per pupil amount from about $3,636 to $5,868 for the 2018-2019 school year. The formula would also substantially boost maximum potential State funding levels for students with special education needs, students learning English as a new language, and students with low incomes enrolled in the free and reduced-price meal program, as well as for smaller school districts and for those districts with more students at certain grade levels.
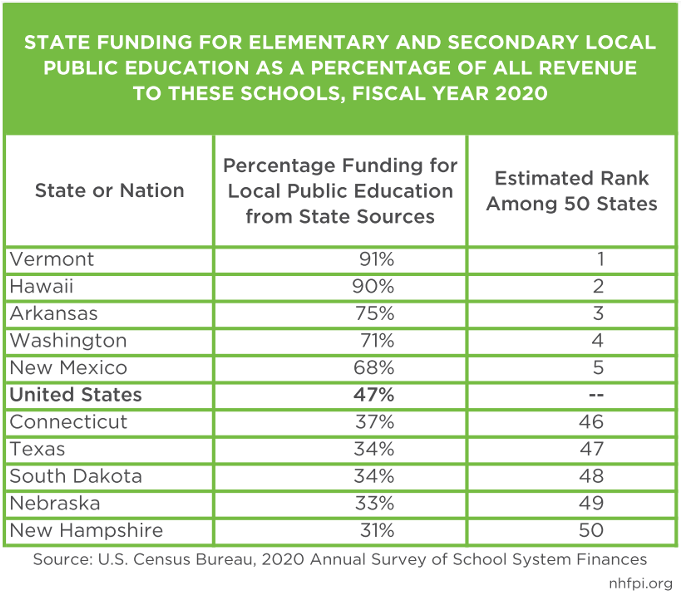
The new formula would have increased the amount of money the State would have provided in Adequate Education Aid by nearly $2 billion in the 2018-2019 school year, an approximately 209 percent increase statewide over actual levels that year. While that increase is very substantial, New Hampshire has the lowest percentage of State funding as a portion of all public elementary and secondary school revenue of any state, and ranks 48th of the 50 states in the dollar amounts of State per pupil education funding after adjusting for statewide personal income, according to the most recent interstate data available. If the proposed formula had been in place during the 2018-2019 school year, prior to any of the impacts of the pandemic, smaller school districts would have seen substantial increases in funding, as would have communities with larger numbers of students from households with low incomes. Thirteen of the fifteen school districts that served the highest percentages of student populations of color would have seen a percentage increase in funding to their communities larger than the overall increase statewide.
This Issue Brief examines recommendations from the Commission to Study School Funding’s December 2020 report to understand their potential impacts on State education funding equity in New Hampshire. This Issue Brief includes new NHFPI analysis, based in part on different and certain updated enrollment data, of the Commission’s recommendations with regard to community characteristics, relative increases, and student populations. This analysis primarily uses education aid data from the 2018-2019 school year, prior to the impacts of the pandemic on enrollment counts and the free and reduced-price meal program. This Issue Brief describes the potential impacts of components of the recommended funding changes relative to schools educating more students from underserved backgrounds, including those identifying as a member of a racial or ethnic minority group in New Hampshire and those with fewer financial resources at home.
The Commission to Study State Funding
As a component of the State Budget passed in 2019, the State Legislature established the Commission to Study School Funding. The Commission was comprised of both legislators and members of the public, and contracted with external experts to perform analysis. Among other duties, the Commission was required to:
- review the State funding formula for local public education and make recommendations to ensure a uniform and equitable design for financing the cost of an adequate education,
- determine whether that formula complied with legal obligations determined by court decisions requiring revenue sources that are uniform across the state,
- identify disparities in student performance,
- re-establish baselines for understanding costs for an adequate education, and
- consider other policy areas.[2]
The Commission to Study School Funding released its final report on December 1, 2020.[3] The Commission’s report was informed by contract work conducted by the American Institutes for Research (AIR). Among other findings, AIR’s analysis of education funding in New Hampshire determined that the “state’s current system is inequitable from both student and taxpayer perspectives” and “[d]istricts with higher incidences of economically disadvantaged students, students in special education, and more English language learners performed worse on average than those with fewer students with those characteristics.”[4] The Commission and AIR also found that school districts with the highest needs in New Hampshire have less revenue, and this disparity in funding was greater in New Hampshire than in any other New England state. In AIR’s modeling, only the Vermont and Massachusetts funding systems supplied more combined state and local revenue to districts with higher needs than to those with lower needs among the New England states.
The AIR analysis found that districts with lower student enrollments, and districts with higher levels of student need, required more resources to achieve the same student outcomes. Based on this analysis of New Hampshire data, AIR developed a cost model for constructing a funding formula that incorporates key district-level variables, targeted at achieving a certain level of outcomes and based on New Hampshire data for the 2018-2019 school year.
The Commission found that the “current public school funding system should be reformed to include increased state budget funds that are directed to communities that have greater student needs, which will also result in greater taxpayer equity by reducing disproportionate burdens on poorer towns.”[5] Alongside other reforms, including reforms to raise more revenue at the State level, the Commission recommended using multipliers from the AIR outcome-based cost model in the implementation of a new funding formula. These multipliers are designed to change the relative weighting of each component in the education funding formula. The Commission’s recommendations would substantially increase the share of education funding to local governments generated by the State in aggregate relative to the current education funding formula. The Commission found that, according to U.S. Census Bureau data from fiscal year 2018, New Hampshire had the lowest percentage of state funding for local public education of any state in the country.
NHFPI analysis of fiscal year 2020 U.S. Census Bureau data, the most recent available, also found that New Hampshire had the smallest percentage of local public education revenue coming from the state government of any state in the country. These data, derived from a 2020 survey of school finances, estimated that New Hampshire ranked 8th among the 50 states for total revenue per pupil for elementary and secondary schools, but 35th among states for per student revenue from state governments. New Hampshire ranked 3rdamong the 50 states for local government revenue per pupil, behind New York and Connecticut, which substantially raised the ranking of total revenue from all sources per pupil. The U.S. Census Bureau reported that, per $1,000 of personal income in each state, New Hampshire ranked 35th in total elementary and secondary education revenue, but 48th in state revenue, behind Arizona and ahead of South Dakota and Florida. New Hampshire elementary and secondary public schools had about $12.18 in State revenue per every $1,000 of personal income in New Hampshire, compared to a national figure of $19.69 from state governments per $1,000 of personal income.[6]
Potential Impacts of the Commission's Revised Formula Multipliers
The Commission’s recommendations incorporated many different aspects of education funding, evaluation, and initiatives, but a core and specific recommendation included adding new and different multipliers for assigning appropriations in the education funding formula. The New Hampshire Department of Education provides 2017-2018 school enrollment data that were used as a basis for funding in the 2018-2019 school year. That school year was completed prior to the impacts of the COVID-19 pandemic, which both reduced enrollment sharply (which was followed by a small increase in the subsequent year) and made traditional measures of free and reduced-price meal enrollment less reliable, as more families were able to access free meals through their school district under emergency measures designed to reduce child food insecurity.[7] This Issue Brief uses those 2017-2018 data to understand the potential impacts of the revised formula multipliers on State funding for local public education relative to State Fiscal Year (SFY) 2019 levels.
The multipliers recommended by the Commission are not directly comparable to the existing education funding formula, but relative comparisons do show the mechanisms through which the Commission’s recommendations would boost State funding for local public education.
Both the Commission’s model and the existing State education funding formula rely on counts of pupils in school districts and the characteristics of those children. During State Fiscal Year (SFY) 2019, the State provided a base Adequate Education Grant, or the amount of aid for a full-time year-round student without any characteristics that trigger additional aid, of $3,636.06 per student.[8]However, following AIR cost analysis using data from the 2018-2019 school year, the Commission recommended a base amount of $5,868.
The Commission recommended constructing additional, or differentiated, aid based on student characteristics in a different manner than the current education funding formula. Three of the differentiated aid categories in the current education funding formula were included in the Commission’s recommendations: free and reduced-price meal eligibility, special education, and English-language learners. The SFY 2019 education funding formula added $1,818.02, $1,956.09, and $711.40 to the base per pupil amount for each of the students who fall into these categories, respectively. The Commission recommended that, rather than providing this aid on a per pupil basis, a fixed multiplier be used for each category and the percentage of the total district population that meets the qualification for each category.
For example, the multiplier, which effectively serves as a weight for the formula variable, recommended by the Commission for free and reduced-price meal eligibility is 1.49; this multiplier indicates that the modeled estimates to achieve the same academic opportunity outcomes costs a school district about 149 percent more for a free and reduced-price meal eligible student than one who is otherwise identical but is not free or reduced-price meal eligible. If all the students in a school district are eligible for free and reduced-price school meals, then the school district would receive $8,751 for each student alongside the base aid of $5,868. However, if half the students are free and reduced-price meal eligible, then the aid per student in the district would adjust upward by $4,375.50 in addition to the $5,868.
The Commission also recommended multipliers of 4.29 for special education and 2.2 for English-language learners. The Commission did not recommend, however, that differentiated aid or a multiplier exist for scoring below proficient on a third grade reading test, although that is a differentiated aid category in the current education funding formula.
Two new types of differentiated aid multipliers were recommended in the Commission’s analysis. First, the Commission recommended adding factors for smaller school districts to the formula, including districts that serve up to 2,000 students and with increasing multipliers for smaller districts, effectively sending more aid to those small districts. Schools with fewer than 201 students would have a multiplier of 1.08 per student, while districts with 201-600 students (0.57 multiplier), 601-1,200 (0.43 multiplier), and 1,201-2,000 (0.24 multiplier) would have smaller additional amounts added to their costs. Districts serving more than 2,000 students had no additional funding (a multiplier of 0). The Commission also recommended sending additional aid to middle and high school students, with multipliers of 1.42 for the percentage of middle school (grades 6-8) enrollment and 0.42 for high school enrollment.[9] The Commission explored models where transportation costs are either included or excluded in the cost model as well; all figures discussed in this Issue Brief include transportation costs.[10]
The boosted base and additional multipliers recommended by the Commission would require substantially more revenue to flow from the State to school districts, in a more targeted fashion, to better enable more equitable student outcomes across the state. AIR’s calculated increase in Adequate Education Aid through the boosted per pupil amounts generated statewide by the recommended funding changes would have been approximately $2.0 billion in Adequate Education Grants more than the State actually provided in SFY 2019.[11] However, the AIR modeling indicated this enhanced amount of aid from the State through this cost-based formula and the resulting expenditures would be less than two percent different from total expenditures, including money raised through both State and local funds, than the actual revenues and expenditures in New Hampshire during that year.[12]
Applying the Proposed Formula to School Funding
To examine the potential outcomes of this policy proposal, NHFPI used the formula multipliers and the most recently published versions of relevant data to estimate the impacts of these multipliers and new differentiated aid categories on education funding. The municipal level funding estimates were produced using the finalized versions of older data to show the municipal-level changes as if the revised multipliers recommended by the Commission were in place for SFY 2019, or the 2018-2019 school year. As a result, the attendance-based measures are rooted in student enrollment during the 2017-2018 school year. This analysis also differs from the AIR analysis by using individual grade-level enrollment published by the New Hampshire Department of Education, with final data posted in April 2022. This use of 2017-2018 grade-level enrollment permits more standardized definitions of middle school and high school enrollment for the multipliers in the formula. As a result, NHFPI’s final numbers by municipality and aggregate numbers are somewhat different from the AIR modeling.[13]
In NHFPI’s analysis, the proposed formula would have resulted in about $2.83 billion in appropriations for SFY 2019. This total is more than $1.91 billion above the amount that was actually appropriated under the formula in statute at the time, but smaller than the approximately $2.0 billion estimated increase resulting from AIR’s modeling based on somewhat different underlying data and adjustments. The total statewide increase over the actual funding levels, based on NHFPI analysis, would have been 209 percent.
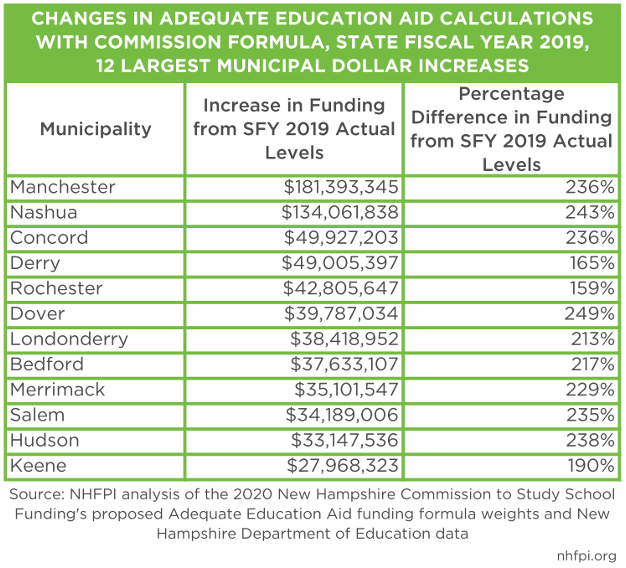
That increase would not have been uniformly distributed among communities. As the Commission’s report states, “[t]he formula results in a distribution of funding that provides more resources for high-need districts, recognizing the higher cost of education in these districts compared to lower-need districts.”[14] The changes in the formula would have led to increases in education funding allocated for almost all municipalities, and would have provided the most significant dollar boosts for some of the most populous school districts in the state. The per pupil base finding increase from $3,636.06 to $5,868 per student is a driving contributor in this analysis, but other parts of the formula, including free and reduced-price meal eligibility, would add substantially to the sizes of the grants in the simulations. For example, Bedford had the third-highest number of resident students enrolled of any municipality in the state, but ranked 44th in the state for the number of free and reduced-price meal eligible students.[15] As a result of this and other differences, Bedford’s increase would have been substantial, with a $37.6 million (217 percent) estimated increase; the next-smallest municipality in total school district enrollment, Concord, would have received a $49.9 million (236 percent) increase in this education funding model. The school districts receiving the largest boosts in funding, based on this modeling for the SFY 2019 school year, would have been Manchester ($181.4 million), Nashua ($134.1 million), Concord ($49.9 million), Derry ($49.0 million), and Rochester ($42.8 million).
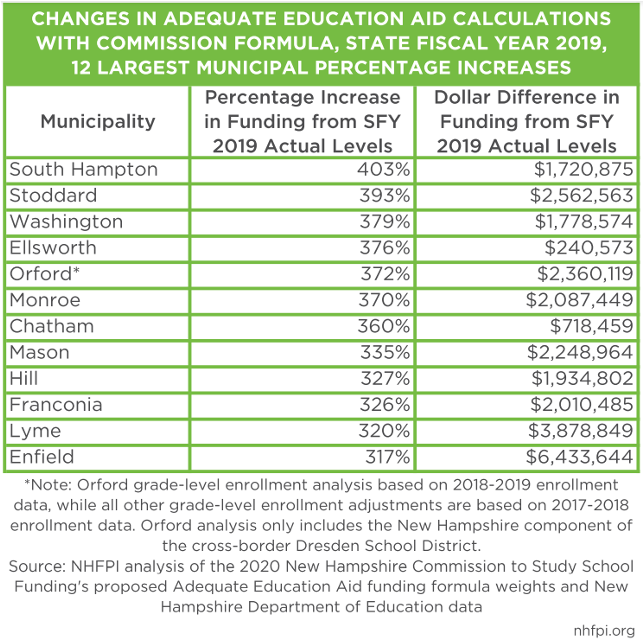
Percentage changes in funding reveal the funding shifts that would be spurred by the proposed formula’s consideration of school district size in per pupil funding. Municipalities that send their students primarily or entirely to public school districts that serve a small number of students would receive a funding boost relative to larger districts. These relatively small school districts include a mix of locations, including small suburban communities in the southern tier and rural areas from northern and western parts of the state. While the percentage changes in Adequate Education Aid calculations are significant in these communities, including South Hampton’s 403 percent increase, the dollar changes are small compared to the appropriation changes for larger communities; for example, South Hampton’s large percentage increase is generated by a $1.72 million increase in dollar funding relative to actual SFY 2019 levels.
Some communities would have substantially smaller increases in funding under the Commission’s proposed formula, without other changes to funding structures. Using the base funding and multipliers proposed by the Commission, 15 communities would have been allocated increases that would have been less than 100 percent, substantially smaller than the 209 percent statewide increase, compared to the SFY 2019 actual appropriations. On either edge of the range of funding for these 15 communities, Wolfeboro and Rye would have received 96 percent and 94 percent more funding, respectively, and New Castle and Waterville Valley would have received funding increases of approximately 7 percent each. Additionally, four communities would have seen less funding from the recommended formula without any other adjustments. These four communities (Newington, Millsfield, Hart’s Location, and Hale’s Location) all have a relatively small number of students compared to the property values within the community, and as a result, generate excess revenue through the local implementation of the Statewide Education Property Tax. That tax revenue, which is raised and retained by the local governments to spend on education, technically contributes to State Adequate Education Aid totals, although it is rooted in the local property tax.[16]
Added Supports for Districts Serving More Students with Low Incomes
The Commission’s proposed formula, among other changes, boosts the relative amount of aid flowing to school districts with higher percentages of the total number of students eligible for free and reduced-price meals. The free and reduced-price meal program is commonly used as a proxy for poverty, as to be eligible, a student’s household income must be below 185 percent of the federal poverty guidelines, or they must receive benefits through the Supplemental Nutrition Assistance Program or the Temporary Assistance for Needy Families program; being a foster child, homeless, or meeting certain other criteria can also make a student eligible.[17]
The education funding formula used in SFY 2019 provided additional aid to school districts based on free and reduced-price meal eligibility, but provided these additional dollars on a per-student basis, rather than boosting funding on a per student basis for all students within the district. For each student eligible for free and reduced-price meals in SFY 2019, the State added a $1,818.02 appropriation to the Adequate Education Aid amount provided to local governments. The Commission’s formula would apply the multiplier of 1.49 to the base amount using the concentration of free and reduced-price meal eligible students. If 100 percent of the students were eligible for free and reduced-price meals, an additional 149 percent of the base per pupil amount of $5,868, or a total of $8,472, would be appropriated for every student enrolled. If 25 percent of the students are eligible for free and reduced-price meals, the increase would be $2,186 per student.
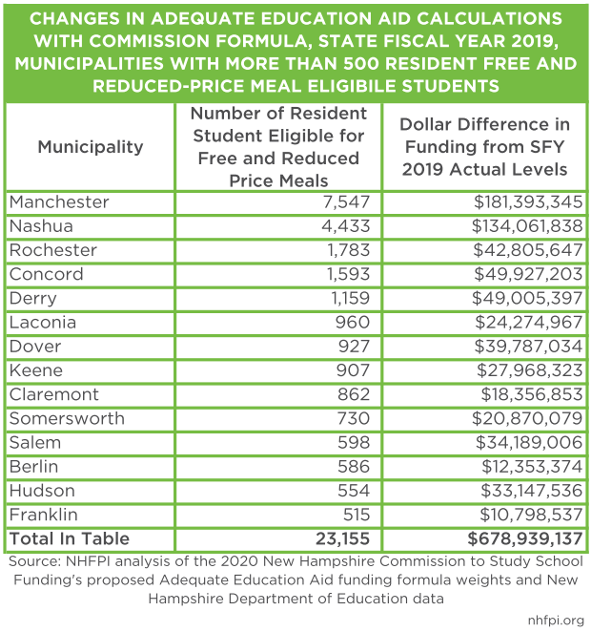
The municipalities that were home to at least 500 students eligible for free and reduced-price meals included 14 cities and towns from a combination of rural and urban areas. Collectively, these municipalities were home to 51 percent of all students identified as eligible for free and reduced-price meals statewide. If the Commission’s recommended formula had been in place for SFY 2019, Adequate Education Aid funding would have increased by about $678.9 million across these 14 municipalities, a 212 percent increase in total funding relative to actual SFY 2019 levels, slightly higher than the 209 percent increase in funding total. Notably, the funding increase to these communities accounts for 35 percent of the total funding increase that would have occurred with the formula change, reflecting the sizable appropriations to local governments based on other factors, such as school district size and special education populations.
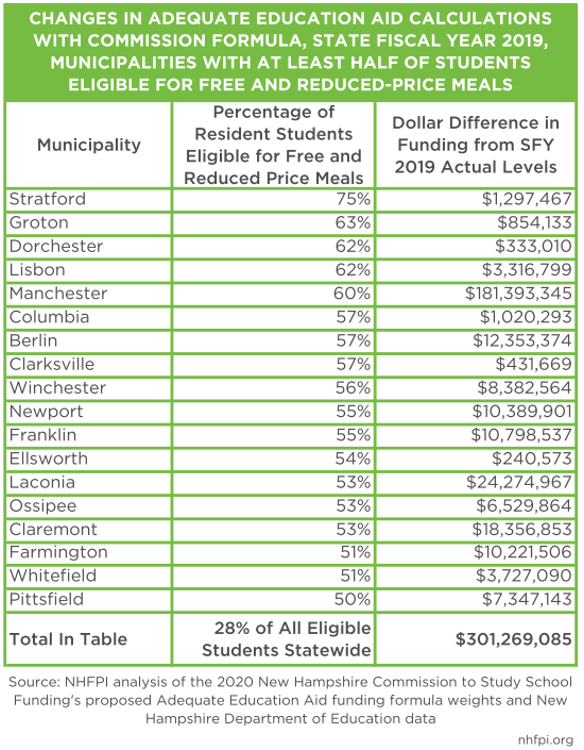
Communities with higher concentrations of free and reduced-price meal enrollment would also see significant investments, although not quite the percentage increase to communities overall. Municipalities in which at least half of students are eligible for free and reduced-price meals included 18 communities from throughout the state, including both rural and urban communities of widely varying population sizes. The free and reduced-price meal eligible students in these 18 communities represented approximately 28 percent of all students eligible for free and reduced-price meals statewide. In total, these communities would have received an additional $301.3 million, a 198 percent increase from the approximately $152.0 million these communities actually received during SFY 2019. While significant, this increase falls just short of the statewide percentage of 209 percent, showing other factors were also deploying other components of the statewide total increase to communities outside of this group as well.
The modeling conducted by AIR found that, with some variation among communities, the simulated formula increased funding for communities with higher free and reduced-price school meal eligibility.[18]
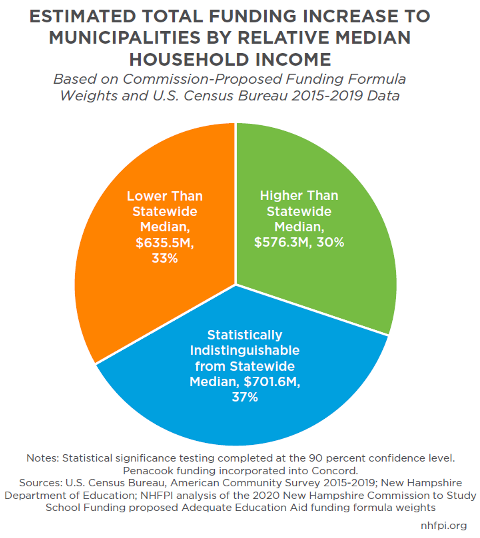
While free and reduced-price meal eligibility can provide some insight into the overall income levels within a community, other data provide indicators of the relative resources a community and its members have available to invest in their children. The U.S. Census Bureau conducts annual surveys of residents that include inquiries about income. Median household incomes are published for municipalities, but results from survey data, particularly in lower-population communities, are often limited by significant margins of error.[19] A simplified measure using these data compares the median household income of each community to the statewide median and divides all communities into three categories: higher than the statewide median, lower than the statewide median, and statistically indistinguishable from the statewide median. The last category typically includes communities that have small populations, resulting in larger margins of error stemming from more uncertainty, or those with median household incomes close to the statewide median.
The total $1.91 billion increase would have been distributed among these categories of communities relatively equally. However, those municipalities with median household incomes lower than the statewide median would have been allocated more funding in aggregate ($635.5 million) than those with higher median household incomes than the statewide median ($576.3 million). Municipalities with median household incomes statistically indistinguishable from the statewide median would have received the largest share of the increase ($701.6 million). These communities include Nashua, which would have had a $134.1 million increase in aid in these estimates. Nashua has a relatively high free and reduced-price meal-eligible population as well as a median household income near to the statewide median. More municipalities were also statistically indistinguishable from the statewide median (100) than were higher (60) or lower (78) than the statewide median household income.
Impacts on Districts Serving More Students of Color
Many Granite State students face structural and longstanding systemic barriers to success that can vary by both geography and racial identity. Students identifying as a member of a racial or ethnic minority group in New Hampshire are more likely than white students to face barriers to opportunity due to a higher propensity to experience more limited incomes and fewer financial resources at home. Almost a quarter of New Hampshire students were eligible for free and reduced-price meals in October 2019, but Black and Hispanic students were more than twice as likely to be eligible for free and reduced-price meals than students overall. While not a comprehensive measurement of the well-being of students, eligibility for free and reduced-price school meals is a key indicator of limited household income, and data analyzed by NHFPI show the families of Black, Hispanic, Native American, and multiracial students were disproportionately likely to have relatively few financial resources.[20]
While the New Hampshire Department of Education does not publish data by identified student race or ethnicity at a municipal-level, the Department does make these data available for school districts. School districts often cover several municipalities, and multiple different school districts can often serve students in the same municipality, such as in the cases of students attending high school in a different school district than for elementary or middle school.[21]
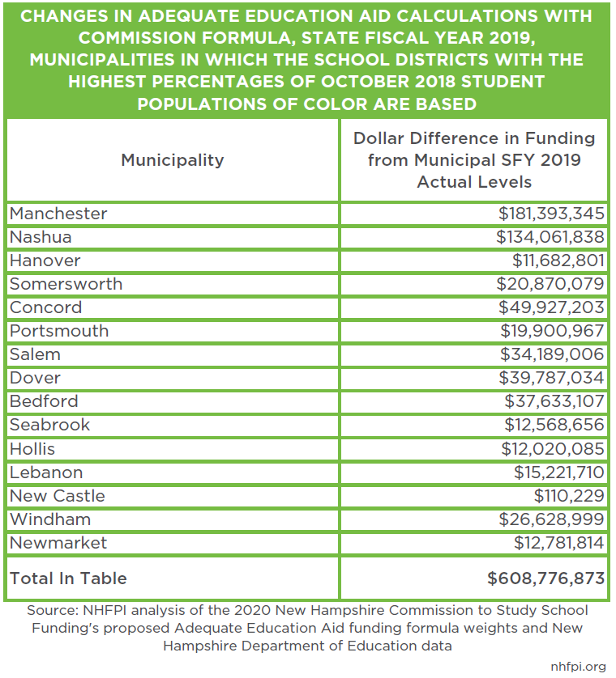
For additional insight into the impacts of the funding formula on school districts serving many students of color, estimated data for SFY 2019 funding changes at the municipal level can be matched with school district data in certain circumstances. The top sixteen school districts with the highest percentages of all attending students identifying as students of color were based in fifteen municipalities, serving primarily those municipal populations.[22]
These fifteen communities would have seen, in SFY 2019 under the Commission’s formula, a total increase of nearly $608.8 million in Adequate Education Aid. The school districts based in these communities accounted for about 60 percent of the total population of students of color in New Hampshire, according to the October 1, 2018 student enrollment count. Of these top fifteen communities, thirteen would receive a percentage increase in funding that exceeds the 209 percent statewide average.
Concluding Discussions
The State Legislature created the Commission to Study School Funding to evaluate the consequences of the current education funding system and examine its impacts on equitable student opportunities for success. The Commission produced a significant body of research to inform New Hampshire’s school funding discussions. The quantitative analyses, using New Hampshire-specific data, provide a framework for a research-informed funding structure to help support equitable outcomes. With other structural barriers keeping too many students from being able to access the same opportunities as other children, targeting State funding effectively among New Hampshire’s communities can help facilitate equitable opportunities and reduce financial disparities between school districts.
Examination of the proposed revised funding formula, a key component of the Commission’s recommendations, shows the likely benefits of targeting funds based on the Commission’s research. The outcomes-based modeling from AIR suggests New Hampshire state and local governments were, in aggregate and if distributed differently, devoting an appropriate amount of money to student education to potentially achieve more equitable outcomes, but that those investments in Granite State children have not been distributed in a manner that maximizes opportunities for positive outcomes for children and the value of these investments for the entire state.
The Commission’s recommendations would raise significantly more resources for local public education at the State level, and provide those dollars to local governments in a manner designed to enhance the opportunity for equitable outcomes. The Commission’s proposal to restructure the manner in which these public dollars are raised and distributed would provide substantially more State funding to almost all school districts, particularly those that serve more students facing structural barriers to success. Changes to State funding for local public education can help support the future success of children while promoting a more prosperous future for all Granite Staters.
Endnotes
[1] See NHFPI’s April 9, 2021 presentation Education Funding in New Hampshire: A Brief Overview.
[2] See Chapter 346:230, Laws of 2019.
[3] The Commission’s final report, Our Kids, Our Schools: Achieving Greater Equity for New Hampshire Students and Taxpayers, December 1, 2020, is used as a reference throughout this Issue Brief.
[4] For the full list of AIR findings, see page 23 of the Commission’s final report and the direct links to the AIR report on that page.
[5] See page 11 of the Commission’s final report for the findings and recommendations identified as most important by the Commission.
[6] For the data behind the rankings and analysis, see the U.S. Census Bureau’s 2020 Annual Survey of School System Finances.
[7] To access these data and examine total enrollment data by year, see the New Hampshire Department of Education’s Data Reports. For more information on the pandemic’s impacts of free and reduced-price school meal enrollment, see NHFPI’s August 2021 Issue Brief The State Budget for Fiscal Years 2022 and 2023.
[8] For more information on the calculations and figures behind the SFY 2019 education funding formula, see the New Hampshire Department of Education’s FY2019 Adequate Education Aid: How the Cost of an Opportunity for an Adequate Education is Determined, November 15, 2017.
[9] The definition of middle school is grades 6-8, per the AIR presentation to the Commission to Study School Funding on October 19, 2020.
[10] For multiplier and calculation methodologies, and two examples using the multipliers, see the October 19, 2020 AIR presentation to the Commission to Study School Funding titled Regression and Cost Model Results.
[11] Calculated using the AIR estimate of $2,915,379,635, which was based on a combination of 2018-2019 and 2019-2020 school year data, and the New Hampshire Department of Education’s reported SFY 2019 distribution of $552,624,220 in aid flowing from the State, including stabilization aid, combined with the $363,099,673 raised for education through the Statewide Education Property Tax.
[12] See Exhibit 28 in the August 2020 AIR report Equity and Adequacy of New Hampshire School Funding: A Cost Modeling Approach.
[13] For the middle school measurement restriction, see AIR’s October 19, 2020 presentation to the Commission to Study School Funding. For more data and analysis conducted by AIR, including the AIR simulation model, see the University of New Hampshire’s School Funding Study Resources & Analyses web page. The publicly-posted AIR simulator also advances the data to SFY 2020, while the NHFPI analysis focuses on SFY 2019 and calculates the SFY 2019 figures as if these policies were in place in real time, and before the pandemic’s impacts on school district enrollment and changes in school funding relative to free and reduced-price meal eligibility in SFYs 2021 and 2022; see NHFPI’s Issue Briefs The State Budget for Fiscal Years 2020 and 2021 and The State Budget for Fiscal Years 2022 and 2023.
[14] See the Commission’s final report, Our Kids, Our Schools: Achieving Greater Equity for New Hampshire Students and Taxpayers, December 1, 2020, page 7.
[15] In this analysis, unless otherwise noted, Penacook is treated as a separate municipality from Concord, which is the manner in which the New Hampshire Department of Education categorizes Penacook. Public charter schools are also generally not included in the analyses in this Issue Brief.
[16] Read more about the Statewide Education Property Tax in NHFPI’s May 11, 2021 blog Statewide Education Property Tax Change Provides Less Targeted Relief.
[17] For more information, see NHFPI’s November 4, 2021 presentation Measuring Student Hardship by Municipality: Free and Reduced-Price School Meal Eligibility and Other Metrics for Understand Local Poverty and Income and NHFPI’s August 25, 2021 Issue Brief Greater Investments Key for Students Facing Inequities Across New Hampshire.
[18] See Exhibit 24 in the August 2020 AIR report Equity and Adequacy of New Hampshire School Funding: A Cost Modeling Approach.
[19] For more discussion of the limitations of survey data, see NHFPI’s August 29, 2018 Issue Brief Measuring New Hampshire’s Municipalities: Economic Disparities and Fiscal Capacities and NHFPI’s October 26, 2017 blog post Interpreting the Significance of the October County Census Data Release.
[20] For more analysis of October 2019 New Hampshire public school enrollment by race and free and reduced-price school meal eligibility, see NHFPI’s August 25, 2021 Issue Brief Greater Investments Key for Students Facing Inequities Across New Hampshire.
[21] See the New Hampshire Department of Education’s available data on the Department’s Enrollments – Demographic Categories web page.
[22] Hanover and Dresden were both school districts with relatively high percentages of New Hampshire students of color. Both school districts serve Hanover, with the Dresden School District also serving Norwich, Vermont.