The State Budget represents New Hampshire’s funding priorities for public investment in education, health care, public safety, housing, conservation and preservation, roads and bridges, and a range of services to Granite State residents and businesses. To support these investments, policymakers must determine methods for raising revenue and project the amount of revenue available over the two-year duration of the State Budget. Sustainable revenues are essential to help ensure that adequate funding is available to meet the needs of Granite Staters.
Although certain expenses can be paid for on a one-time basis, such as capital investments in mental health, education, and transportation infrastructure, key ongoing services require reliable revenue streams that continue into the future. Two primary areas for additional investment in the ongoing State Budget discussions, funding for local public education and the health care workforce, are systemic investments with key, long-term impacts on the state economy and its residents.
In the ongoing discussions of New Hampshire’s next State Budget, business tax rates are a key focal point. Current law, established in the State Budget agreement reached in June 2017, plans reductions in the State’s two primary business tax rates that will take effect for the current tax year, with another set of reductions scheduled for 2021. Revenues from business tax receipts since early 2018 have been abnormally strong, spurred by corporate tax changes at the federal level and generating most of the State’s existing revenue surplus. However, this surplus is not likely to be repeated, as one-time, anomalous revenues in the business taxes fade away and economic growth slows. The Legislature’s official estimate suggests maintaining business tax rates at 2018 levels throughout the State Budget biennium would boost revenues by approximately $93.1 million.[i] The current revenue surplus provides an opportunity to make critical investments, but future business tax revenue will help determine the State’s ability to sustain those investments in the coming years.
Current Business Tax Rates
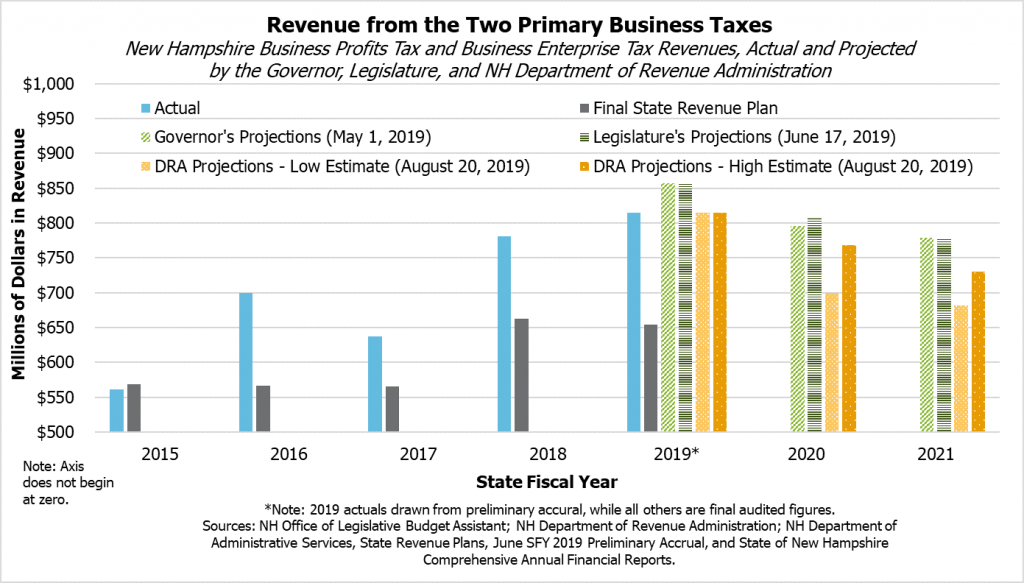
New Hampshire’s two primary business taxes, the Business Profits Tax (BPT) and the Business Enterprise Tax (BET), are key revenue sources for funding State services. The BPT is the single-largest tax revenue source for the State, collecting $482.3 million in receipts in State Fiscal Year (SFY) 2018, and the BET is the fourth-largest tax revenue source, totaling $298.8 million in SFY 2018.[ii] The two taxes are actually quite different, with the BPT behaving more like a typical state corporate income tax, drawing from profits after certain exemptions and credits, and the BET charging businesses based on the compensation, interest, and dividends paid or accrued, regardless of profit. Businesses also have different filing threshold requirements under each of the taxes, and the taxes paid under the BET can be used as a credit against a business’s BPT liability.[iii]
However, the BPT and BET are often filed together, and the totals are aggregated together in analyses of revenues. Separate BPT and BET receipts are not delineated until final returns are due; for the approximately 90 percent of businesses that operate on calendar years, final 2019 returns will be due in March or April of 2020, depending on the business type. Many businesses also pay quarterly estimated payments of their business tax liability during the tax year.[iv]
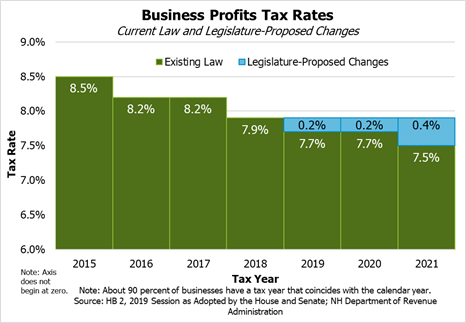
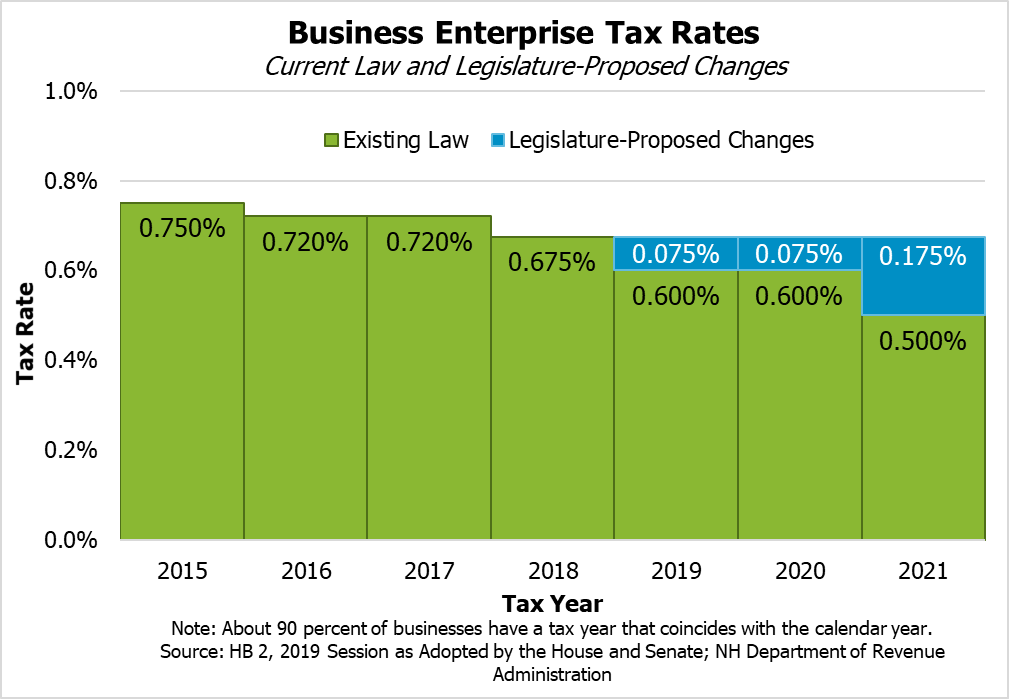
The tax rate reductions currently in law, as well as the changes proposed in the Legislature’s version of the State Budget passed in June, happen concurrently for the BPT and the BET. The rate reductions being debated for this budget biennium are a continuation of a series of rate reductions that were first incorporated into the SFYs 2016-2017 State Budget agreement, and then continued in the SFYs 2018-2019 State Budget. After dropping from a 2015 rate of 8.5 percent, the BPT rate for 2018 was 7.9 percent, with the tax rate applied to business activity in 2019 at 7.7 percent, and another scheduled drop to 7.5 percent for 2021. The BET rate was 0.75 percent in 2015, dropping to 0.675 percent for 2018, 0.60 percent in 2019, and 0.50 percent for 2021.[v]
Recent State Revenues
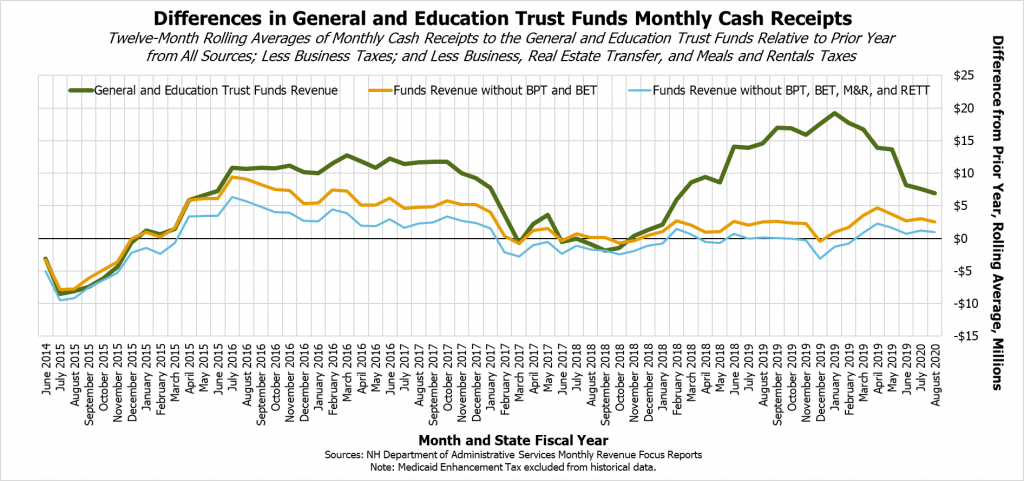
The amount of revenue collected by the State since the beginning of 2018 has been abnormally high, and its pattern has not matched trends in the economy or State policy changes. These high revenues have been driven by business tax receipts, with other revenues growing in a much more limited fashion. Whereas the uptick in economic growth following the long, slow economic recovery from the last recession in New Hampshire propelled growth in most revenue sources during 2015 and 2016, the substantial revenue growth seen since early 2018 has been driven almost entirely by business tax receipts, with growth in other revenue sources relatively subdued.[vi]
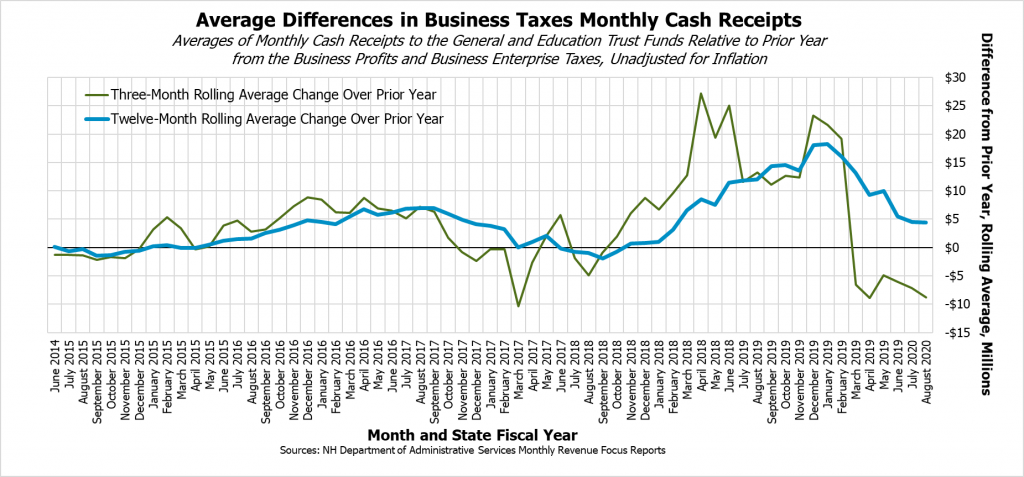
Preliminary revenue collections in 2019, however, have seen business tax revenues declining relative to their 2018 levels. While still elevated, business taxes are no longer growing abnormally, contributing only $0.5 million to the surplus in June receipts, which was the most recent key month for quarterly estimated payments. While levels are certainly not low enough to eliminate the surplus generated by the high BPT and BET receipts in 2018, revenues in 2019 on a quarterly rolling basis have dropped significantly from the 2018 levels. Business tax receipts for the most recent three months, including June, July, and August of calendar year 2019, are about 15.2 percent lower than for the same three months last year. For the twelve months ending August 2019, business tax revenues are still up 6.8 percent over the prior twelve months, but that percentage has dropped from the twelve-month rolling average increase of 32.9 percent in January 2019. While the current apparent decline in business tax receipts is less dramatic than the increase seen in the beginning of 2018, this decline suggests that projections of one-time payments fading away from the revenue stream are coming to fruition.
The Federal Tax Overhaul and Potential Causal Factors for Business Tax Receipts
While no one causal factor can definitively explain changes in business tax revenues, both timing and evidence from other states suggests one key driver, the federal tax overhaul, with several other variables likely affecting revenue collections as well.
The federal tax overhaul, the Tax Cuts and Jobs Act, became law in December 2017, and appeared to have a nearly immediate impact on State business tax revenues.[vii] NHFPI analysis, information provided by the New Hampshire Department of Revenue Administration, the State’s Comprehensive Annual Financial Report for State Fiscal Year 2018, and information from other states all identify the federal tax overall’s corporate tax law changes as spurring business repatriation of taxable dollars from overseas, mergers, and other changes that had a one-time, anomalous impact on State tax receipts.[viii] These one-time changes explain the sharp rise in combined business tax receipts, likely driven largely by the BPT, starting in early 2018, and the subsequent relative declines in business tax revenue as one-time anomalies fade away.
Even as one-time anomalies fade, the economy has been growing, which likely generates higher business tax receipts because of more overall economic activity generally. Economic activity has not been nearly robust enough to explain the entire rise in business tax receipts.[ix] While the economy may be slowing relative to last year, the relative drop in business tax revenues is not likely a result of that slowing economy, as data suggest the economy is still larger than it was last year even though growth has slowed.[x]
One explanatory variable for the drop in business tax receipts is the decline in business tax rates for estimated payments. Businesses that modified their estimated payments to reflect a lower rate for 2019 may be paying less than they did during 2018, which could lead to lower payments. While final payments are not due until March or April of 2020, the required estimated payments dropping may, in part, reflect the lower business tax rates. The several business tax rate reductions that have taken effect thus far do not appear to be responsible for recent revenue increases, and policymakers should not expect to generate additional revenue through tax rate reductions.[xi]
Projected State Revenues
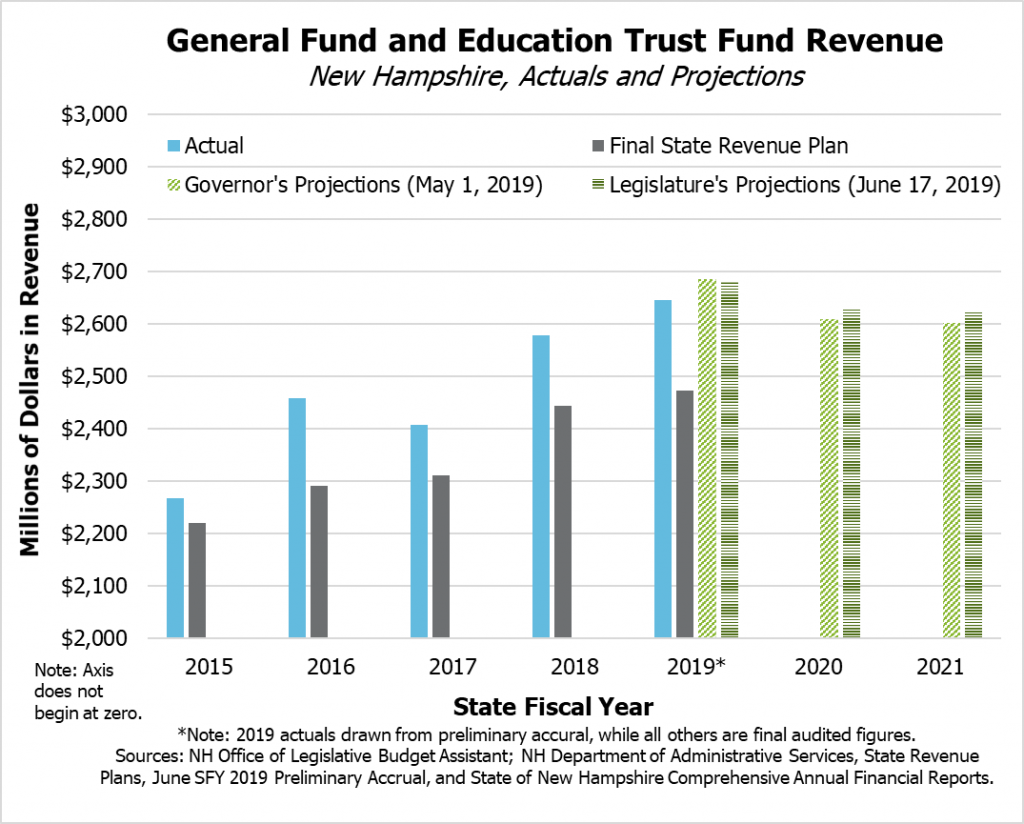
The impacts of the one-time anomalous payments are reflected in the various revenue projections for the current State Budget biennium. While most New Hampshire Legislatures and Governors can craft their budget proposals around the assumption of growing revenues over the biennium, the disappearance of the one-time anomalous payments suggests that revenues will be lower at the end of this biennium than at the beginning.
This expected downward trend in revenues, the potential for which is already detectible in the monthly revenue totals, is driven primarily by business tax projections. While certain other revenue sources are projected to grow or hold steady and other smaller ones are projected to decline, the projections in business tax receipts drive the overall downward trend. The New Hampshire Department of Revenue Administration published updated revenue estimates, providing low and high revenue figures to help define the range of possibilities, on August 20, 2019. Those estimates show a faster decline than forecast by the Governor’s office or the Legislature.
These revenue projections show the crux of the issue for the current State Budget: with projected revenues expected to drop, policymakers must either bolster future services with additional revenue through policy changes, provide services on a temporary or more limited basis, or some combination of both.
Rate Reductions and Funding Ongoing Services
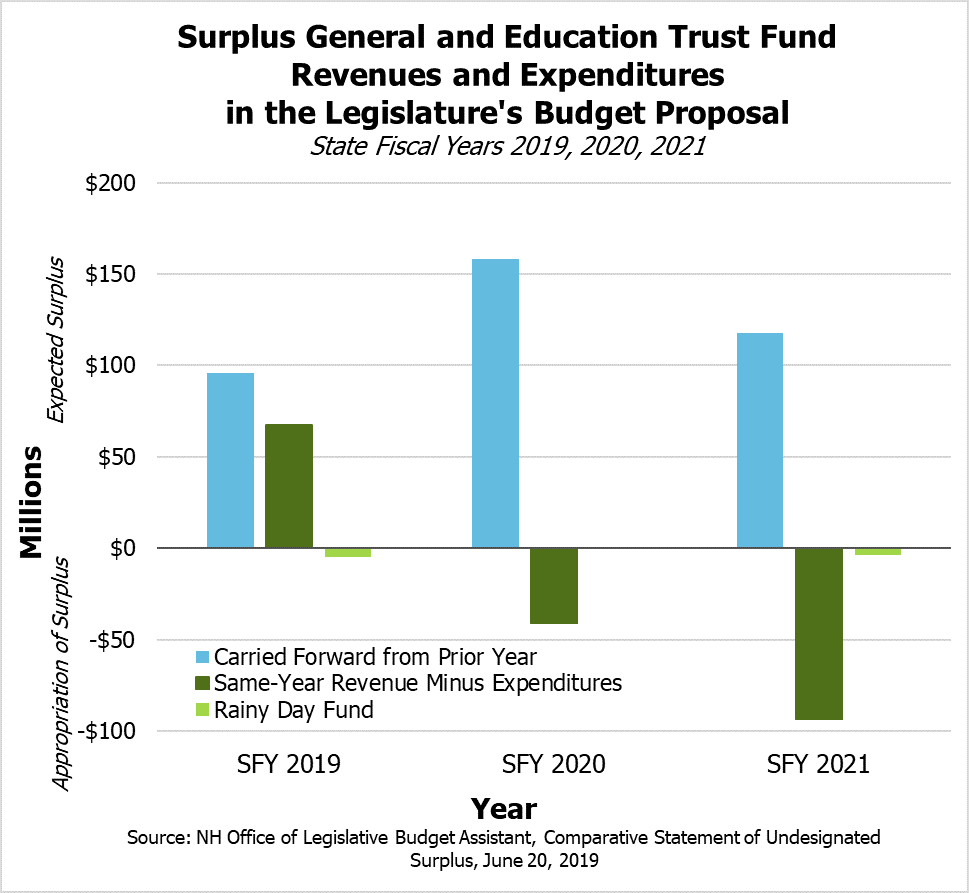
While the State faces the potential for business tax revenues to drop in future years as repatriation and other effects of the federal tax overhaul diminish, current law prescribes reduced business tax rates. Revenue projections from the Governor, the Legislature, and the New Hampshire Department of Revenue Administration’s updated projections all show a negative impact on State revenues from tax rate reductions. With estimated forgone revenue of $32.4 million projected for SFY 2020 and $50.4 million in SFY 2021, rate reductions make planning for ongoing expenses more difficult in this State Budget, and increase the risk that revenues, which are already difficult to project, will fall short of the amounts needed to pay for services.[xii] The Legislature’s proposed budget relies on SFY 2019 surplus revenue to fund expenditures in SFYs 2020 and 2021, meaning additional stable, adequate revenues would be needed to support a subsequent State Budget with similar levels of services funded and without higher than anticipated revenue growth.
Although identifying specific dollar amounts associated with rate reductions and projecting two years into the future is difficult to do with certainty, both the loss of anomalous payments and changes in the economy create significant downside risks for future revenues. These risks reduce the certainty that funding will be available for the delivery of key services, and reduced business tax rates adds to the overall risk of funding shortfalls. Another consideration for policymakers are the potential detriments to the economy and resident services by underfunding or delaying investments, or shifting the responsibility for payment for these services to other payers, such as property tax payers.[xiii]
Two funding priorities that are key components of discussions around the State Budget, and would require ongoing funding to help ensure effectiveness, are local public education and Medicaid reimbursement rates. Both these funding priorities have systemic and long-term positive impacts on the state’s economy, workforce, and residents.
Local Public Education
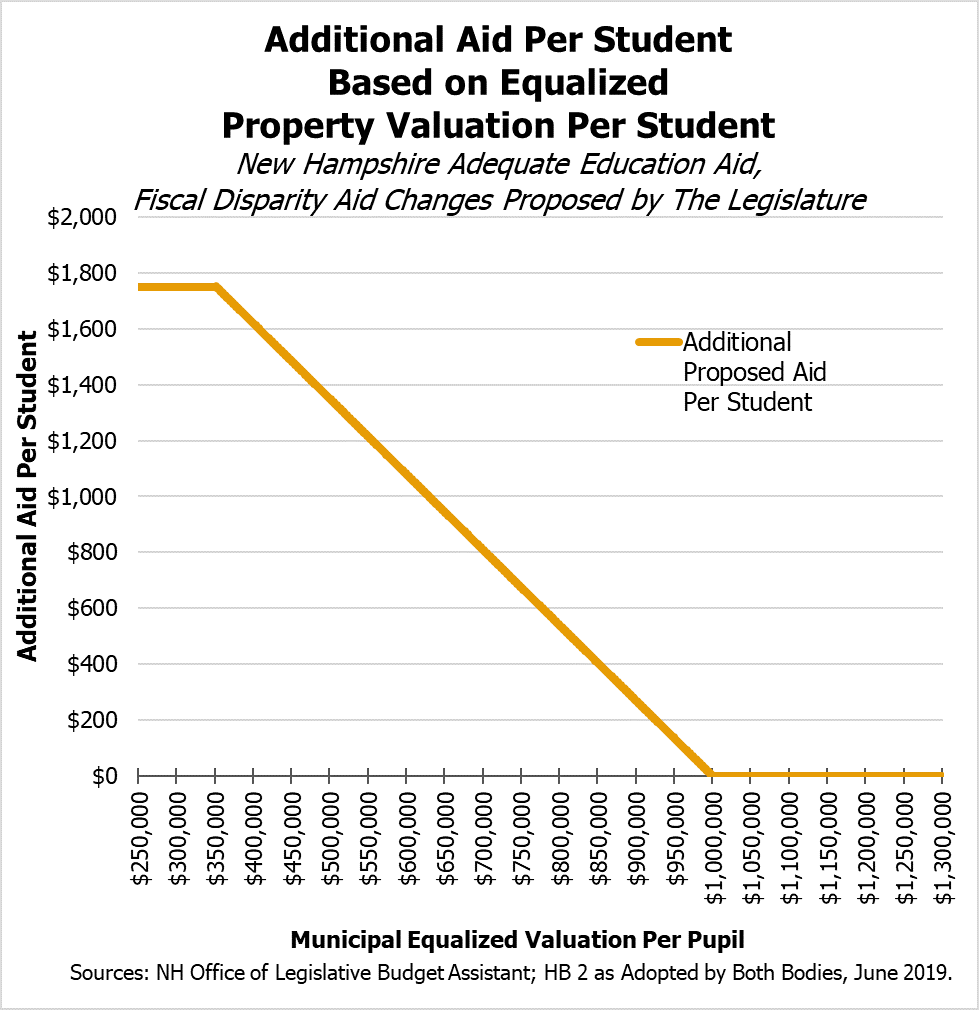
The Legislature’s version of the State Budget, which passed both the House and the Senate in June, would help fund local education by boosting Adequate Education Aid to property-poor school districts. The total amount of Adequate Education Aid would be increased by $138.1 million during the biennium, and would stem from two primary components. First, the Legislature would amend the funding formula for Adequate Education Aid per pupil grants for districts that have less than $1,000,000 in equalized property valuation, a measure of taxable property value, per pupil. Local governments that have more taxable resources per student may have less difficultly funding the services a given student or set of students may need with local property taxes, whereas those with very limited tax bases relative to the number of students may face considerable upward pressure on property tax collections to fund education services of similar quality. The statewide equalized valuation per pupil in 2017 was $1,043,647, and the median municipality had $981,629 in taxable property wealth per student. Based on estimates available in May 2019, about two out of every three students (67.2 percent) live in municipalities that would be eligible for this subsidy.[xiv]
Significant additional funding would be provided to local governments through returning stabilization grants to their original values, which would remove the planned annual decline in State Adequate Education Aid for certain communities. Stabilization grants were designed to keep communities that would have lost support in the last education funding formula rewrite, which eliminated an earlier version of fiscal capacity disparity aid, at the same levels of funding.[xv]
Medicaid and Health Care Delivery
Medicaid is a fiscal partnership between the State and federal governments that helps approximately 175,000 people with low incomes or limited resources in New Hampshire access health care. Medicaid enrollees include children, parents, pregnant women, people with disabilities, older residents and nursing home residents, and other individuals with low incomes. The Medicaid program reimburses providers for delivering services, and the State of New Hampshire sets the reimbursement rates that define the amount of revenue an agency can collect for each service delivered under Medicaid. The federal government generally funds about half of those reimbursements and other Medicaid services, with the balance being funded by State or county revenues. Medicaid reimbursement rates for services are typically lower than reimbursement rates from Medicare or private-sector insurance companies.[xvi]
The Legislature’s State Budget passed in June proposed increasing Medicaid reimbursement rates for nearly all providers by 3.1 percent in the first year of the biennium and 3.1 percent in the second year of the biennium, deploying $60 million in new State funds for this purpose. Rates for those providing services for mental health and substance use disorder inpatient and outpatient services would be boosted with a separate appropriation in the State Budget.[xvii] Providers facing workforce shortages may have competition for workers from other industries in which wages are rising faster, and workforce shortages limit service delivery for those eligible residents in need of services. Medicaid reimbursement rates for key services have not kept up with inflation, and higher reimbursement rates may mitigate the workforce shortage and help ensure eligible Granite Staters get the care they need.[xviii]
Concluding Discussions
The State Budget is typically the most consequential piece of legislation policymakers craft in any given two-year period in New Hampshire, funding the vast majority of the services the State provides to its approximately 1.36 million residents.[xix] In this State Budget biennium, key additions to core state services, including health care workforce and local public education supports, are being debated among all the other public priorities, such as infrastructure, mental health and opioid crisis responses, housing, public safety, and economic development.
New Hampshire’s State Budget is challenged to fund needed services adequately even as anomalous revenues from the federal tax overhaul decline. Policymakers face a generally favorable revenue environment, but future declining revenues complicate decisions around funding service priorities. Consideration should be made of the potential benefits to the economy and the state’s residents by investing additional resources into vital services, such as health, education, housing, and infrastructure, against the revenue forgone by reducing tax rates.
Policymakers projecting revenues available to fund the State Budget and potential revenue policy changes to support key services should carefully consider the possible causal factors for recent revenue trends. The rise in revenue during the last two State fiscal years appears to have been driven by the federal tax overhaul, rather than past New Hampshire business tax rate reductions, and policymakers should not rely on rate reductions to generate additional revenue. Maintaining business tax rates at 2018 levels may help ensure that sufficient revenue is available to fund key ongoing services for Granite Staters.
Endnotes
[i] For the total of $93.1 million in revenue added due to maintaining business tax rates at 2018 levels throughout the biennium, see the New Hampshire Office of Legislative Budget Assistant, Comparative Statement of Undesignated Surplus – Combined General and Education Trust Funds, Schedule 2 Line 5 and Schedule 4 Line 3, June 20, 2019. Note that the reduced revenue stemming from the rate reductions was projected by the Legislature to be lower than the increased revenue projected by the Legislature from freezing business tax rates at 2018 levels; this difference is due to the timing of the respective analyses used to generate these figures and when these figures were incorporated into the legislative process.
[ii] Calculations based on the State of New Hampshire Comprehensive Annual Financial Report for the Fiscal Year Ended June 30, 2018, pages 6 and 119, and the New Hampshire Department of Revenue Administration, 2018 Annual Report, page 41.
[iii] For more on the Business Profits Tax and the Business Enterprise Tax, see NHFPI’s resource Revenue in Review: An Overview of New Hampshire’s Tax System and Major Revenue Sources, published May 24, 2017.
[iv] For more on quarterly estimated payments and recent revenue trends in business taxes, see NHFPI’s Issue Brief Funding the State Budget: Recent Trends in Business Taxes and Other Revenue Sources, published May 22, 2019.
[v] All instances where a business tax rate references a specific year, the year refers to the tax years of businesses ending on or after December 31 of the indicated calendar year. The New Hampshire Department of Revenue Administration reports that approximately 90 percent of businesses use calendar years as their tax years.
[vi] For more analysis of recent State revenue collections, see NHFPI’s Issue Brief Funding the State Budget: Recent Trends in Business Taxes and Other Revenue Sources, published May 22, 2019, and NHFPI’s August 15, 2019 Common Cents post Declining Business Tax and Other Revenues Suggest Caution for State Budget.
[vii] For more information on the Tax Cuts and Jobs Act, see NHFPI’s December 21, 2017 Common Cents post Congress May Reduce Funding to Key Programs Following Tax Changes. For more analysis of the immediate impacts of the federal tax overhaul on New Hampshire State revenues, see NHFPI’s Common Cents post analyses of State revenues from February and April of 2018.
[viii] For NHFPI’s analysis of recent state revenues, see NHFPI’s Issue Brief Funding the State Budget: Recent Trends in Business Taxes and Other Revenue Sources, published May 22, 2019. For the New Hampshire Department of Revenue Administration’s description of the reasons for high receipts in State Fiscal Years 2018 and 2019, see the New Hampshire Department of Revenue Administration, Updated Revenue Estimate Presentation, House Ways & Means Committee, May 7, 2019. See also narrative in the State of New Hampshire Comprehensive Annual Financial Report for the Fiscal Year Ended June 30, 2018. For analysis of corporate income tax growth across many states, see Lucy Dadayan, State Revenues Grew in Third Quarter, but Income Taxes Face Uncertain Prospects, Urban Institute, March 2019, pages 20-21.
[ix] For NHFPI’s analysis of recent state revenues relative to the State’s economy, see NHFPI’s Issue Brief Funding the State Budget: Recent Trends in Business Taxes and Other Revenue Sources, published May 22, 2019.
[x] For changes in estimated employment figures, see New Hampshire Employment Security, New Hampshire Economic Conditions, How “Old” is New Hampshire Really? September 2019. For estimated changes in the size of Gross State Product, see the U.S. Bureau of Economic Analysis, Gross Domestic Product by State: Fourth Quarter and Annual 2018, May 1, 2019, and Gross Domestic Product by State, First Quarter 2019, July 25, 2019.
[xi] For analysis of the potential causal factors contributing to the recent rise in business tax receipts, see NHFPI’s Issue Brief Funding the State Budget: Recent Trends in Business Taxes and Other Revenue Sources, published May 22, 2019.
[xii] For more detail on the revenue estimates from the House, Senate, and Committee of Conference, see the New Hampshire Office of Legislative Budget Assistant, General Fund and Education Trust Fund Base Revenue Estimates, June 17, 2019. To see the individual adjustments in the Governor’s revenue estimates, see New Hampshire Department of Revenue Administration, Overview of New Hampshire Taxes and Revenue Estimate Presentation, Senate Ways and Means Committee, April 3, 2019, slide 37. Estimates developed by the Governor, House, Senate, and Committee of Conference are all incorporated into an appendix table in NHFPI’s Issue Brief Funding the State Budget: Recent Trends in Business Taxes and Other Revenue Sources, published May 22, 2019. Note that the reduced revenue stemming from the rate reductions was projected by the Legislature to be lower than the increased revenue projected by the Legislature from freezing business tax rates at 2018 levels; this difference is due to the timing of the respective analyses used to generate these figures and when these figures were incorporated into the legislative process.
[xiii] For more information on the connections and relationships between State and local funding for services, see NHFPI’s presentation How We Fund Public Services in New Hampshire, June 24, 2019.
[xiv] For an explanation of this mechanism and a complete analysis of the House’s education funding proposal, see NHFPI’s Issue Brief Education Funding in the House Budget, published May 6, 2019. For information on the Legislature’s proposed budget, see NHFPI’s June 24, 2019 Common Cents post Committee of Conference Keeps Medicaid Reimbursement Rate Increases, Boosts Fiscal Disparity Aid in Final Budget Agreement.
[xv] For an explanation of stabilization grants and associated references, see NHFPI’s Issue Brief Education Funding in the House Budget, published May 6, 2019. For information on the Legislature’s proposed budget, see NHFPI’s June 24, 2019 Common Cents post Committee of Conference Keeps Medicaid Reimbursement Rate Increases, Boosts Fiscal Disparity Aid in Final Budget Agreement. To see the education funding formula rewrite passed in 2011, see Chapter 258, Laws of 2011.
[xvi] Monthly Medicaid totals drawn from the New Hampshire Department of Health and Human Services August 2019 Monthly Caseload Report and the New Hampshire Department of Health and Human Services Medicaid Enrollment Data. For more on Medicaid and Medicaid reimbursement rates, relative to this section, see NHFPI’s Issue Brief Medicaid Home- and Community-Based Care Service Delivery Limited by Workforce Challenges, published March 15, 2019.
[xvii] To learn about the Legislature’s proposed changes to Medicaid reimbursement rates, see NHFPI’s June 24, 2019 Common Cents post Committee of Conference Keeps Medicaid Reimbursement Rate Increases, Boosts Fiscal Disparity Aid in Final Budget Agreement.
[xviii] For more on Medicaid and Medicaid reimbursement rates, relative to this section, see NHFPI’s Issue Brief Medicaid Home- and Community-Based Care Service Delivery Limited by Workforce Challenges, published March 15, 2019.
[xix] This population estimate is from the U.S. Census Bureau’s Population Estimates Program, providing the approximate state population on the date July 1, 2018. For more information on the State Budget, see NHFPI’s resource Building the Budget: New Hampshire’s State Budget Process and Recent Funding Trends, February 9, 2017.