Understanding recent revenue trends is key to accurately projecting the amount of revenue expected over the next two State fiscal years and maintaining a balanced State Budget. Revenue projections are especially difficult to make accurately this year, given recent abnormal behavior in receipts from the State’s two primary business taxes, which have driven most revenue growth in recent years. These two taxes are the largest and the fourth-largest tax revenue sources for the State, making them critical to funding public services. These unusual trends have produced a significant revenue surplus, expected to be over $170 million at the end of this State fiscal year. The surplus from the business taxes alone was the equivalent of about 90 percent of the total fiscal year surplus as of April 30, 2019. This surplus presents an opportunity for making critical investments. However, understanding both the potential causal factors for the increases in business tax receipts and the trends in other revenue sources informs decisions concerning those investments and the fiscal support needed for them in the future.
With other revenue sources growing in a limited fashion, deciphering the recent behavior of business tax receipts is critical. While available information limits a complete analysis, higher business tax receipts during the previous State Budget appear to have been driven largely by economic growth that accelerated starting in 2015, and the most recent rise in revenue was likely spurred primarily by the federal tax overhaul. The several business tax rate reductions that have taken affect in New Hampshire do not appear to be responsible for the recent revenue increases, and policymakers should not expect to generate additional revenue through tax rate reductions.
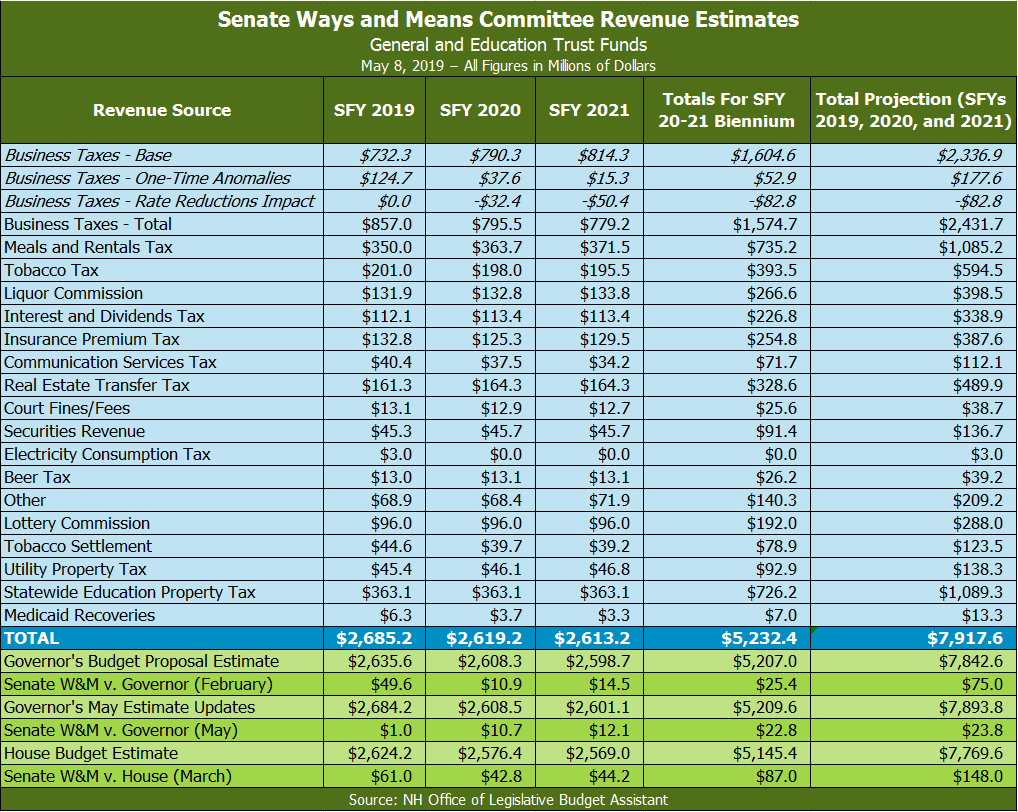
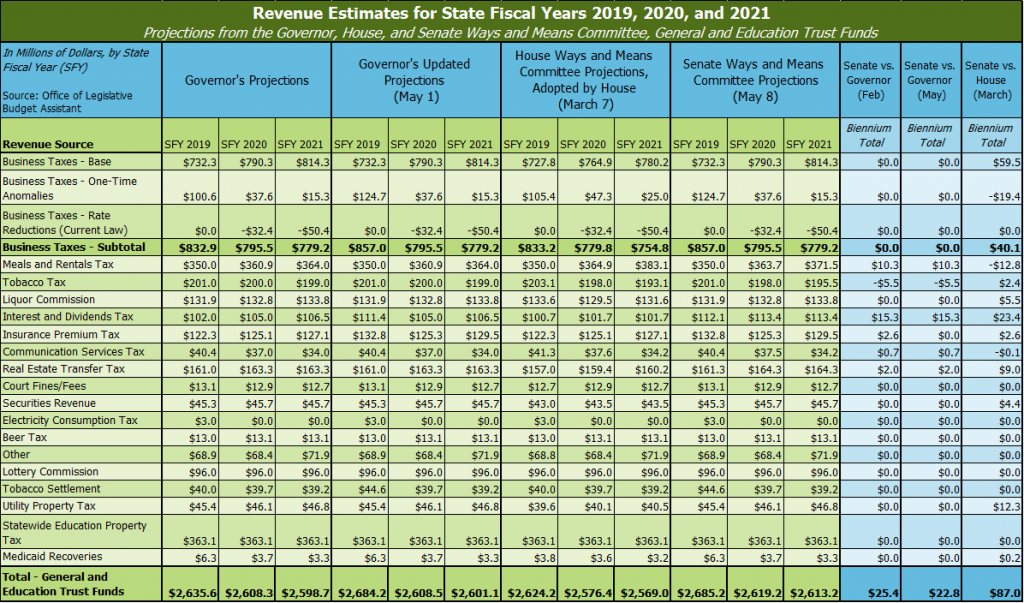
The Governor, House, and Senate Ways and Means Committee have each produced sets of revenue projections. The Senate Committee estimated higher levels of revenue than both the Governor and the House, projecting a total of $75 million more than the Governor’s February estimates and $148 million more than the House estimates for State fiscal years 2019, 2020, and 2021 in total. About $25 million and $87 million of those respective totals were expected during the State Budget biennium.
This Issue Brief reviews the current fiscal situation of the State of New Hampshire relative to the State’s operating budget and based on recent revenue trends, identifies key potential future revenue trends, and reviews revenue projections made by the House and Senate Ways and Means Committees and the Governor’s office. This Issue Brief also examines available data to explore potential causal factors for recent unexpected increases in business tax receipts and explores the differences between the revenue surpluses generated in each of the last two State Budgets in New Hampshire.
Current Revenues and the Surplus
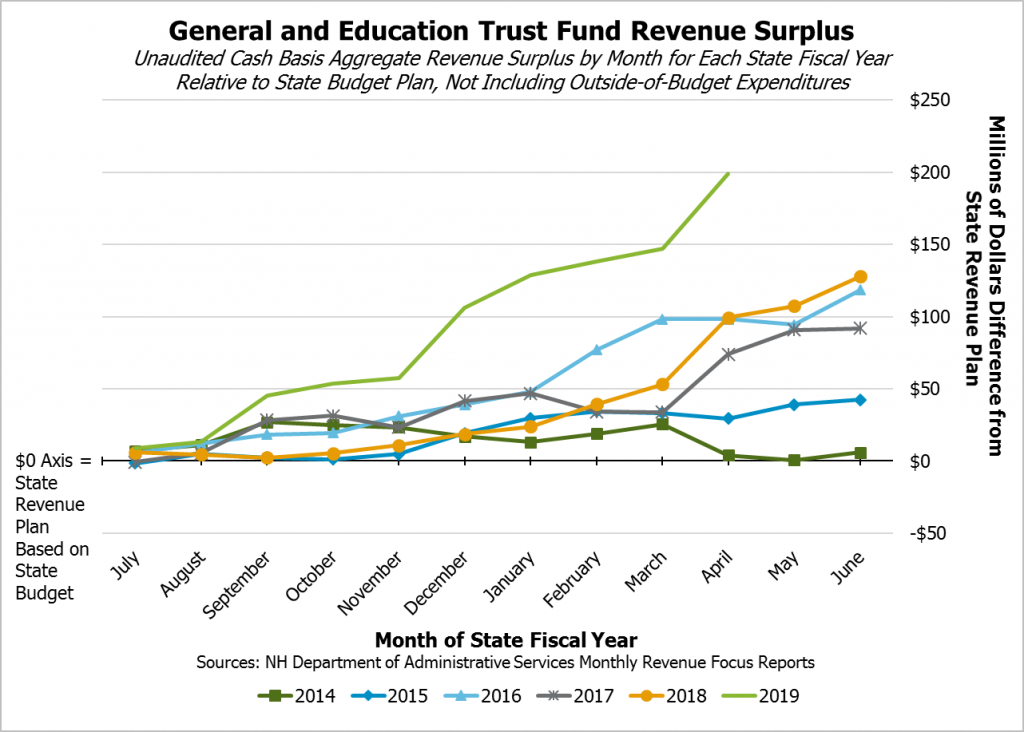
Revenues continued to come in ahead of the State Revenue Plan through the critical month of April during State Fiscal Year (SFY) 2019.[i] April is a key month for revenues because it is the month during which many businesses and individuals are required to file returns from the previous tax year’s activity as well as provide quarterly estimate payments to the State for the current tax year. The results from April showed no critical changes from expectations, providing increased assurance in the ability of policymakers to reasonably project revenue in an environment when receipts from the State’s two primary business taxes have been very volatile.[ii]
As of the end of April, the General Fund and the Education Trust Fund, which combined are where most State tax revenues are deposited and the funds that legislators look to for undesignated surplus dollars, had a total surplus for SFY 2019 of $198.8 million (9.4 percent), and revenues were $121.1 million (5.5 percent) above the same time in the prior year. SFY 2019 began July 1, 2018 and ends June 30, 2019. While June is an important month for State revenues as well, there is less risk that this April revenue surplus will erode or disappear by the end of the State fiscal year than, for example, the risk that a surplus in December might disappear by the fiscal year’s end.
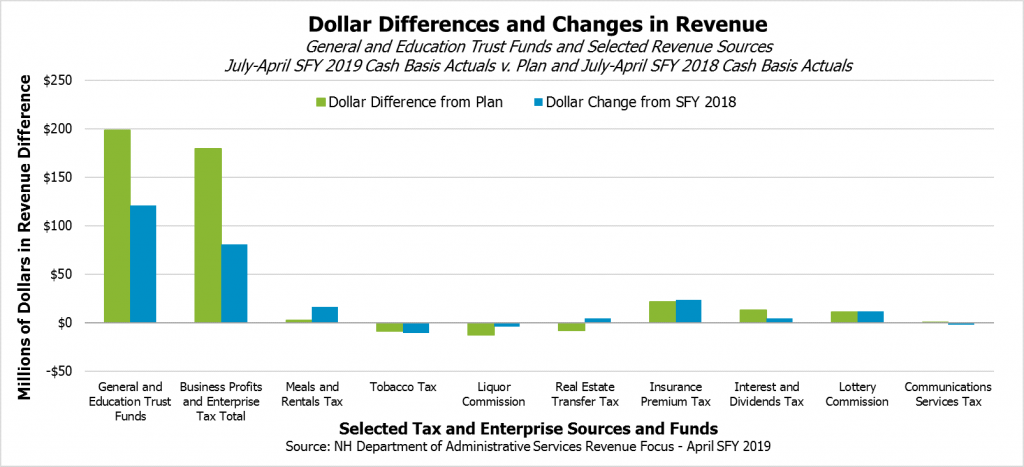
The State’s two primary business taxes, the Business Profits Tax (BPT) and the Business Enterprise Tax (BET), were the largest and fourth-largest tax revenue sources in State Fiscal Year 2018, and have driven the recent revenue growth and surplus.[iii] The two business taxes are typically paid together in quarterly estimate payments, and revenues are not fully separated out between the two taxes until after final returns are filed. As such, the two taxes are often analyzed together, as estimates of BPT and BET cash receipts are usually based on historical splits between the two tax revenue sources.[iv] As of the end of April 2019, the two business taxes are $179.5 million (34.0 percent) above the State Revenue Plan and $81.1 million (12.9 percent) above the prior year. The recent rise in revenue began halfway through SFY 2018, and business taxes were up $143.3 million (22.5 percent) for the year relative to SFY 2017, which saw lower business tax receipts than SFY 2016. Both last year and this year, business tax receipts have been responsible for the vast majority of the surplus revenues.[v] The revenue surplus from the business taxes was the equivalent to 89.1 percent of the total General and Education Trust Fund surplus in SFY 2018, and is the equivalent of 90.3 percent of the SFY 2019 surplus as of the end of April.
Other revenue sources have performed roughly in line with the State Revenue Plan in aggregate, but there were noteworthy variations from both plan and last year within those revenues. On the positive side, Insurance Premium Tax revenues were $21.3 million (18.0 percent) above plan and $23.7 million (20.8 percent) above prior year as of the end of April, while strong receipts in April pushed Interest and Dividends Tax receipts up to $12.9 million (15.5 percent) above plan and $4.8 million (5.3 percent) above SFY 2018 for the year through April’s end. Interest and Dividends Tax revenues stem primarily from dividends (44 percent in SFY 2017) and distributions (34 percent in SFY 2017), so stock market and private-sector profit performance during 2018 likely had a positive effect on April returns, while quarterly estimate payments were aided by performance thus far this year.[vi] Lottery Commission revenues are also above plan and the prior year, in part due to large prizes in October and November.[vii] Revenues from the Meals and Rentals Tax, the third-largest tax revenue source supporting State government services, remain slightly above plan and $16.1 million (5.8 percent) above the prior year.
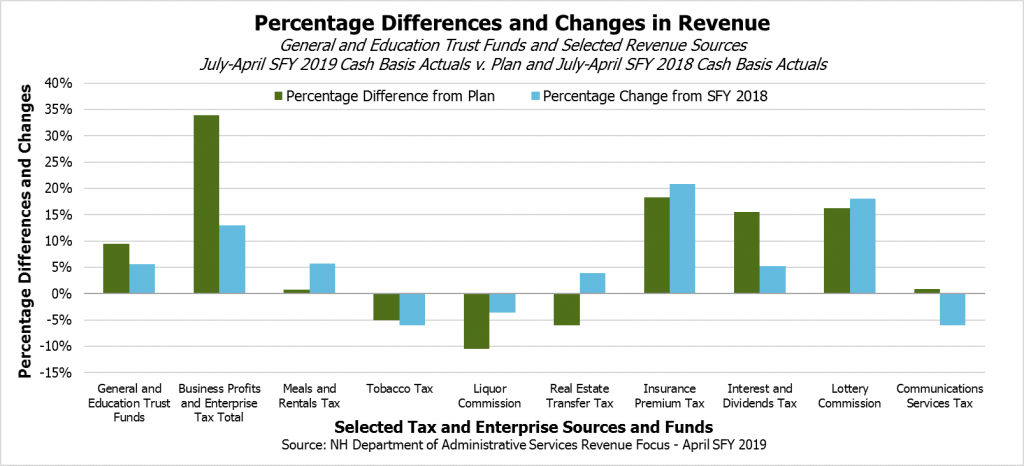
In contrast to these positive contributors, certain sources are behind either last year’s receipts or the State Revenue Plan. The Tobacco Tax continues to show it will likely be a declining source of revenue over time. The $1.78 tax per pack of 20 cigarettes, which is adjusted proportionally for pack size, is not adjusted for inflation.[viii] However, even without adjusting for inflation, Tobacco Tax revenues are $10.5 million (6.0 percent) behind last year as of the end of April, and are running below the State Revenue Plan by $8.8 million (5.0 percent). The Communications Services Tax is another declining revenue source, which is remaining less than one percent above plan but is $2.2 million (6.0 percent) below the prior year. Liquor Commission revenues, which reflect profits from liquor sales and other Liquor Commission activities, are below plan by $12.7 million (10.5 percent) and below last year by $4.0 million (3.6 percent) as of the end of April. Real Estate Transfer Tax revenues, which are driven in large part by home sales, continue to be higher than last year, ending April with $4.8 million (5.3 percent) more in receipts than last year. However, revenues continue to be below those envisioned in the State Revenue Plan, falling short $8.1 million (6.0 percent) for the year as of the end of April. Revenues continue to be constrained by a lack of housing inventory, which results in higher sales prices but lower sales volume.[ix]
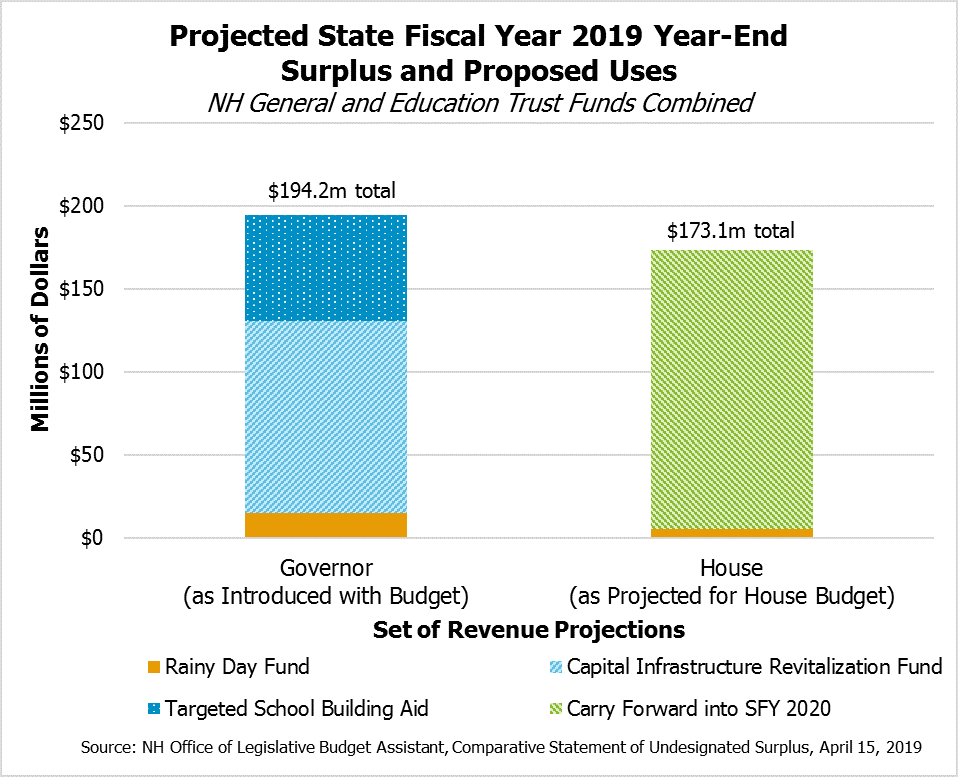
The net revenue surpluses identified above are measured over the State Revenue Plan, but do not account for expenditures passed outside of the State Budget. In the 2018 Legislative Session, those bills accounted for approximately $129.1 million.[x] Both the Governor and the House have produced revenue projections, which forecast different levels of revenue surplus over planned expenditures both within and outside of the State Budget for the end of SFY 2019. The Governor anticipated $194.2 million when he introduced his budget proposal in February, while the House projections that were passed with the State Budget in April planned for $173.1 million at the end of SFY 2019.[xi]
Beyond the General and Education Trust Funds, Highway Fund revenues are ahead of the State Revenue Plan and about the same as the last fiscal year, as of the end of April. The Motor Fuels Tax, which was set to $0.222 per gallon in SFY 2015 and is not adjusted for inflation, has contributed $1.2 million (1.1 percent) more than last year as of the end of April. Motor Vehicle Registration fees are $1.3 million (2.3 percent) below last year at this point.
Potential Causal Factors for Recent Business Tax Behavior
The State’s two primary business taxes, the BPT and the BET, have driven most of the recent revenue growth. Understanding why these recent revenue increases have occurred is important for making revenue projections for the next two years, which are needed to plan the next State Budget, and future policy decisions.[xii]
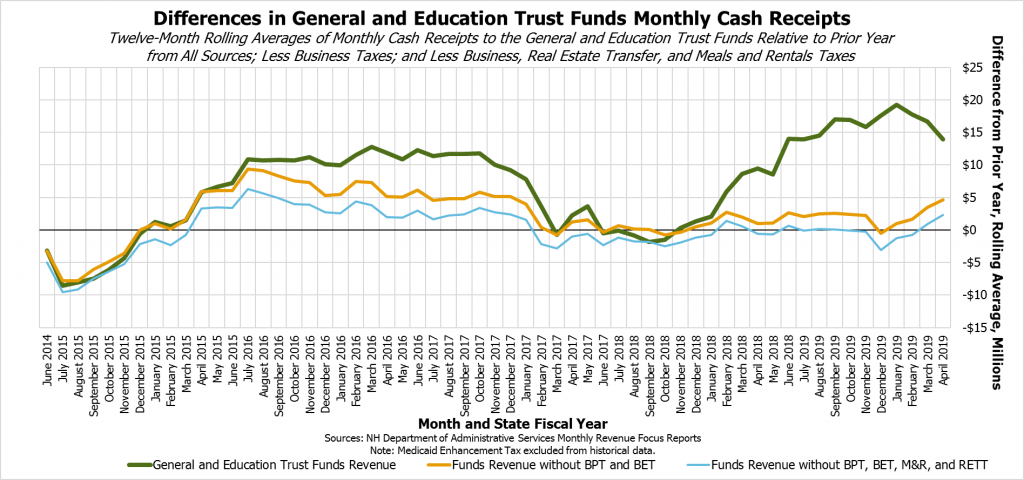
The twelve-month rolling average difference in monthly receipts for the General and Education Trust Funds as a whole shows significant rises starting toward the end of SFY 2015, dropping off by the end of SFY 2017, and rising even more significantly starting halfway through SFY 2018. Removing revenue growth from the two primary business taxes shows smaller amounts of growth relative to the prior years. The rise in revenue growth from SFY 2015 to SFY 2017 included business tax receipts, especially toward the end of the period, but the Meals and Rentals Tax, the Real Estate Transfer Tax, and other revenue sources contributed significantly to growth in the General and Education Trust Funds, especially in the initial rise in revenue. This suggests that widespread economic growth began affecting many of these revenue sources starting in SFY 2015. The more recent period of significant growth, which began in February SFY 2018, was driven almost entirely by the two business taxes; removing them yields relatively low levels of growth from the other revenue sources. This difference suggests that the recent revenue increase is driven by other factors specific to the business taxes, rather than the more widespread economic growth that appeared to support the upswing in state revenue that started in SFY 2015.
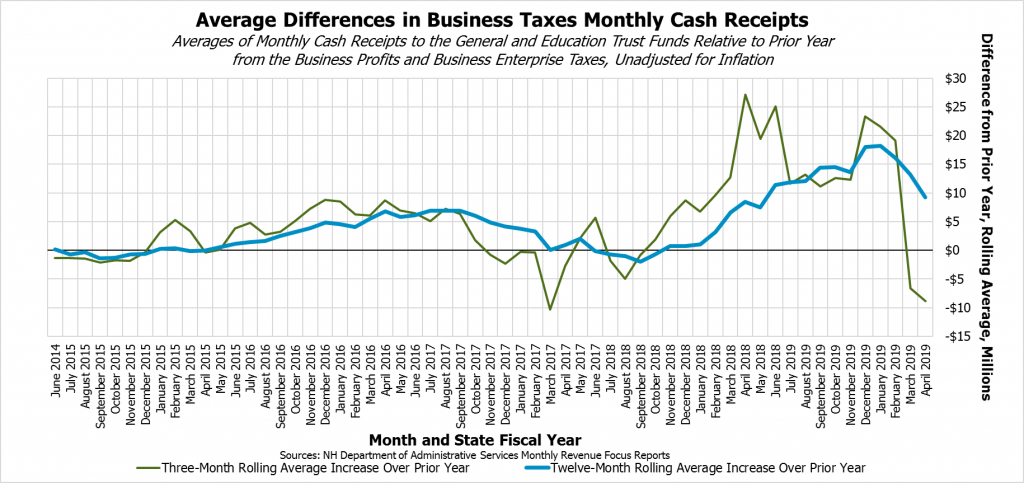
Examining trends solely in the business taxes, the SFYs 2015-2017 rise in revenue appears to be a much more gradual phenomenon than the increases starting in the second half of SFY 2018. This suggests that earlier rise was the result of gradual changes in the economy rather than a policy change. The sharp increase beginning in February SFY 2018 suggests a factor external to the economy, such as the December 2017 (December SFY 2018) passage of the federal Tax Cuts and Jobs Act, is the primary cause. The recent drop in business tax receipt growth, which has not accompanied a sharp change in the economy, also suggests that policy changes have likely driven this recent rise in revenue.
Who Pays Business Taxes to New Hampshire?
While the two primary business taxes in New Hampshire, the BPT and the BET, are often filed and analyzed together, they are very different taxes. The BPT is driven by business profits derived from a line on the federal business tax return.[xiii] The BET is driven by employment, as its tax base is compensation, interest, and dividends paid or accrued; increases in the amount of wages paid increases tax liability, and a company does not necessarily need to be making a profit to owe BET. The BPT has a dollar-for-dollar credit for BET paid, and both business taxes interact with the Insurance Premium Tax through credits.[xiv]
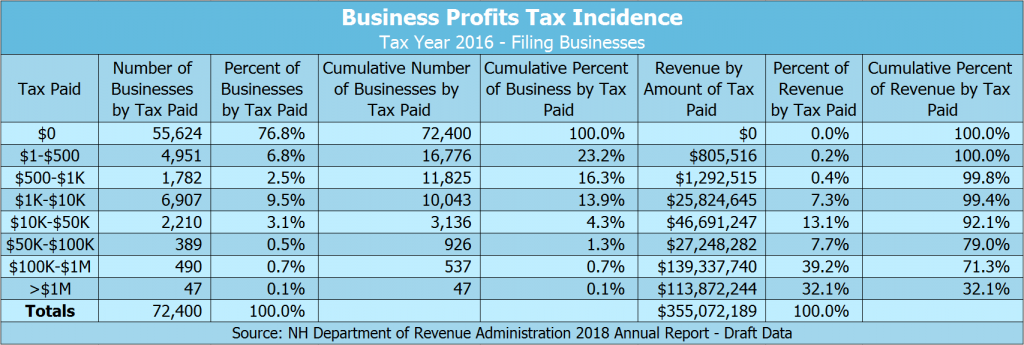
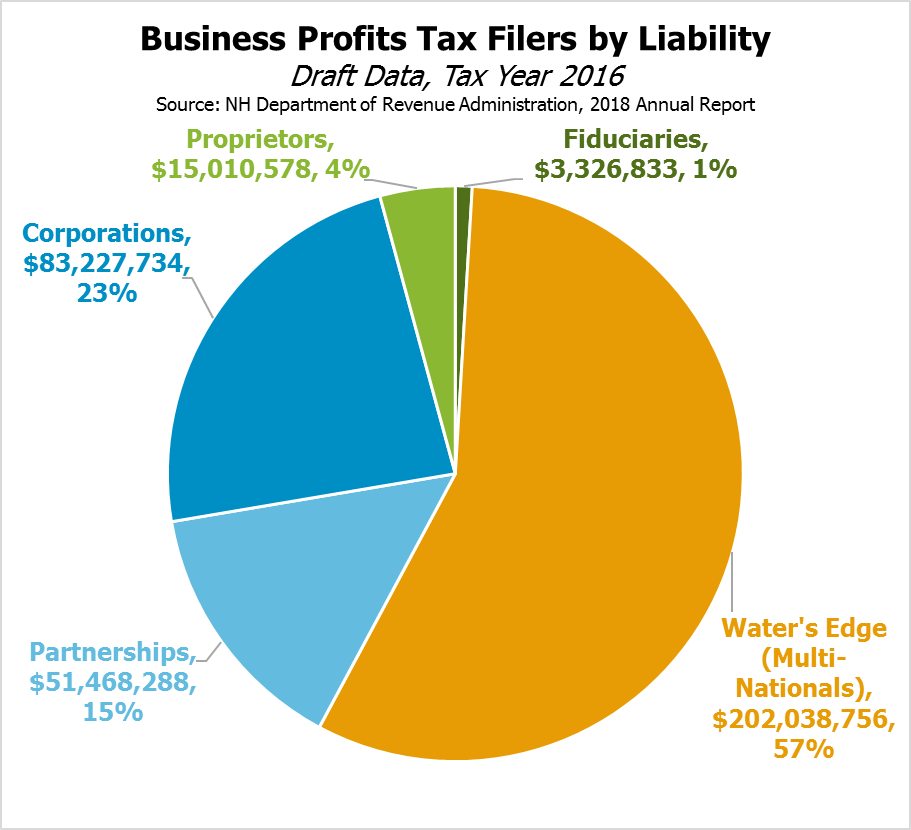
Based on the most recently available data, a relatively small number of the most profitable companies operating in the State are responsible for the majority of BPT receipts. These are not necessarily New Hampshire-based businesses; a multi-state business’s tax liability is determined by a formula based on the total sales, property, and personnel compensation paid within New Hampshire as a portion of the total of each category in any location. As such, large, multi-national businesses operating in New Hampshire but based elsewhere owe BPT payments to New Hampshire determined by their total profit and adjusted by the apportionment formula. These large businesses are likely a significant component of the BPT base, as 2016 data show 537 businesses, or about 0.7 percent of all businesses filing BPT returns, owed more than $100,000 in BPT payments and, in total, paid 71.3 percent of all BPT revenue. More than three out of every four filers owed no BPT, likely due to credits, and many other businesses registered in the state did not meet the filing thresholds.[xv]
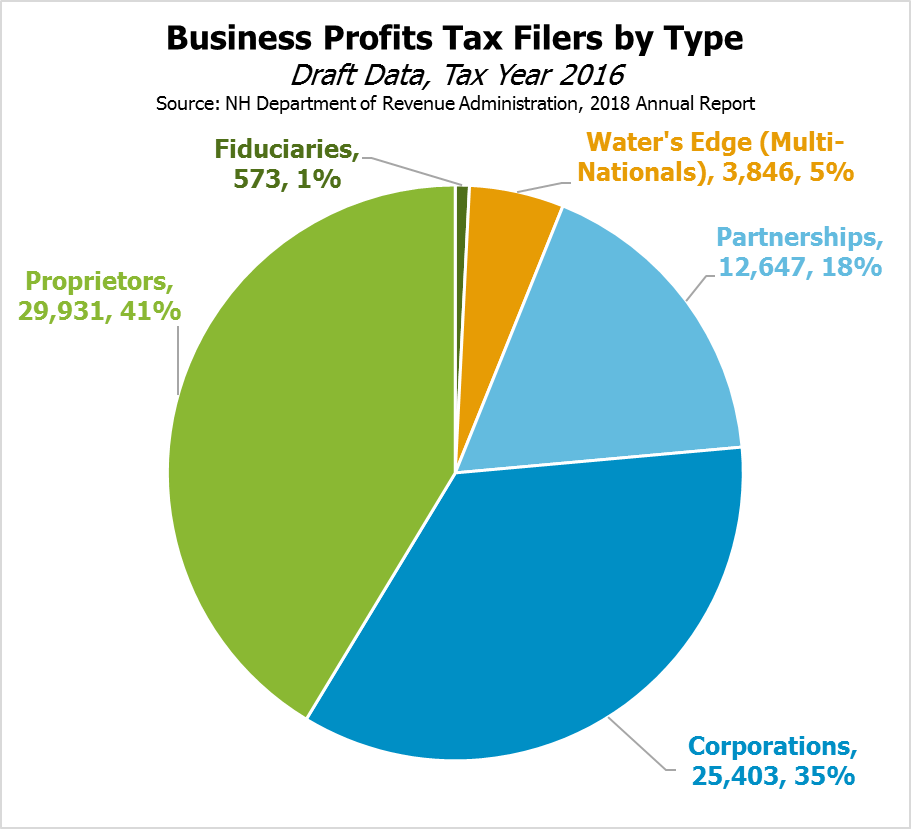
Data on the types of tax filers also suggest that large, multi-national corporations are an important component of New Hampshire’s BPT base. “Water’s edge” businesses, which include unitary businesses conducting activities within and outside of New Hampshire that also are overseas business organizations who meet certain criteria, accounted for about five percent of all BPT filers, but accounted for 57 percent of BPT tax receipts in 2016.[xvi]
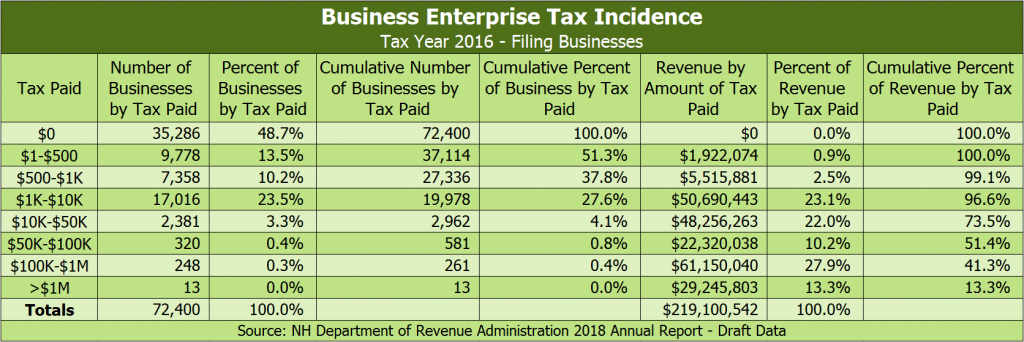
The BET has a much broader base than the BPT. While larger entities pay significant components of the BET, the distribution is not nearly as uneven as for the BPT. The businesses owing more than $50,000 in BET, which was 581 businesses (about 0.8 percent of filers) in 2016, paid just over half of BET revenue, while slightly less than half of filers owed no BET. More than twice as many businesses paid BET as paid BPT, likely due in part to BET credits against the BPT, and the largest businesses paid a smaller share of the BET than the BPT.
Components of the Business Taxes
Examining both the amount of business tax revenues collected and the types of those collections provide insights into the potential reasons for this rise in recent business tax receipts and provide hints for the future. Although available information does not permit a reliable analysis of separate BPT and BET revenues, as the two taxes are often filed together and not necessarily separated out formally until almost a year after the tax year closes, businesses pay the State in different component types that are tracked monthly.
Most business tax receipts come through quarterly estimate payments; these payments totaled 67 percent of business tax revenue in SFY 2018.[xvii] About 90 percent of businesses have a tax year that coincides with the calendar year. The State requires that companies produce estimates of expected tax liabilities for their tax years, and file estimate payments on the fourth, sixth, ninth, and twelfth month of each taxable year. As such, April, June, September, and December are important months for business tax revenues. April is also the month during which most calendar year businesses are required to file their final return or extension for the prior tax year; only partnerships are required to file in March. As such, March and April are two of the most important months for State tax revenues.[xviii]
Estimate payments provide no significant insight to the State as to why the businesses are paying the amounts they provide. Completed returns include both the actual payment and the accompanying paperwork showing the breakdown of liabilities and payments. However, businesses can file for an extension. An extension permits a business to not file a completed tax return, but requires that business to pay the entire amount they expect to owe when filing for the extension. A business with a complex tax return may wish to file a completed return later, but is still required to pay the State the amount owed in taxes at the time of the extension request, when the full return would have been filed absent the extension.[xix]
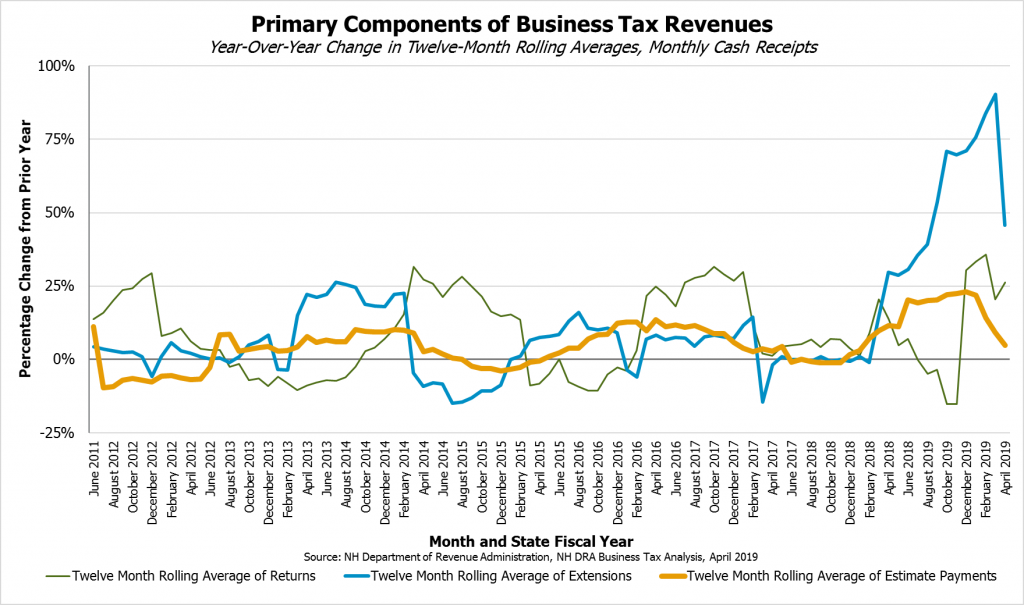
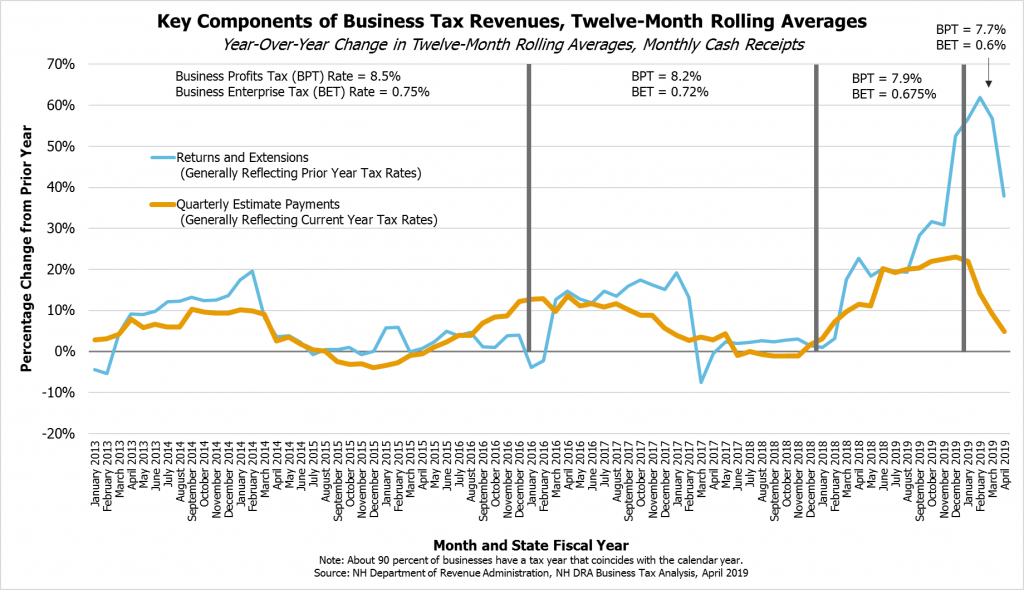
All three of these types of payments are interrelated and can change substantially across different years. While all these types of revenue sources can vary dramatically from month to month, a twelve-month rolling average of revenues compared to the prior year’s average shows the broader trends. Percentage changes in estimate payments tend to be more stable, as more revenue stems from estimate payments. Revenue from extensions, however, increased dramatically in calendar year 2018, rising well above prior recent variations. This dramatic rise was accompanied by a rise in estimate payments and followed by growth in returns, which centered around a sharp rise in return payments in December SFY 2019 likely stemming from non-calendar year business taxpayers. Growth in extensions and estimate payments have also fallen sharply. The SFYs 2018 and 2019 changes contrast with the more gradual rise in SFY 2016, which was supported by an increase in estimate payments and favorable extensions and returns, particularly in March and April of SFY 2016. These indicators suggest significant growth in the tax base during calendar year 2015, but the growth is considerably more gradual than in calendar year 2018.
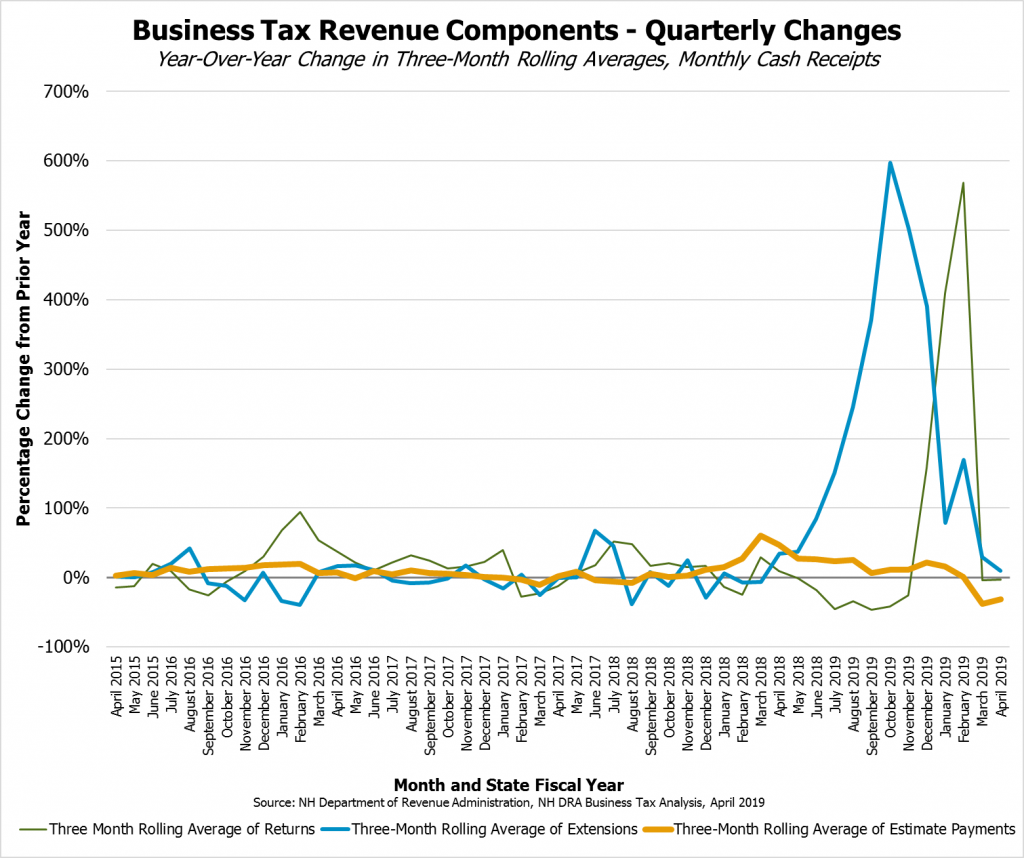
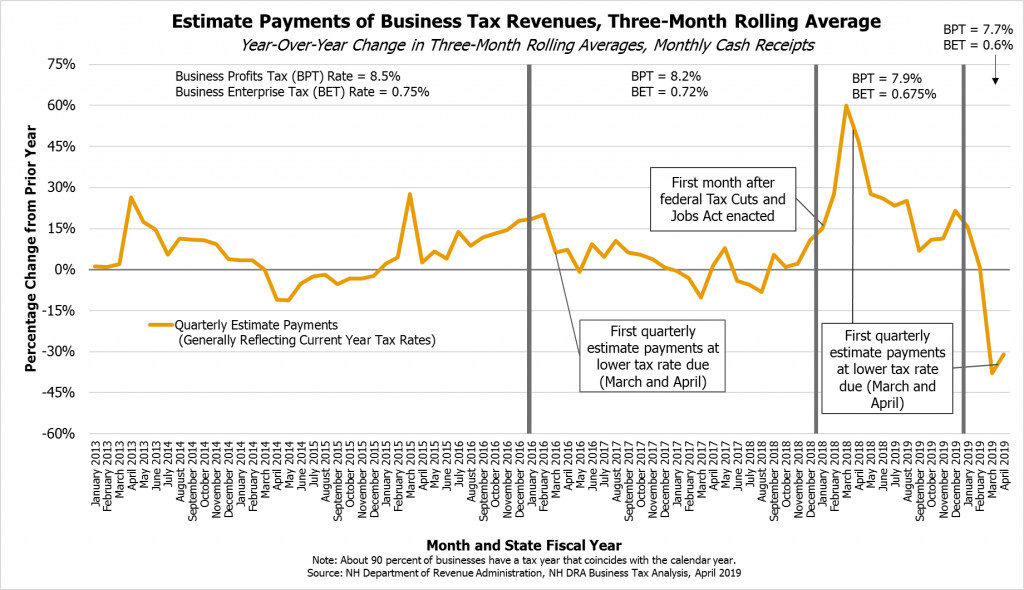
Some of these sharp changes in recent tax revenues are very clear using a shorter timeline than a twelve-month rolling average. Comparing a rolling three-month average to same quarter of the prior year shows both the oddity of the recent rises in extensions and returns, and also provides some insight into potential future trends. While there were significant fluctuations in prior years, extension revenues rose sharply in SFY 2018 and into SFY 2019, peaking at nearly 598 percent higher in August, September, and October of SFY 2019 relative to August, September, and October of SFY 2018. Returns peaked later, with the quarter ending February SFY 2019 and including the surprisingly high December SFY 2019 returns up over the prior year’s quarter by over 568 percent. The SFYs 2015-2017 rise in business taxes did not see any percentage changes as extreme. The three-month rolling averages also show estimate payments have dipped below the prior year’s payments in recent months, while growth in estimates and returns have stalled.
These extensions and returns slowing in succession suggest that businesses made changes in the tax year encompassing the Tax Cuts and Jobs Act of December 2017 that affected their New Hampshire tax liability. Revenues from extensions may have come earlier as businesses were still reacting to a newly-changed corporate tax environment after the federal tax overhaul, while businesses that owe final returns in December were able to complete returns that encompassed their tax liability changes following the federal tax overhaul. The fact that growth returned to near-zero levels for extensions and returns provides encouragement that not all changes were one-time reactions to the federal tax overhaul, and some base expansion may have occurred. However, the sharp increase and decline in growth strongly indicates policy changes, rather than economic growth, were the primary drivers of the 2018 rise in tax revenues. The lower estimate payments in March and April SFY 2019 suggest that one-time anomalies may be declining in the 2019 tax base, and also could signal lost revenue from BPT and BET rate reductions that took effect for calendar year businesses in 2019.
Economic Growth as a Contributor
Expansion of the economy appeared to have a significant role in the SFY 2015-2017 increase in tax receipts, and was a component, although likely a less significant one, of the more recent rise. The increase in Meals and Rentals Tax and Real Estate Transfer Tax receipts during SFYs 2015 and 2016 likely reflected this growing economy, as those receipts are collected monthly based on the prior month’s activities rather than in quarterly estimate payments or in returns or extensions, which may introduce a several month time lag in receipts relative to economic expansion. Hiring decisions may also be a slower response to economic growth than decisions around eating a meal at a restaurant or making a weekend trip, which would suggest that BPT and BET receipts may lag changes in the Meals and Rentals Tax.
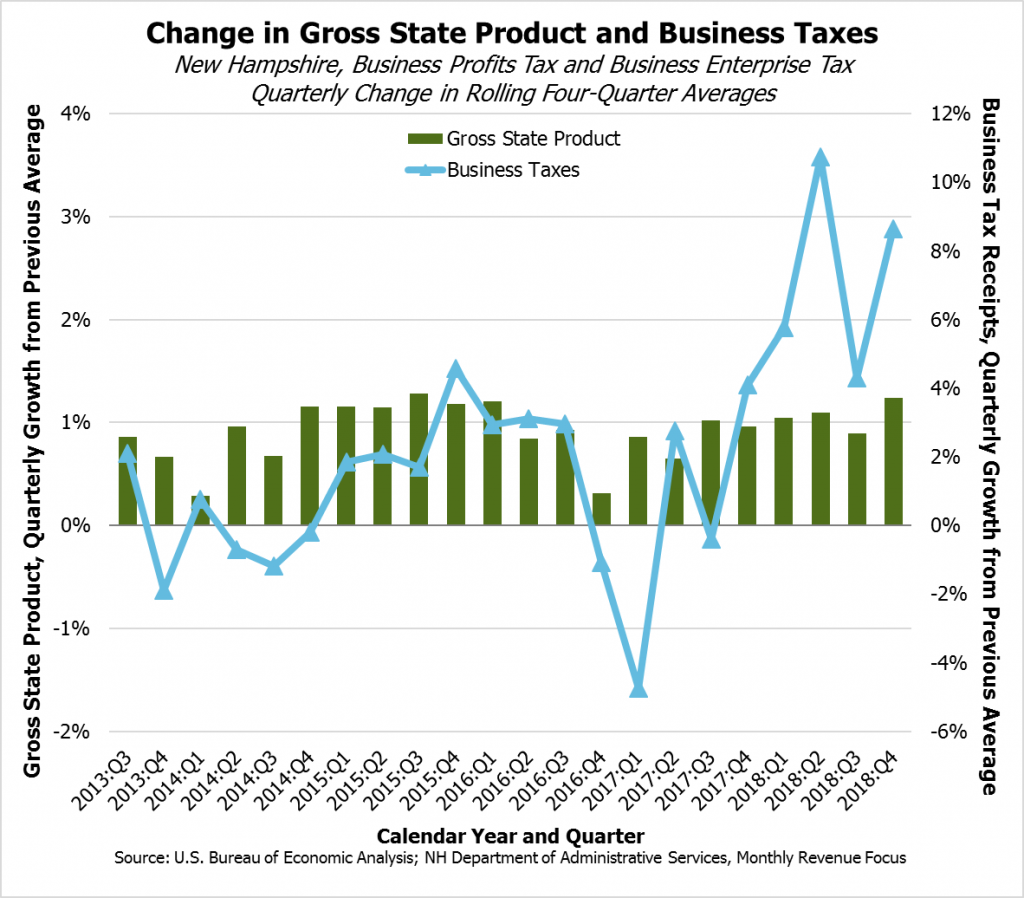
Receipts from the BPT and the BET are affected by economic growth in New Hampshire. Although BPT receipts are driven in large part by national corporate profits, including from multinational corporations, economic growth in New Hampshire is an indicator of both business activity and compensation that may be in the BPT and BET bases. The nature of business tax receipts, including the timing of payments and the one-time effects of mergers and acquisitions, swing more dramatically than changes in the size of the New Hampshire economy. Recent history suggests there is some correlation between changes in the rolling four-quarter average in New Hampshire’s Gross State Product and the same changes in four-quarter rolling averages of business tax receipts, with business taxes lagging somewhat behind higher levels of estimated growth. However, the rise in business tax receipts in 2018 far outpaced quarterly growth levels that might have been expected based on changes in Gross State Product.
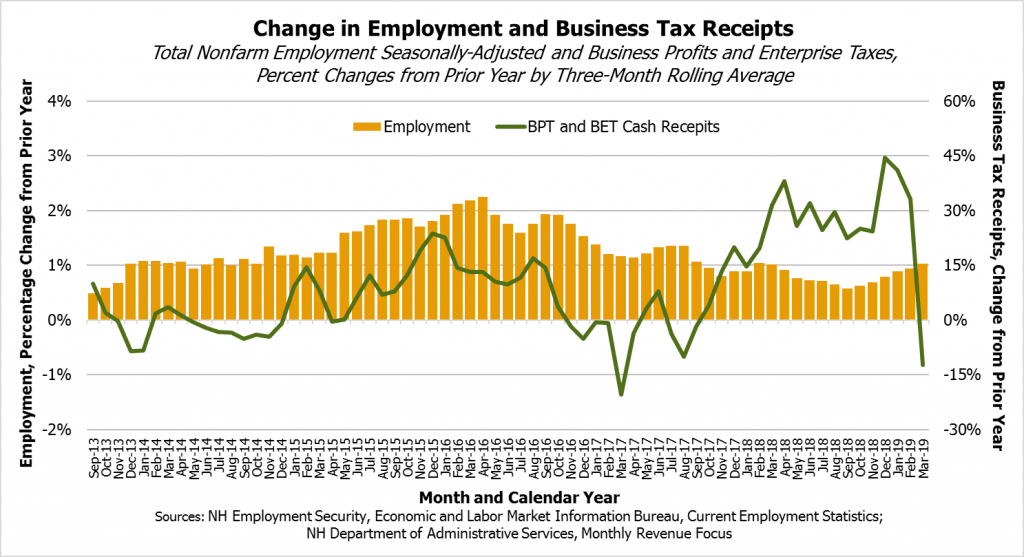
Growth in employment would also impact the tax base for the business taxes in New Hampshire, as the BPT apportionment formula includes consideration of personnel and the BET is based, in large part, on employee compensation. Relatively strong job growth estimates, rising to greater than 1.5 percent growth over the prior year on a three-month rolling average basis, using seasonally-adjusted figures, began in May 2015 and peaked in early 2016. Job growth slipped later in 2016 before returning to levels of approximately one percent or less by late 2017 and continuing through the most recently available estimates. Although growth in business tax receipts appeared to lag employment expansion during this time, robust business tax receipts did roughly coincide with higher levels of employment increases. That relationship appeared to weaken in late 2017, and appeared to largely disappear by April 2018, as business tax receipts grew at a rapid pace from the prior year while employment growth slowed. Although other components of the economy, such as a constrained labor force, may have some role in this disconnect, the divergent paths and the comparisons available through the last month of data suggest a lack of correlation between job growth and business tax receipts relative to the previous rise in business tax revenues.[xx]
Economic growth appears to have been a contributing factor for business tax receipt growth in SFYs 2015-2017, but does not appear to have been the primary driver in SFYs 2018-2019. The federal Tax Cuts and Jobs Act passed in December 2017 was much more likely to have spurred this revenue growth.
Federal Tax Overhaul Impacts
The Tax Cuts and Jobs Act (TCJA), which became federal law on December 22, 2017, made significant changes to many parts of the federal tax code, particularly with respect to the treatment of foreign-source income earned by multinational companies.[xxi] Previously, the United States taxed multinational firm income regardless of where it was earned, but taxation of income accrued within foreign subsidiaries of U.S. companies was deferred until that income was made available to the parent U.S. company. The TCJA now exempts from taxation dividends from foreign corporations paid to domestic corporations, but add several protections to ensure that profits earned abroad are taxed, although at a lower rate and only under certain conditions. The TCJA provides a tax incentive to bring assets to U.S. affiliate companies rather than hold them overseas. The TCJA also created a new deemed repatriation tax on company cash and assets held and untaxed overseas from previous years.[xxii]
Beyond the international corporate provisions, the TCJA also reduced the top marginal corporate income tax rate from 35 percent, which was at the top of a graduated schedule, down to a 21 percent rate applied on a flat basis to all corporations. Additional changes included permitting full expensing of depreciation, capping the amount of net business interest that can be deducted for larger businesses, altering rules for carrying losses, and eliminating the domestic production activities production.[xxiii]
New Hampshire is a fixed, or static, conformity state. The Legislature historically decides to adopt the federal tax code as of a certain date and decouple from specific provisions. Federal tax law changes are not adopted automatically, as they are in rolling conformity states, which gives New Hampshire policymakers time to consider their reactions to federal tax law changes. New Hampshire currently uses the federal tax code as of December 31, 2016, as the basis for its BPT liability calculations.[xxiv]
Given that New Hampshire’s tax law did not change with the passage of the TCJA, but the TCJA appears to have had a large impact on New Hampshire business tax revenues, the most likely reason for the large revenue swings may be the international component of the TCJA’s overhauls. Information is limited because of the confidentiality of, and limited information included on, State tax returns. However, while certainty is unobtainable, it is unlikely the other provisions would have had as profound or sudden an impact on New Hampshire’s current tax base. Although New Hampshire’s tax base does not include deemed repatriation, actual profits repatriated from overseas in the form of dividends would be included in New Hampshire’s tax base. Foreign profits that are actually repatriated are not subject to additional federal taxation beyond the deemed repatriation tax.[xxv]
These repatriated foreign profits likely explain the spikes in business tax revenue New Hampshire experienced in the months following the passage of the TCJA. Large multinational corporations with operations in New Hampshire are responsible for significant portions of New Hampshire’s business tax base, particularly the BPT base. These companies may have repatriated large sums from overseas back to the United States in a manner that would have appeared in the pre-TCJA tax code’s accounting or otherwise appeared in New Hampshire’s tax base, and as such generated large sums of revenue for the State, some of which was likely the result of one-time changes. To the extent corporate tax changes at the federal level prompted mergers and acquisitions, those activities may have also generated one-time increases in revenue through the BPT.
Corporate Tax Experiences in Other States and in the Federal Government
Other states have also seen notable rises in their business tax receipts. Although there has been significant volatility between states and regions, double-digit percentage increases have been common. The third quarter of 2018 saw a 29.4 percent increase in corporate tax revenue nationwide compared to the prior year.[xxvi] Other states may have automatically conformed to the new federal corporate tax code, making some comparisons to New Hampshire difficult.
Among the New England states, the key differences appear to be between the northern New England states and the southern New England states. New Hampshire, Maine, and Vermont have static conformity with the tax code, while Massachusetts, Rhode Island, and Connecticut have rolling conformity and automatically updated at least some components of the corporate tax code to match the federal tax code. Vermont and Maine updated their corporate tax codes to match the federal tax code following the TCJA, while New Hampshire has not conformed yet.[xxvii]
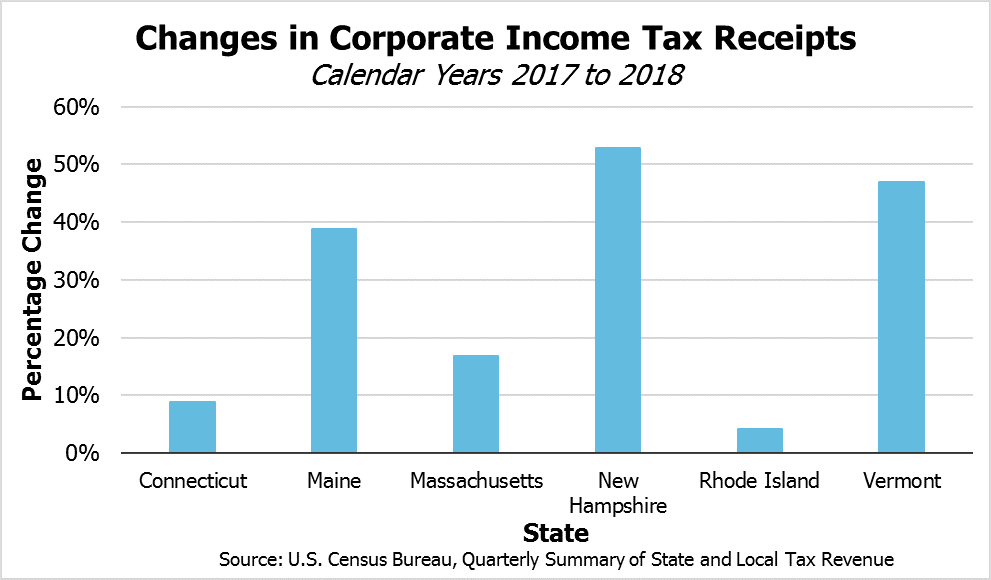
Comparing receipts during calendar year 2018 to those from calendar year 2017, New Hampshire did see the highest increase in revenue of any New England state, but Maine and Vermont also saw significant rises in revenue. Massachusetts, Rhode Island, and Connecticut saw smaller increases. Top corporate income tax rates in all New England states remained the same except for rate decreases in New Hampshire, which suggests that the differences in revenue changes between the states are predominantly explained by factors other than rate change policy decisions. Conformity decisions, the decisions of individual corporations with operations in each of the states, and potentially the unique nature of New Hampshire’s BET relative to other states may have been the primary drivers of these impacts.
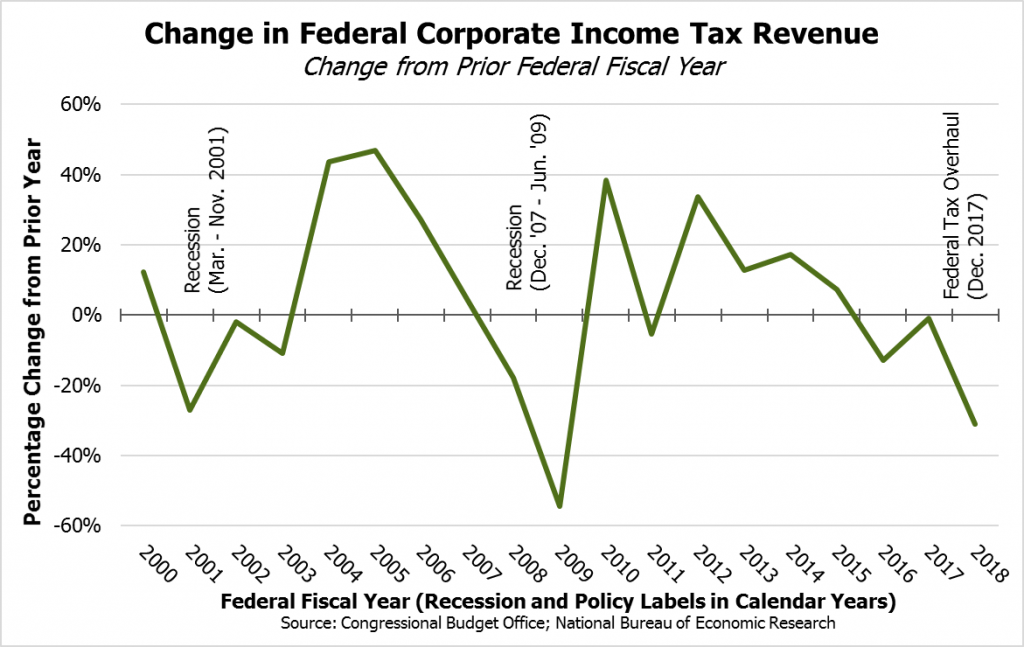
The tax rate reductions for corporate taxes at the federal level appear to have led to a decline in federal tax receipts. The decline of approximately 31 percent between federal fiscal year 2017 and federal fiscal year 2018, which began October 1, 2017, before the TCJA’s enactment, appears similar to the declines seen during recessions despite the national economic growth during this period. This suggests that the changes in federal corporate tax law have produced less corporate tax revenue for the federal government, at least during the first partial year of enactment.[xxviii]
Business Tax Rate Reductions
Although sometimes cited as a driver of economic and tax revenue growth, little evidence exists to suggest that reductions in business tax rates in New Hampshire contributed to recent net growth in business tax revenue receipts. Other causal factors are much more likely to have pushed receipts upward, and lower business tax rates likely led to an overall reduction in revenue.
To increase revenue, rate reductions would not only have to spur economic growth among businesses, which is plausible depending on how businesses decide to deploy increased post-tax revenues, but they would have to prompt enough increased business activity to generate sufficient revenue to overcome the lost revenue from reduced tax rates. If the rate reductions were the primary driver of both recent economic growth and business tax receipt increases, then the following might also have been expected:
- Hiring would have increased following the rate reductions. Hiring growth appeared strongest in early 2016, but most businesses had not paid the lower rates until the March and April quarterly estimates in 2016. Businesses may have been planning for the lower tax rates and hired staff before actually paying their first quarterly estimate payments, but these higher levels of growth did not persist. Hiring was also strong in 2015, indicating job growth was occurring before policy decisions around business taxes were made or enacted, and job growth slowed during and following 2016. Job growth was likely constrained primarily by workforce availability challenges in 2018, and revenues grew largely separately from hiring changes. Any hiring growth spurred by changes in tax rates appears to have been temporary in both years, and would be difficult to distinguish from pre-existing economic activity.
- Gross State Product growth would have increased in 2016 and 2018 relative to prior years. Gross State Product appeared to grow more slowly in 2016 than in 2015, despite business tax rate reductions taking effect in 2016. While Gross State Product growth was strong in 2018, its strength was not proportionate to the growth in business tax revenue receipts, nor was Gross State Product growth substantially higher than the pace established in late 2017.
- Other states would not have seen similar revenue growth absent rate changes. Corporate income tax revenues swung dramatically in many states across the country in the last year, including in Maine and Vermont, which saw high levels of growth. More subdued growth occurred in Massachusetts and the rest of southern New England. While swings in corporate tax receipts are not uncommon, the magnitude of these changes appeared to reflect the unsettled corporate tax environment following the TCJA. New Hampshire’s revenue growth was higher than in Maine and Vermont, but that difference is more likely to be due to the individual business decisions of large companies operating to differing degrees in the three states, and to the corporate tax base structure in each state, rather than due to tax rate decreases in New Hampshire.
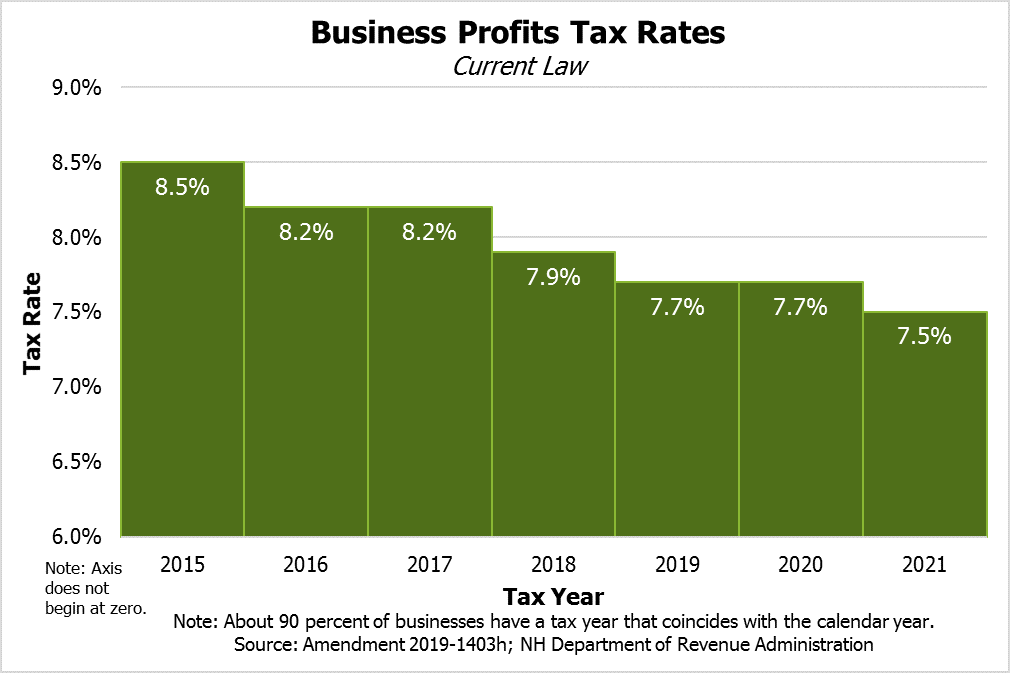
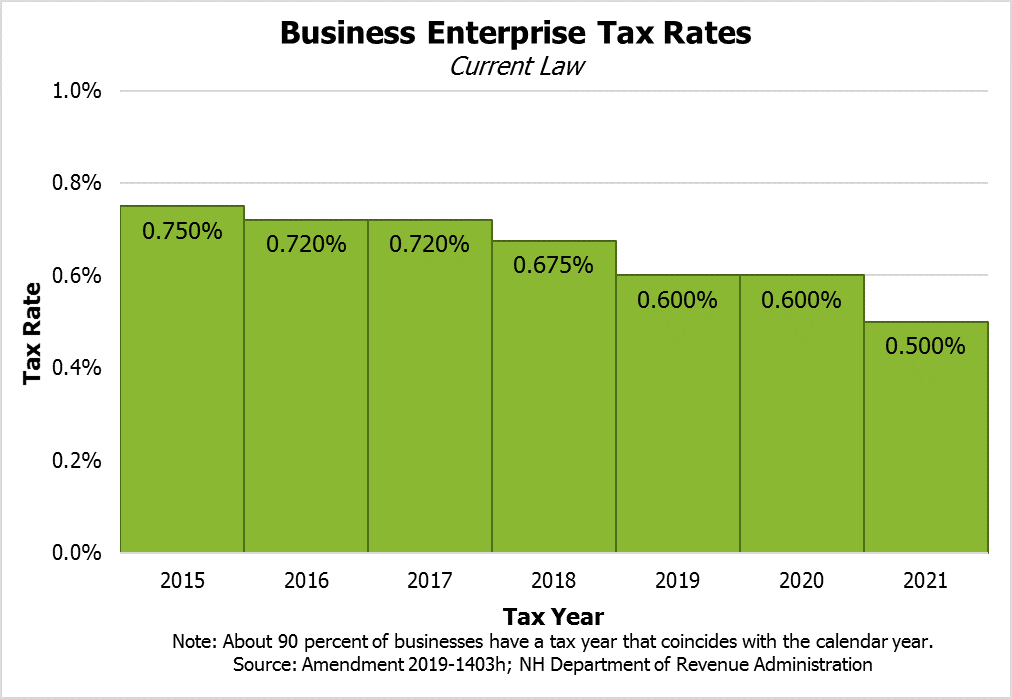
- Revenues would have grown similarly in 2016, 2018, and 2019 following the rate reductions. The business tax receipt growth in SFYs 2015-2017 began prior to the enactment and the effective date of the tax cuts, which first took effect for calendar year businesses in their first estimate payments in March or April of calendar year (and State fiscal year) 2016. Growth in estimate payments, which generally reflect the current year tax rates, slowed after the tax rate reductions, while return and extension payments, which are generally based on the prior year’s tax rates, were higher in late SFY 2016 and into SFY 2017. Estimate payments, returns, and extensions either declined or grew little in the second half of SFY 2017 and into SFY 2018, which may have reflected the impact of the lower tax rates. The increases in receipts following the passage of the TCJA in December SFY 2018 (calendar year 2017) were sharp, indicating the TCJA policy changes were likely the cause, as opposed to tax rate reductions triggering rapid economic growth. The one-time nature of some of the TCJA-related growth in receipts and additional rate reductions may be having an impact, as estimate payments for March and April SFY 2019 combined are 20.4 percent lower than estimate payments for March and April SFY 2018.
Business tax rate reductions may have contributed to economic growth in the state. However, the marginal impact of this growth relative to the deployment of those forgone revenues by public entities for services must be considered. The business tax rate reductions are also not likely to have spurred economic growth significant enough to offset the decline in revenues resulting from a reduced tax rate. The two recent rises in business tax receipts appear to be driven primarily by economic growth in the first instance, which was already occurring prior to business tax rate reductions and appeared to slow, rather than strengthen, after rate reductions, and the federal tax overhaul in the second instance. Without the federal tax overhaul, business tax receipts may have stagnated as rates were reduced, as growth in returns, extensions, and estimate payments had declined slowly but considerably following the first rate reduction and as economic growth slowed, and prior to the effects of the federal tax overhaul.
Growth in New Hampshire’s business tax receipts in the last year is very likely due primarily to changes spurred by the federal tax overhaul, suggesting that some of these revenues may be due to one-time changes in business behavior that will not bring in additional revenue in future years. April business tax receipts were slightly below last year, which also suggests one-time anomalous payments from last year may not serve as a basis for additional increases. The economy is growing, and economic expansion has helped boost business tax revenues in the recent past. However, policymakers should be cautious about expecting current levels of business tax receipts to continue, and should not expect business tax rate reductions to result in additional revenue beyond levels expected from holding rates constant.
Revenue Estimates
In this relatively uncertain revenue environment, with recent swings in two of the State’s largest tax revenue sources and questions about the durability of economic growth going forward, projecting revenues accurately is an even more difficult task than usual. There are at least five different sets of revenue projections throughout the budget process, with the first coming from the Governor’s office in the late summer before the Legislative Session to inform State agency budget requests. Those estimates are followed by an updated set included in the Governor’s budget proposal, a set from the House Ways and Means Committee, and a set from the Senate Ways and Means Committee. The final revenue estimates in a typical budget process are produced in the State Budget Committee of Conference. The House often updates its revenue estimates after April revenues are collected, and in 2019 the Governor also updated his revenue estimates following April collections.
In the 2019 Legislative Session, the Governor, the House, and the Senate Ways and Means Committee all recognized the one-time anomalies in State business tax revenues and separated them out in revenue projections. These anomalies would total an estimated $124.7 million in the SFY 2019 projections from the Governor’s office and the Senate Ways and Means Committee, and were expected to diminish over time to as low as $15.3 million for SFY 2021. Revenue stemming from growth in the typical tax base for business taxes was not expected to increase sufficiently to make up for this loss, leading to annual decline in business tax revenues expected in all published revenue projections.
The most substantial differences between the Governor’s revenue estimates and the Senate Ways and Means Committee revenue estimates, which are largely based on the Governor’s updated figures, are in the Meals and Rentals Tax and the Interest and Dividends Tax. While the Senate Ways and Means Committee projected less robust estimates than the House relative to Meals and Rentals Tax revenue, the Committee expected continued growth, suggesting less concern around an economic downturn that would affect tourism or individual decisions to eat meals at restaurants (see the Appendix for details in projection differences). The Senate also expected continued growth in Interest and Dividends Tax revenue that neither the Governor nor the House anticipated, suggesting more optimism about the economy and dividend-paying investments during the biennium than other projections. The Senate Ways and Means Committee also anticipated $40.1 million more in business tax revenue than the House over the biennium, matching the Governor’s more optimistic estimates.
In total, the Senate anticipated $87.0 million more than the House and $25.4 million more than the Governor’s February revenue estimates during the State Budget biennium. Accounting for the revenues anticipated for the remainder of SFY 2019, the Senate Ways and Means Committee estimated $75.0 million more than the Governor’s February projections and $148.0 million more than the House in the entire set of revenue projections.
Conclusion
New Hampshire policymakers face the important challenge of projecting revenues for the next two-year State Budget, which is critical for determining which services can be paid for with existing revenue sources and which must be financed with policy changes. The task of projecting revenues is particularly difficult this year given the uncertainty around the business taxes, which are responsible for the most of the State’s surplus revenue. While some other revenue sources are providing small increases, the growing importance of the businesses taxes combined with sluggish growth or declines in other key revenue sources suggest understanding recent business tax revenue behavior is vital to crafting sound policy for the future.
Although information is limited, the federal tax overhaul is clearly responsible for at least a significant portion of the large increases in business tax revenues as businesses, including large multinational companies that make up an important part of the tax base, shift their activities to respond to the federal tax changes. The extent to which these revenues are one-time is unknown, as the repatriation of income from overseas could continue, and more merger and acquisition activity may help maintain higher tax receipts. However, it is very likely that some of these payments will be anomalous and not continue. Policymakers should be cautious regarding expectations around business tax receipts, as a “new normal” has not yet been established, and a downturn in the economy would likely push revenues downward. Policymakers should be cognizant of potential changes in the economy, and should not rely on business tax rate reductions to generate additional revenue, when projecting revenues or changing policies that would support the next biennial State Budget and fund key services for Granite Staters.
Appendix – Detailed Revenue Estimates by Source
Endnotes
[i] The State Revenue Plan, derived from estimates in the State Budget, is available from the New Hampshire Department of Administrative Services, Division of Accounting Services, Revenue Plans by Fiscal Year.
[ii] Monthly cash revenue figures from the State’s primary non-federal revenue sources are available from the New Hampshire Department of Administrative Services, Division of Accounting Services, Monthly Revenue Focus.
[iii] For final revenue figures from State Fiscal Year 2018, see the New Hampshire Department of Administrative Services, State of New Hampshire Comprehensive Annual Financial Report for the Fiscal Year Ended June 30, 2018, page 6. Note Medicaid Enhancement Tax revenues and Road Toll (Motor Fuels Tax) revenues are significant, but the top four are revenue sources for the General and Education Trust Funds.
[iv] For more information on understanding the BPT and BET filings and timing, see NHFPI’s Common Cents post from March 7, 2018, Unplanned Business Tax Revenues Bolster Surplus, Prompt Questions.
[v] For SFY 2018 preliminary accrual analyses, see NHFPI’s Common Cents post from August 14, 2018, Year-End and July Revenues Show Surplus, Raise Questions About Business Taxes.
[vi] Percentage represents gross reported Interest and Dividend Tax taxable income. For a breakdown of the reported tax base by type, see Lindsey M. Stepp and Carollynn J. Lear, Overview of New Hampshire Taxes and Revenue Estimate Presentation to the Senate Ways & Means Committee, New Hampshire Department of Revenue Administration, April 3, 2019, page 17. For more discussion of the Interest and Dividends Tax, see NHFPI’s Revenue in Review resource.
[vii] For a discussion of Lottery Commission revenues, see the New Hampshire Department of Administrative Services Monthly Revenue Focus, November FY 2019. For more discussion of the Lottery Commission, see NHFPI’s Revenue in Review resource.
[viii] The Tobacco Tax separately levies a wholesale percentage tax on non-cigarette tobacco products, which accounts for about 6 percent of Tobacco Tax revenue. For more details on recent Tobacco Tax revenue trends, see Lindsey M. Stepp and Carollynn J. Lear, Joint Economic and Fiscal Briefing, New Hampshire Department of Revenue Administration, January 10, 2019, page 8. See also NHFPI’s Revenue in Review resource.
[ix] For more analysis of the Real Estate Transfer Tax, see the New Hampshire Department of Administrative Services, Monthly Revenue Focus, December FY 2019, page 4 for a recent example. See also NHFPI’s Common Cents post from June 8, 2018, May Revenues Show Rebounding Real Estate Transfer Tax.
[x] To see the details of the bills passed during the 2018 Legislative Session, see NHFPI’s Common Cents posts from May 24, 2018, Legislature Spends Most of Surplus, Raising Questions for Next Year, and from May 14, 2018, Legislature Considers Mini-Budget, Many Other Spending Bills as Session Ends.
[xi] To see the Governor’s and House total projected surplus amounts for the end of SFY 2019, see the New Hampshire Office of Legislative Budget Assistant, Comparative Statement of Undesignated Surplus, April 15, 2019. For more on the Governor’s budget proposal, see NHFPI’s Issue Brief The Governor’s Budget Proposal, State Fiscal Years 2020-2021. For more on the House budget proposal, see NHFPI’s Issue Brief The House State Budget for State Fiscal Years 2020 and 2021.
[xii] To learn more about the State Budget process, see NHFPI’s Building the Budget resource.
[xiii] For corporations, New Hampshire’s BPT return begins with Line 28 of the pre-Tax Cuts and Jobs Act federal tax form. New Hampshire is a fixed conformity state, and currently conforms to the December 31, 2016 federal tax code. To see the various forms for business tax returns in New Hampshire, see the New Hampshire Department of Revenue Administration, Forms and Instructions – Business Tax.
[xiv] For more details, see NHFPI’s Revenue in Review resource.
[xv] For more information on the portion of businesses operating in New Hampshire that pay no BPT or BET, see the New Hampshire Department of Revenue Administration, 2018 Annual Report, Summary of 2016 Business Taxes, page 48.
[xvi] For the specific statutory provisions surrounding “water’s edge” filers, see RSA 77-A, particularly RSA 77-A:1, XV. For a complete breakdown of business tax filers by type, see the New Hampshire Department of Revenue Administration, 2018 Annual Report, Summary of 2016 Business Taxes, page 49.
[xvii] To see the breakdown of estimate, return, extension, and other payments, see Lindsey M. Stepp and Carollynn J. Lear, Overview of New Hampshire Taxes and Revenue Estimate Presentation, Senate Ways & Means Committee, New Hampshire Department of Revenue Administration, April 3, 2019, slide 33, and Lindsey M. Stepp and Carollynn J. Lear, Joint Economic and Fiscal Briefing, House Finance and Ways & Means Committees, Department of Revenue Administration, January 10, 2019, slide 22.
[xviii] See RSAs 77-A and 77-E for requirements related to the requirements and timing of returns, estimates, and extensions. For planned monthly receipts, see the New Hampshire Department of Administrative Services, Division of Accounting Services, Revenue Plans by Fiscal Year.
[xix] To read more about these requirements for the BPT, see Rev 307.09 in State Administrative Rule. For the rules governing BET extensions, see Rev 2407.07.
[xx] For more on workforce constraints in New Hampshire, see NHFPI’s June 2018 Issue Brief New Hampshire’s Economy: Strengths and Constraints.
[xxi] For the full text of the Tax Cust and Jobs Act, see H.R.1 – 115th Congress.
[xxii] For more information, read William G. Gale, Hilary Gelfond, Aaron Krupkin, Mark J. Mazur, and Eric Toder, Effects to the Tax Cuts and Jobs Act: A Preliminary Analysis, Tax Policy Center, June 13, 2018. See also the New Hampshire Department of Revenue Administration, Federal Tax Reform resources and Michael Mazerov, Off The Charts, States Shouldn’t Use 2017 Federal Foreign Tax Rules to Justify Tax Cuts, April 30, 2018.
[xxiii] For more information, read William G. Gale, Hilary Gelfond, Aaron Krupkin, Mark J. Mazur, and Eric Toder, Effects to the Tax Cuts and Jobs Act: A Preliminary Analysis, Tax Policy Center, June 13, 2018. See also the New Hampshire Department of Revenue Administration, Federal Tax Reform resources.
[xxiv] For more information, see Lindsey M. Stepp and Carollynn J. Lear, Senate & House Ways & Means Joint Economic Briefing: Impact of Federal Tax Reform, New Hampshire Department of Revenue Administration, April 13, 2018.
[xxv] For more information, see Lindsey M. Stepp and Carollynn J. Lear, Senate & House Ways & Means Joint Economic Briefing: Impact of Federal Tax Reform, New Hampshire Department of Revenue Administration, April 13, 2018, slide 12.
[xxvi] See Lucy Dadayan, State Revenues Grew in Third Quarter, but Income Taxes Face Uncertain Prospects, Urban Institute, March 11, 2019.
[xxvii] For more information on rolling and static conformity, see Jared Walczak, Tax Reform Moves to the States: State Revenue Implications and Reform Opportunities Following Federal Tax Reform, Tax Foundation, January 31, 2018, and Jared Walczak, Toward a State of Conformity: State Tax Codes a Year After Federal Tax Reform, January 28, 2019.
[xxviii] For economic and federal tax data by federal fiscal year, see the Congressional Budget Office, Budget and Economic Data.