This second edition of New Hampshire Policy Points provides an overview of the Granite State and the people who call New Hampshire home. It focuses in on some of the issues that are most important to supporting thriving lives and livelihoods for New Hampshire’s residents. Moreover, the book addresses areas of key policy investments that will help ensure greater well-being for all Granite Staters and a more equitable, inclusive, and prosperous New Hampshire.
New Hampshire Policy Points is intended to provide an informative and accessible resource to policymakers and the general public alike, highlighting areas of key concerns. Touching on some important points but by no means comprehensive, each section within New Hampshire Policy Points includes the most up-to-date information available on each topic area. The facts and figures included within this book provide useful information and references for anyone interested in learning about New Hampshire and contributing to making the Granite State a better place for everyone to call home.
To purchase a print copy or download a free digital PDF of New Hampshire Policy Points, visit nhfpi.org/nhpp

Public services would not exist without resources to support them. Federal, state, and local governments all raise revenue to fund their core functions, including the infrastructure, transportation, education, and public health efforts from which all residents benefit. In New Hampshire, the methods of raising these revenues vary considerably depending on the level of government.[1]
Compositions of State and Local Revenues
Revenue for governments includes income sources beyond tax revenues, particularly for state and local governments. In State Fiscal Year (SFY) 2023, nearly seven out of every ten dollars collected by the State Government came from program revenues, rather than tax revenues, including federal funds and enterprise revenues such as liquor and lottery sales. Only about 31 percent of State funding came from general revenues, which were mostly tax receipts.[2] Of the approximately $9.5 billion in State governmental and enterprise funds revenues recorded in SFY 2023, about $3.8 billion (39.7 percent) came from federal grants to the State.[3] This total includes federal funds both within and outside of the State Budget. New Hampshire’s percentage of federal funds used for State operations is similar to the median federal portion of general revenues among all U.S. states.[4]
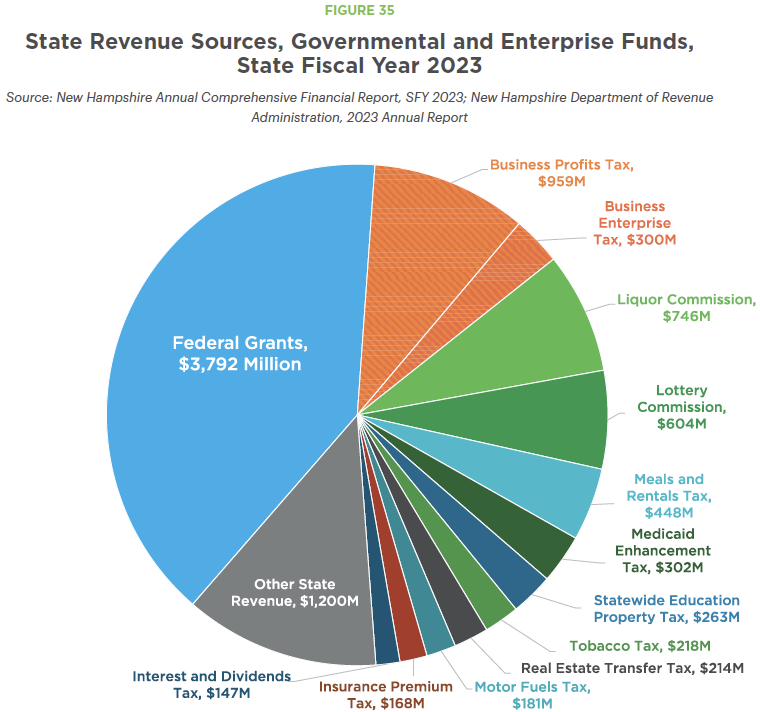
The next largest revenue sources were the combined revenues from the Business Profits Tax and the Business Enterprise Tax, followed by gross revenues generated by the Liquor Commission and the Lottery Commission. These gross non-tax revenues represent the total revenues from these enterprise sources before operating expenses are paid.[5] The next largest revenue sources for the State include the Meals and Rentals Tax, the Medicaid Enhancement Tax, and the Statewide Education Property Tax, the last of which typically raises $363 million per year, but was set to only raise $263 million temporarily for SFY 2023. Smaller revenue sources composed the remaining 22 percent of State revenues collected in SFY 2023.
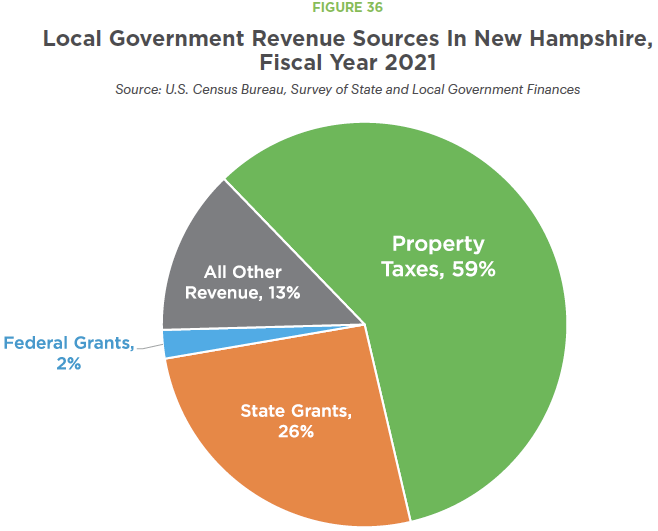
Local governments in New Hampshire, including counties, cities, towns, and school districts, have less diverse compositions of revenue, particularly relative to taxes. Aggregated data for Fiscal Year 2021, compiled by the U.S. Census Bureau, show that the majority of revenue raised by local governments comes from local property taxes. Grants from the State Government accounted for slightly more than a quarter of all local revenue, while federal grants were only about 2 percent of all revenue. Other revenue, including charges for utilities, parking, property sales, school lunches, parks, and other sources, accounted for 13 percent of all local revenue.[6]
State and Local Taxes
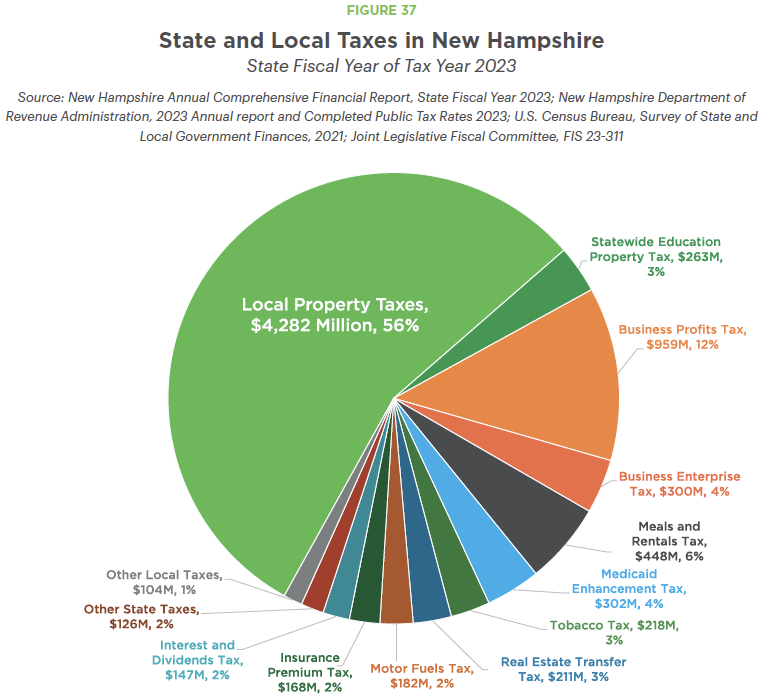
Both the New Hampshire State Government and local governments in New Hampshire rely on property taxes to fund services. However, revenue from the State Government’s Statewide Education Property Tax, the largest property tax the State Government charges, is small compared to the total amount of revenue collected through local property taxes.
Using the most recent comprehensive audited data available, local property taxes accounted for about 56 percent of the total amount of State and local taxes collected in New Hampshire. The Statewide Education Property Tax, which is raised and retained locally, is a property tax administered by municipalities that behaves like part of local property taxation but is required by the State. This tax accounted for another three percent of all State and local tax revenue, bringing property taxes to nearly three out of every five dollars of State and local taxes collected in New Hampshire.[7] Local governments have very limited options for tax revenue available to them due to the limited number of taxes they are allowed to levy under State statute.[8] While New Hampshire’s local governments collect more tax revenue than the State Government does, data from all fifty states indicate state governments collect more tax revenue, on average, than local governments do nationwide.[9]
The State has several key non-tax revenue sources. The Liquor Commission is the sole source of wine and spirits, sold either by 68 State-run stores or, in the case of wine, through licensed retailers, and generates a profit for State operations.[10] The Lottery Commission sells lottery tickets and oversees racing, charitable gaming, and sports betting activities while generating profits, after paying for winnings and operations, for State aid to local school districts.[11] Tolling on New Hampshire’s 89 miles of turnpike highways also collects revenue for the construction, reconstruction, maintenance, and patrolling of those highways.[12]
However, tax revenues provide the largest consistent sources of the most flexible funds policymakers can access and alter within the State Budget process. While federal funds are significant, those revenues are typically attached to major federal programs that impose limitations on fund uses and require State-level matching funds, such as Medicaid or funding for transportation projects.[13] In contrast, State tax revenues are under the direct control of State policymakers.
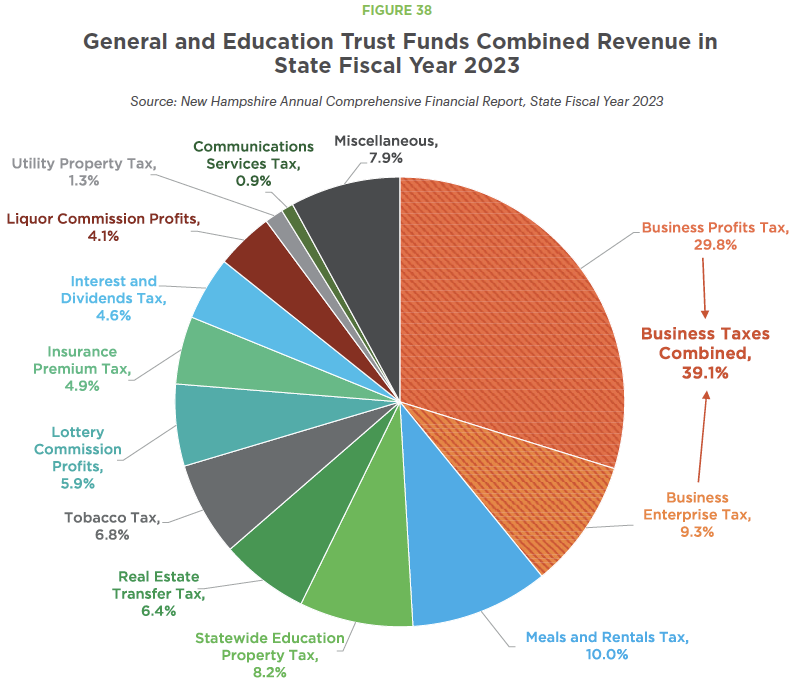
Most State Budget debates center around the deployment of General Fund dollars, which are primarily funded with tax dollars. Most of the key tax revenue sources supporting the General Fund also support the Education Trust Fund, and the General Fund fills any shortfall in the Education Trust Fund. As a result, these two funds, and their revenue sources, are often analyzed together.[14] The General Fund is also the primary recipient of Liquor Commission profits, while Lottery Commission profits are transferred to the Education Trust Fund to fund public school districts, as is required by the New Hampshire State Constitution.[15]
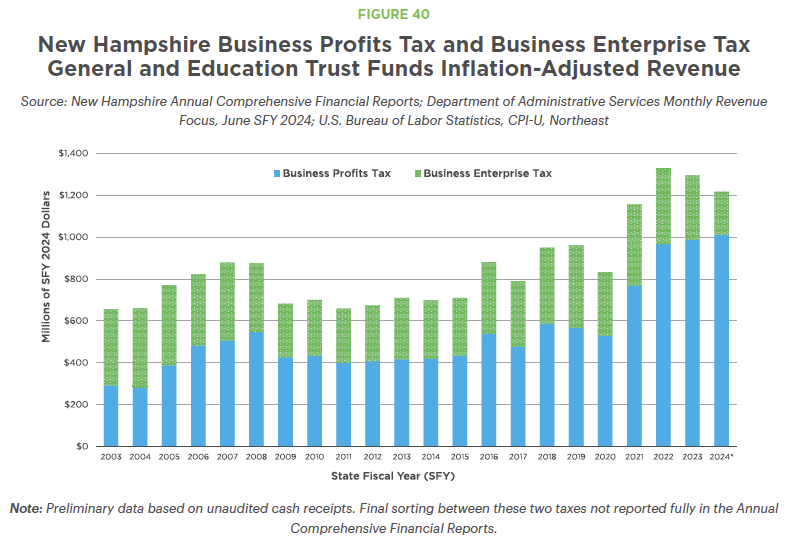
Combined General and Education Trust Funds revenue, which totaled nearly $3.22 billion in SFY 2023, stems from a relatively diverse array of revenue sources. However, the State’s two primary business taxes, the Business Profits Tax and the Business Enterprise Tax, have become increasingly dominant revenue sources relative to others, particularly the Business Profits Tax. While the two business taxes are distinct and separate taxes, businesses typically pay them together, and the revenues are not always distinguished definitively until final filings are completed, so revenues from both are often analyzed together.[16] The Meals and Rentals Tax and the Statewide Education Property Tax are the only other revenue sources either approaching or surpassing 10 percent of combined General and Education Trust Funds revenues in most recent years.
Business Profits Tax
Established in 1970, the Business Profits Tax (BPT) is the State’s largest tax revenue source. In SFY 2023, estimates suggest the BPT collected more than twice the revenue of the next largest tax revenue source. The BPT is structured similarly to a typical state corporate income tax, and New Hampshire is the only state for which the largest tax revenue source is corporate income taxes.[17] State corporate taxes are generally among the most volatile of the common types of state tax revenue.[18]
The BPT taxes a business’s net profits after certain adjustments, credits, and apportionment, which is the process for determining the portion of profits that are attributable to economic activity in New Hampshire, rather than those generated by activity in another state or country. A business’s payments of Business Enterprise Tax (BET) or Insurance Premium Tax can be used as credits against BPT liability.[19]
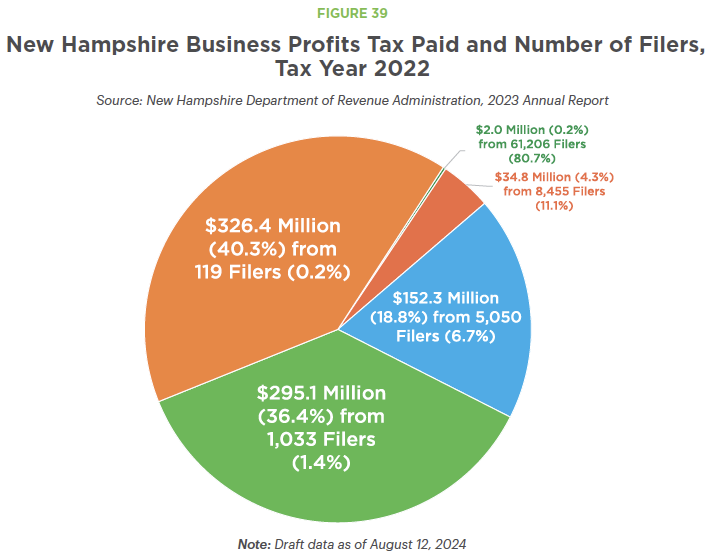
Large entities with significant profits provide most BPT revenues. In Tax Year 2022, about 1,152 filers, or 1.5 percent of all filers, paid 76.7 percent of all BPT revenues, and 119 (0.2 percent) paid 40.3 percent of all revenues collected. About 7.1 percent of filers were complex, multi-component businesses, many of which were likely operating in multiple states or countries; this 7.1 percent of filers paid 58.4 percent of all revenue collected.[20]
The BPT tax rate has been lowered incrementally since 2015, dropping from 8.5 percent that year to 7.5 percent in 2023. These changes have substantially reduced State revenue. While combined BPT and BET revenues have grown substantially since 2015, revenue growth in state corporate tax revenues has been faster nationally and in the other New England states combined than in New Hampshire.[21]
Business Enterprise Tax
Unique among state tax revenue sources, the Business Enterprise Tax (BET) is a tax on compensation paid or accrued, interest paid or accrued, or dividends paid by a business or other organization, excluding certain nonprofits and other organizations, operating in New Hampshire. Compensation, which includes all wages, salaries, fees, bonuses, and commissions, is the largest component of the tax base. BET revenue trends typically match those of total salaries and wages paid by employers in the state.[22]
The BET tax base is much broader, with revenue collections far less concentrated among the largest filers than in the Business Profits Tax (BPT) receipts. As BET paid is a credit against BPT, many businesses, particularly smaller ones with lower profits, likely pay BET and then owe no BPT due to the dollar-for-dollar credit generated by BET payments.[23]
BET rate reductions have been more significant, as a percentage of the original rate, than for the BPT. While the BET rate was 0.75 percent in 2015, it was lowered to 0.55 percent by 2022, a 26.7 percent reduction. BET revenues were lower in 2019 than they were in 2015, unadjusted for inflation, and were about the same in 2021 as they were in 2018, despite much higher salaries and wages paid by businesses in the state.[24] BET revenues were lower in 2022 than in 2021, likely reflecting a lower tax rate that took effect in 2022.[25]
The BPT and BET rate changes reduced combined revenue to the State by between $496 million and $729 million between 2016 and 2022.[26]
For combined BPT and BET revenues in Tax Year 2022, 79.1 percent of total revenue came from 5.2 percent of filers that paid any BPT or BET, which were 3.4 percent of all BPT and BET filers whether they had a tax liability or not.[27]
While both the BPT and BET are significant, estimates from the Council on State Taxation suggest businesses in New Hampshire paid more state and local tax dollars in property taxes than in the BPT and BET combined in fiscal year 2022.[28]
Meals and Rentals Tax
Often referred to as the “rooms and meals tax,” the Meals and Rentals Tax collects revenue by charging for a percentage of the sales price of restaurant and certain other prepared meals, the renting of hotel rooms, and car rentals in the state. Hotels are broadly defined to include a wide variety of rental properties, although certain sales have exceptions from the 8.5 percent tax. Revenues are typically considered a metric for tourism in the state. The tax is paid by consumers at the point of sale, and then the revenue is provided to the State Government in the month after the transaction is completed.[29]
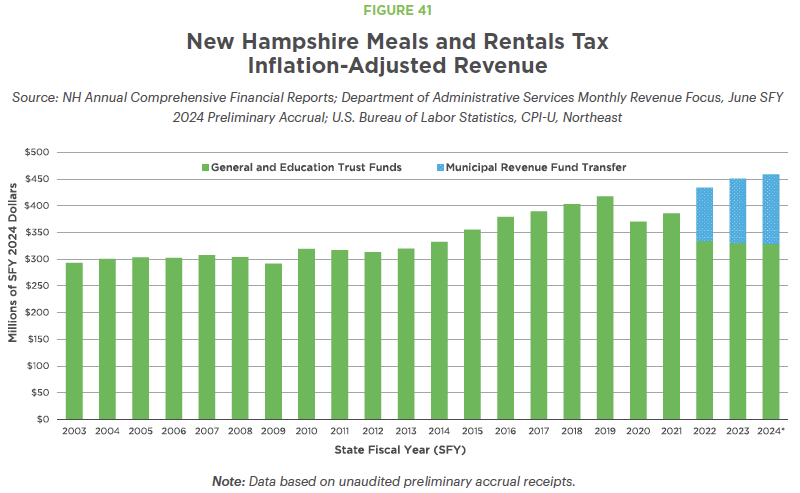
Meals and Rentals Tax revenue growth has outpaced inflation since about 2014, with the exception of a decline during the initial impacts of the COVID-19 pandemic. Tax revenue, which totaled $448.5 million in SFY 2023, has likely been lowered by a 2021 reduction in the tax rate to 8.5 percent, after the previous 9 percent tax rate had been in effect since SFY 2010. About 80 percent of revenues are typically collected from restaurant meals. Revenue from this tax flows to the General Fund, the Education Trust Fund, State aid distributed to municipalities on a per capita basis, and school building aid debt service.[30]
Statewide Education Property Tax
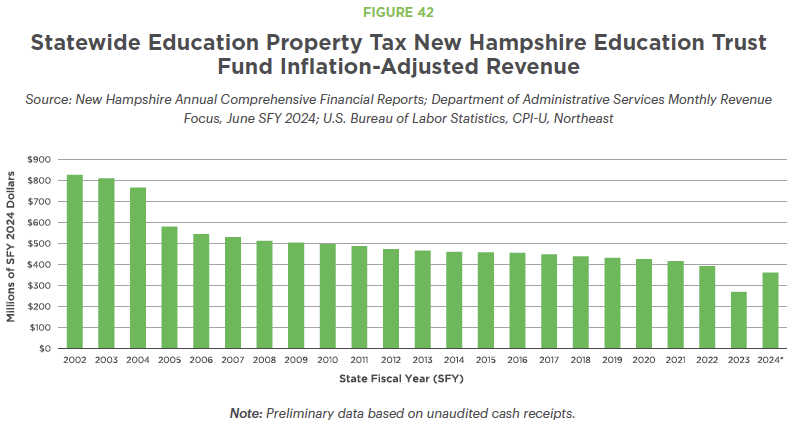
While a State tax, the Statewide Education Property Tax (SWEPT) does not result in the State directly collecting money. Established in 1999 to help fund public education, the SWEPT was reformed in 2005 to collect $363 million by taxing all property statewide at a rate sufficient to raise that amount. Property otherwise taxed as railroad or utility property, or exempt from taxation due to ownership by a nonprofit, government, or certain other types of entities, is not taxed by SWEPT. The $363 million target amount is not adjusted for inflation, and was temporarily adjusted down to $263 million in SFY 2023.[31]
The State tells municipalities, based on taxable property values within their borders, the amount of SWEPT revenue that should be raised each year.[32] Those amounts are then credited toward the amount the State owes each community for educating children in their jurisdiction based on the State’s education funding formula for local public schools. If the State owes a community more than the SWEPT amount, which is the case for most municipalities, then the State will send additional resources from the Education Trust Fund to that community for public schools. For communities that raise more in SWEPT than the State owes them according to the education funding formula, these communities retain the revenue and use it for education. Prior to 2011, these communities, which typically have a combination of relatively high property values and relatively low numbers of students, would send any excess SWEPT revenue back to the State for redistribution to fund local public education elsewhere. However, a law change in 2011 stopped this practice, and all revenue raised by SWEPT is retained locally.[33]
Medicaid Enhancement Tax
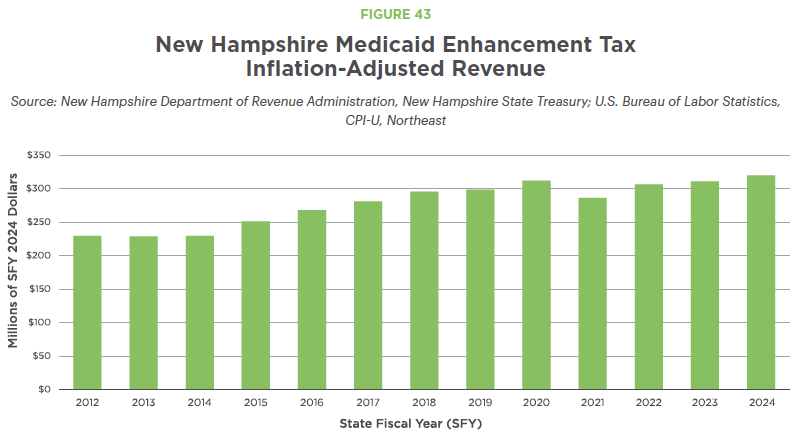
First established in 1991, the Medicaid Enhancement Tax (MET) is a 5.4 percent tax on charges hospitals make for inpatient and outpatient services minus bad debts, charity care, and certain other discounts. MET revenues are deposited in the Uncompensated Care and Medicaid Fund and used to pay hospitals for uncompensated care, or care provided to residents without health coverage and those covered under the Medicaid program, through Disproportionate Share Payments. MET revenues are collected from hospitals and used to leverage federal matching dollars. Hospitals are reimbursed, at varying rates depending on the hospital type, for uncompensated care.[34]
MET revenues formerly contributed to the General Fund, but a series of lawsuits and negotiated agreements between the hospitals and the State resulted in reforms to MET payments. Since those reforms, MET revenues not paid directly to hospitals are used to support the non-federal share of Medicaid.[35]
MET revenues are significant. The MET generated approximately $301.9 million in SFY 2023 before federal matching dollars were secured, and was the third-largest State tax revenue source that year.[36]
Tobacco Tax
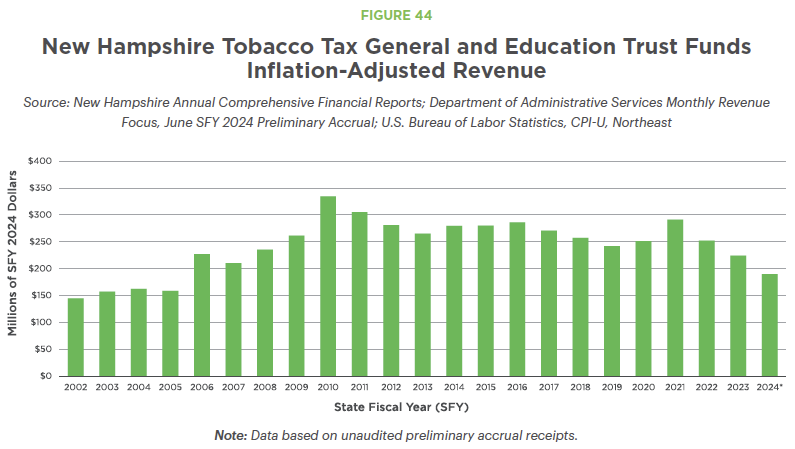
The Tobacco Tax is primarily a tax on cigarettes sold in New Hampshire, with about 86 percent of Tobacco Tax revenue coming from sales of cigarettes in SFY 2023. However, cigarette sales are in long-term decline and have dropped in three of the last five years. As a result, other taxed products that are not cigarettes are becoming a larger share of total tax revenue.[37] The Tobacco Tax also taxes other tobacco products, excluding premium cigars, and was expanded to tax electronic cigarettes in 2020.[38]
The tax rate is $1.78 per pack of 20 cigarettes and is adjusted for pack size, but is not adjusted for inflation over time. The closest states to New Hampshire geographically with lower cigarette tax rates are Virginia, West Virgina, and Ohio. Other tobacco products are taxed at 65.03 percent of the wholesale sales price. Electronic cigarettes are taxed at $0.30 per milliliter for cartridges and 8 percent of the wholesale price for liquids or other substances containing nicotine in openable containers.[39]
Tobacco Tax revenue increased in SFY 2021, likely due to stringent limits imposed on the availability of menthol and flavored tobacco products in Massachusetts that year, leading to more cross-border sales. However, the Tobacco Tax is likely a revenue source in long-term decline due to tobacco use cessation efforts.[40]
Real Estate Transfer Tax
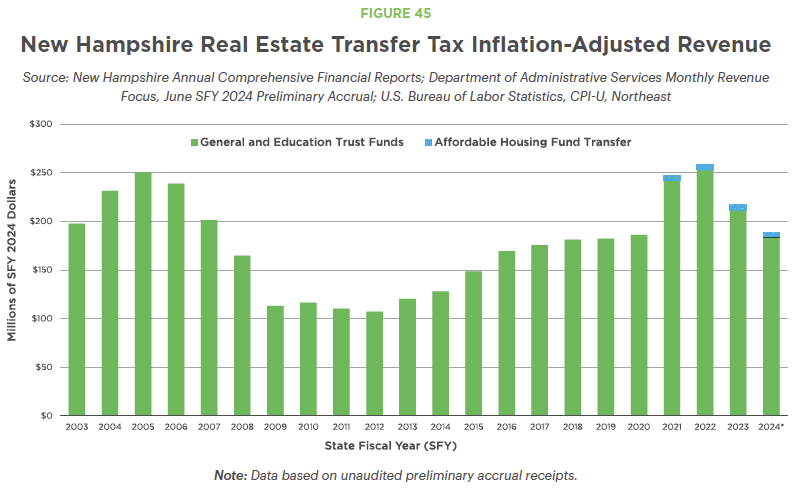
New Hampshire collects revenue from the sale of any real estate, or any interest in real estate, through the Real Estate Transfer Tax (RETT). The RETT requires both the purchaser and seller to pay $0.75 per every $100 in property being transferred, for a total tax rate of $1.50 per $100. Certain properties and transfers are exempt, and most of the variation in RETT revenue is based on single-family house and condominium sales.[41]
Increases in housing market prices both prior to and following the start of the COVID-19 pandemic boosted RETT revenues as housing sale prices climbed. The RETT was the second-largest driver of State revenue growth between 2019 and 2022, following revenue from the combined business taxes. However, revenues have fallen substantially as the State’s housing shortage, high prices, and relatively high interest rates have reduced the number of sales.[42] RETT revenue totaled $210.5 million in SFY 2023, including $5 million transferred to the Affordable Housing Fund.[43]
Interest and Dividends Tax
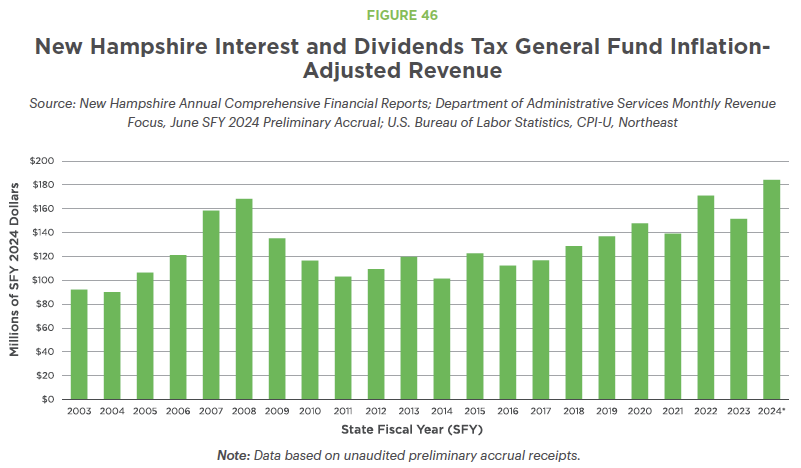
The Interest and Dividends Tax is a 3 percent tax on the income of individuals, joint filers, and specific types of business entities that is generated from wealth. Specifically, income from interest, dividends, and distribution income derived from the ownership of certain assets, such as stocks or shares in a company, are taxable, while key forms of retirement income are not taxable.[44]
Tax revenues have increased with higher interest rates and positive stock market performance since the start of the COVID-19 pandemic. Revenues totaled $147.3 million for the General Fund in SFY 2023, and will likely be substantially higher in SFY 2024.[45]
Established in 1923, the Interest and Dividends Tax had a rate of 5 percent from 1977 to 2022, dropping to 4 percent in 2023 and 3 percent in 2024, and will be repealed entirely in 2025. Economic modeling suggests high-income households will disproportionately benefit from the repeal. Tax filers with more than $200,000 in income taxable under this tax, which does not include income such as salaries and wages, accounted for about 3.1 percent of filers and paid 58 percent of the tax revenue collected in Tax Year 2022. Filers generating this amount of tax liability likely held substantially more than $1 million in income-generating assets.[46]
Other State Taxes
New Hampshire has several other key State tax revenue sources. While these taxes typically provide less revenue than the taxes previously reviewed, they help support key services and add to the diversity of New Hampshire’s tax base.
The Motor Fuels Tax, formally called the Road Toll, is a $0.222 per gallon tax on gasoline and diesel fuel sold in the state. Aviation fuels are taxed at different rates, and certain uses, such as governmental and off-highway uses, are exempt. Revenues are used to support the Highway Fund, including road maintenance operations, bond payments for construction projects, and distributions of highway and bridge aid to municipalities. Motor Fuels Tax revenues totaled $180.6 million in SFY 2023.[47] The State also charges vehicle registration fees, including additional fees for electric vehicles and plug-in hybrids.[48]
The Insurance Premium Tax, administered by the New Hampshire Insurance Department, is based on net premiums charged by insurance companies. Most types of insurance have a 1.25 percent tax rate, but health, accident, and certain other insurers must pay at a 2 percent rate. When other states tax New Hampshire-based insurers in excess of the New Hampshire Insurance Premium Tax rate for operating in their state, New Hampshire requires insurers from those states who are operating locally to pay that same higher rate. Revenues collected go to the General Fund and the non-federal share of the Granite Advantage Medicaid program, and totaled about $168.1 million in SFY 2023.[49]
The Utility Property Tax charges a tax of $6.60 per $1,000 on the property value owned by utilities based on the State assessments. This tax compliments the SWEPT, which does not apply to utility property that may be in local property tax bases. This tax generated $42.9 million for the Education Trust Fund in SFY 2023.[50]
The Nursing Facility Quality Assessment is a 5.5 percent tax on net revenues related to patient services at nursing facilities in the state. Using a similar mechanism as the Medicaid Enhancement Tax, the funds collected are used to match federal dollars through Medicaid, and the total funds raised are distributed back to nursing facilities through the Medicaid Quality Incentive Payment. This tax raised about $41.8 million in SFY 2023.[51]
The Communications Services Tax is a 7 percent tax on two-way electromagnetic communications, and generates most of its revenue from taxing telephone, paging, and specialized radio services. Communication services for health, safety, and welfare, as well as one-way broadcast services, are exempt. Revenue from this tax, which goes to the General Fund, declined following the State Legislature’s decision to stop collecting taxes on internet services in 2012. Revenue peaked at $81.0 million in SFY 2010 but totaled only $28.1 million in SFY 2023.[52]
The Beer Tax, administered by the Liquor Commission, taxes beer sold to the public at $0.30 per gallon. This tax generated $12.9 million in SFY 2023, and typically raises about $13 million each year.[53]
Economic Effects of Taxes and Services
Taxes can and do impact economic activity, particularly in extreme or very specific cases. Depending on the economic effects of the services funded by tax revenue, taxes can slow overall economic growth by discouraging work or investments, particularly in response to very high tax rates. Taxes on specific items or situations can also impact behavior, such as influencing decisions when specific goods are taxed at different rates, increasing charitable giving in response to incentives, or construction of houses in one jurisdiction rather than another. However, while individuals and companies may respond differently to changes in taxes, research on the aggregate effects suggests small changes in taxes have a relatively limited overall impact on the economy, including at the state level. Reviews of available research on state-level tax policy indicate no clear consensus exists within the research on the relationship between studied tax changes and economic growth.[54]
While marginal or incremental changes in taxes may not have conclusive effects on state economies overall, not all residents within a state are equally impacted by taxes. Analysis from the Institute on Taxation and Economic Policy indicates that families with lower incomes in New Hampshire are more likely to pay a greater share of their incomes in state and local taxes than those with higher incomes. The effective state and local tax rate for taxpayers in the bottom 20 percent, with under $35,000 per year in income, was about three times the rate of those in the top 1 percent of the income scale, with incomes of $721,000 or more.[55]
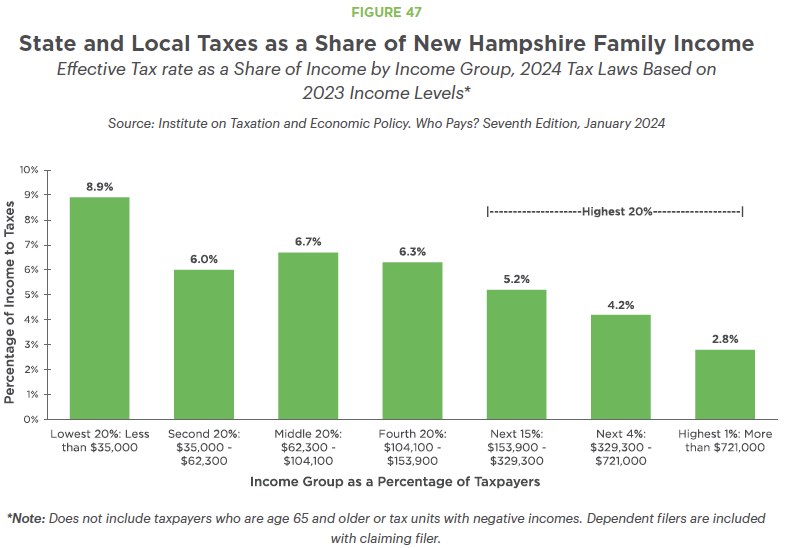
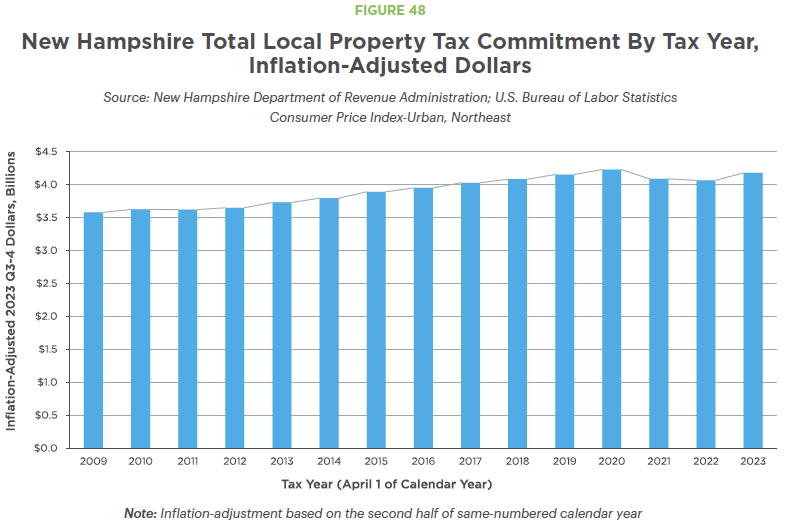
Property taxes, including costs passed on to renters, are the primary reason for higher effective tax rates for households and families with lower incomes in New Hampshire. Effective property tax rates are highest on the lowest income taxpayers as a percentage of income, and result in substantially higher effective tax rates for middle-income families than for the highest income households.[56] Aggregate increases in local property taxes have outpaced inflation in all but three years since 2009. Two of those years, 2021 and 2022, followed both increases in State aid to local governments and substantial, one-time investments by the federal government in municipal and county governments and school districts, which may have enabled lower property tax collections.[57]
Available research suggests higher effective tax rates on households with lower incomes may be particularly detrimental to the economy. Separate analyses from the U.S. Congressional Budget Office, Moody’s Analytics, and the U.S. Congressional Research Service suggest that the most economically stimulative tax reductions or public expenditures are those targeted at getting more resources to individuals with lower incomes and fewer resources, while tax reductions for higher income households have had very small impacts on economic growth.[58]
These analyses suggest state and local taxes in New Hampshire may be slowing economic growth more than necessary because of the incidence of taxes on households. Higher effective tax rates on individuals and families with lower incomes may slow economic growth substantially more than a higher tax rate on households with more financial capacity.
• • •
This publication and its conclusions are based on independent research and analysis conducted by NHFPI. Please email us at info@nhfpi.org with any inquiries or when using or citing New Hampshire Policy Points in any forthcoming publications.
© New Hampshire Fiscal Policy Institute, 2024.
Endnotes
[1] For more information regarding all the material reviewed in this section, see NHFPI’s July 14, 2024 presentation Funding Public Services in New Hampshire at the State and Local Levels and NHFPI’s May 2017 publication Revenue in Review: An Overview of New Hampshire’s Tax System and Major Revenue Sources.
[2] See the State of New Hampshire’s Annual Comprehensive Financial Report for the Fiscal Year Ended June 30, 2023, page 22.
[3] See the State of New Hampshire’s Annual Comprehensive Financial Report for the Fiscal Year Ended June 30, 2023, pages 37 and 42.
[4] For more information, see the Pew Charitable Trust’s August 2023 analysis Pandemic Aid Lifts Federal Share of State Budgets to New Highs.
[5] For more information on Liquor Commission and Lottery Commission revenues, see the Annual Comprehensive Financial Reports for SFY 2023 for the New Hampshire Liquor Commission and the New Hampshire Lottery Commission.
[6] Data collected through the U.S. Census Bureau’s Annual Survey of State and Local Government Finances.
[7] Information used in this analysis of State and local tax revenue sources derived from the New Hampshire Annual Comprehensive Financial Report for SFY 2023, the New Hampshire Department of Revenue Administration’s 2023 Annual Report and 2023 Municipal Tax Rates, the New Hampshire Department of Health and Human Services Fiscal Item FIS 23-311 presented to the Joint Legislative Fiscal Committee, and the U.S. Census Bureau’s Annual Survey of State and Local Government Finances for Fiscal Year 2021, the most recent available at the time of publication.
[8] See the New Hampshire Municipal Association’s Municipal State Aid and Revenue Sharing: History and Trends, October 2022, pages 3 and 4.
[9] See the U.S. Census Bureau’s Annual Survey of State and Local Government Finances for Fiscal Year 2021.
[10] See the New Hampshire Liquor Commission’s Annual Comprehensive Financial Report for SFY 2023, page 4.
[11] See the New Hampshire State Constitution, Part Second, Article 6-b, and the State Treasurer’s State of New Hampshire Information Statement, pages 14, 26, and 27.
[12] See RSA 237 and the New Hampshire Annual Comprehensive Financial Report for the Fiscal Year Ended June 30, 2023, page 39.
[13] See NHFPI’s February 2017 publication Building the Budget, page 12, and the State Treasurer’s State of New Hampshire Information Statement, pages 28 and 47-63.
[14] Examples include the revenue estimates produced by the House and Senate Ways and Means Committees and regular reporting on State revenues produced by the New Hampshire Department of Administrative Services.
[15] See the New Hampshire State Constitution, Part Second, Article 6-b.
[16] For more information on the Business Profits Tax and the Business Enterprise Tax, see NHFPI’s August 2023 issue brief State Business Tax Rate Reductions Led to Between $496 Million and $729 Million Less for Public Services.
[17] See the Pew Charitable Trusts, How States Raise Their Tax Dollars, FY 2023.
[18] See the Tax Policy Center’s November 2017 report Revenue Volatility: How States Manage Uncertainty and the Pew Charitable Trusts May 2024 analysis Tax Revenue Volatility Is Increasing in Most States.
[19] See RSA 77-A and the New Hampshire Department of Revenue Administration’s Business Taxes webpage for more details.
[20] See the New Hampshire Department of Revenue Administration’s 2024 annual report, page 48.
[21] See NHFPI’s August 2023 issue brief State Business Tax Rate Reductions Led to Between $496 Million and $729 Million Less for Public Services and NHFPI’s February 2024 Data Byte New Hampshire Corporate Tax Revenue Increases Lag Behind Other States.
[22] For more information on the BET, see RSA 77-E, NHFPI’s April 2024 presentation New Hampshire’s Business Enterprise Tax, and NHFPI’s August 2023 issue brief State Business Tax Rate Reductions Led to Between $496 Million and $729 Million Less for Public Services.
[23] See the New Hampshire Department of Revenue Administration’s December 2023 report Tax Expenditure and Potential Liability Report, Fiscal Year 2023, page 15.
[24] See NHFPI’s April 2024 presentation New Hampshire’s Business Enterprise Tax, slide 10, and NHFPI’s August 2023 issue brief State Business Tax Rate Reductions Led to Between $496 Million and $729 Million Less for Public Services.
[25] See NHFPI’s August 2023 issue brief State Business Tax Rate Reductions Led to Between $496 Million and $729 Million Lessfor Public Services.
[26] See NHFPI’s August 2023 Issue Brief State Business Tax Rate Reductions Led to Between $496 Million and $729 Million Less for Public Services.
[27] See the New Hampshire Department of Revenue Administration’s 2024 annual report, pages 46-48.
[28] See the Council on State Taxation’s December 2023 report Total State and Local Business Taxes.
[29] For more information on the Meals and Rentals Tax, see RSA 78-A and the New Hampshire Department of Revenue Administration’s Meals and Rooms (Rentals) Tax webpage.
[30] See NHFPI’s January 2024 blog Proposed Tax Reductions Would Deeply Diminish Revenues for Public Services and NHFPI’s May 2022 blog Significant Revenue Surplus Largely Generated by Business Taxes in Federally-Boosted Economy.
[31] See RSA 76:3 and NHFPI’s May 2021 blog Statewide Education Property Tax Change Provides Less Targeted Relief to learn more about the mechanics of the SWEPT.
[33] For additional references, see NHFPI’s May 2021 blog Statewide Education Property Tax Change Provides Less Targeted Relief to learn more about the mechanics of the SWEPT.
[34] See RSA 84-A and the State Treasurer’s April 2023 State of New Hampshire Information Statement, pages 22-24.
[35] Learn more in the State Treasurer’s April 2023 State of New Hampshire Information Statement, page 24.
[36] See the New Hampshire Department of Revenue Administration’s 2023 Annual Report, pages 42 and 43, and the New Hampshire Annual Comprehensive Financial Report for the Fiscal Year Ended June 30, 2023, page 7.
[37] For more detailed data, see the New Hampshire Department of Revenue Administration’s 2023 Annual Report, page 38.
[38] See RSA 78 and the New Hampshire Department of Revenue Administration’s 2023 Annual Report, page 11.
[39] See the New Hampshire Department of Revenue Administration’s 2023 Annual Report, page 39.
[40] See the New Hampshire Department of Revenue Administration’s January 11, 2023 presentation to the House and Senate Ways and Means Committees and the Department’s May 3, 2023 presentationto the Senate Ways and Means Committee.
[41] See RSA 78-B, NHFPI’s March 4, 2022 presentation to the House and Senate Ways and Means Committees, NHFPI’s January 17, 2023 presentation to the House Ways and Means Committee, and the New Hampshire Department of Revenue Administration’s January 11, 2023 presentation to the House and Senate Ways and Means Committees.
[42] See NHFPI’s May 2024 blog State Revenues Add to Surplus, But Suggest Potential Trouble Ahead: Seven Takeaways from April Revenue Figures, NHFPI’s June 2024 blog May State Revenues Show Continued Decline in Key Tax Revenue Sources, and NHFPI’s May 2022 blog Significant Revenue Surplus Largely Generated by Business Taxes in Federally-Boosted Economy.
[43] See the New Hampshire Annual Comprehensive Financial Report for the Fiscal Year Ended June 30, 2023, page 7 and the New Hampshire Department of Revenue Administration’s 2023 Annual Report, page 43.
[44] See RSA 77, the New Hampshire Department of Revenue Administration’s January 11, 2023 presentation to the House and Senate Ways and Means Committees, and the Department’s July 2024 I&D Quick Checklist.
[45] See the New Hampshire Annual Comprehensive Financial Report for the Fiscal Year Ended June 30, 2023, page 7, the New Hampshire Department of Administrative Services’ Monthly Revenue Focus, FY June 2024 Preliminary Accrual and Monthly Revenue Focus April FY 2024, and the New Hampshire Department of Revenue Administration’s January 11, 2023 presentation to the House and Senate Ways and Means Committees.
[46] See NHFPI’s written presentation to the House Ways and Means Committee on January 16, 2024, NHFPI’s March 2024 blog Households with High Incomes Disproportionately Benefit from Interest and Dividends Tax Repeal, and the Institute on Taxation and Economic Policy’s Who Pays? 7th Editionanalysis for New Hampshire. See also the New Hampshire Department of Revenue Administration’s 2023 Annual Report, page 49.
[47] See RSA 260, the New Hampshire Annual Comprehensive Financial Report for the Fiscal Year Ended June 30, 2023, pages 34 and 119.
[48] See RSA 261:141 and RSA 261:141-c.
[49] See RSA 400-A, the New Hampshire Annual Comprehensive Financial Report for the Fiscal Year Ended June 30, 2023, page 7, and the State Treasurer’s April 2023 State of New Hampshire Information Statement, page 24.
[50] See RSA 83-F for more details, and the New Hampshire Annual Comprehensive Financial Report for the Fiscal Year Ended June 30, 2023, page 7 for revenue figures.
[51] See RSA 84-C, NHFPI’s July 2022 publication Long-Term Services and Support in New Hampshire: A Review of the State’s Medicaid Funding for Older Adults and Adults with Physical Disabilities, page 18, and the New Hampshire Department of Revenue Administration’s 2023 Annual Report, page 42.
[52] See RSA 82-A, the New Hampshire State Treasurer’s State of New Hampshire Information Statement, page 22, NHFPI’s January 2024 blog Proposed Tax Reductions Would Deeply Diminish Revenues for Public Services, and NHFPI’s August 2018 blog Year-End and July Revenues Show Surplus, Raise Questions About Business Taxes.
[53] See RSA 178:26 and the New Hampshire Annual Comprehensive Financial Report for the Fiscal Year Ended June 30, 2023, page 148.
[54] See the Tax Policy Center’s Briefing Book, updated January 2024, How Do Taxes Affect the Economy in the Long Run?, the December 2015 National Tax Journal article The Relationship Between Taxes and Growth at the State Level: New Evidence, and research collected in NHFPI’s August 2023 issue brief State Business Tax Rate Reductions Led to Between $496 Million and $729 Million Less for Public Services.
[55] See NHFPI’s January 2024 blog post Granite Staters with Lowest Incomes Have Highest Effective State and Local Tax Rate and the Institute on Taxation and Economic Policy’s Who Pays? 7th Editionanalysis for New Hampshire.
[56] See NHFPI’s January 2024 blog Granite Staters with Lowest Incomes Have Highest Effective State and Local Tax Rate and the Institute on Taxation and Economic Policy’s Who Pays? 7th Edition analysis for New Hampshire.
[57] For State Budget investments, see NHFPI’s September 2021 presentation The State Budget for Fiscal Years 2022-2023: State Aid to Local Governments, NHFPI’s December 2019 issue brief The State Budget for Fiscal Years 2020 and 2021, and NHFPI’s August 2021 issue brief The State Budget for Fiscal Years 2022 and 2023. For federal investments, see NHFPI’s March 2021 blog Federal American Rescue Plan Act Directs Aid to Lower-Income Children, Unemployed Workers, and Public Services, NHFPI’s July 2024 blog Local Governments Nearing Deadline to Obligate Federal Funds with Millions of Dollars at Risk, and NHFPI’s April 2020 issue brief The COVID-19 Crisis in New Hampshire: Initial Economic Impacts and Policy Responses.
[58] See the U.S. Congressional Research Service’s December 2012 report Taxes and the Economy: An Economic Analysis of the Top Tax Rates Since 1945 (Updated), the U.S. Congressional Budget Office’s February 2015 report Estimated Impact of the American Recovery and Reinvestment Act on Employment and Economic Output in 2014, the November 2011 testimony from the Director of the U.S. Congressional Budget Office Policies for Increasing Economic Growth and Employment in 2012 and 2013, the U.S. Congressional Budget Office’s September 2020 report The Effects of Pandemic-Related Legislation on Output, the Center on Budget and Policy Priorities’ October 2015 report The Financial Crisis: Lessons for the Next One, the U.S. Congressional Budget Office’s February 2023 report The Budget and Economic Outlook: 2023 to 2033, Box 2-1, Moody’s Analytics January 2021 report (archived) The Biden Fiscal Rescue Package: Light on the Horizon, NHFPI’s February 2021 issue brief Designing a State Budget to Meet New Hampshire’s Needs During and After the COVID-19 Crisis, NHFPI’s August 2023 issue brief State Business Tax Rate Reductions Led to Between $496 Million and $729 Million Less for Public Services, and NHFPI’s March 2023 blog Households with High Incomes Disproportionately Benefit from Interest and Dividends Tax Repeal.