Combined state and local taxes in New Hampshire require residents with lower incomes to pay a larger percentage of their income than those with higher incomes. Most New Hampshire individuals and families earning less than $153,900 per year pay a combined state and local tax rate that, on average, is 6 percent of their incomes or more, which is a higher average effective rate than taxpayers earning above that amount. Individuals and families in the bottom 20 percent of income earners have a combined effective state and local tax rate more than three times the rate for those at the top 1 percent of the income scale in New Hampshire.
In a new report released yesterday, the Institute on Taxation and Economic Policy (ITEP) published analyses of state and local government tax systems in each of the 50 states and modeled their impacts on residents, with a focus on family households and individuals under 65 years old and examining incomes based on individual, family, or household status as a tax unit. The report concludes that 42 states have tax systems that ask a greater percentage of the incomes from tax units (individuals or families effectively paying together) with low earnings, those in the bottom 20 percent of the income scale, than those with the highest 1 percent of incomes.
The combined state and local tax systems in these states lead to more extreme income inequality after taxes. The states of Florida, Washington, and Tennessee were identified by ITEP as having state and local tax systems that increased inequality the most; all required a percentage of income from the lowest 20 percent of earners that was more than 3.3 times the rate charged to individuals and families in the top 1 percent of the income scale, while Florida specifically required 4.9 times as high of a rate relative to income for low-income households. On the other end of the spectrum in ITEP’s analysis, the states that ask more of the top 1 percent than the bottom 20 percent of income earners include New Hampshire-neighbors Vermont, Maine, and Massachusetts, although all three states ask more of certain groups of middle-income earners, as a percentage of their incomes, than of the top 1 percent.
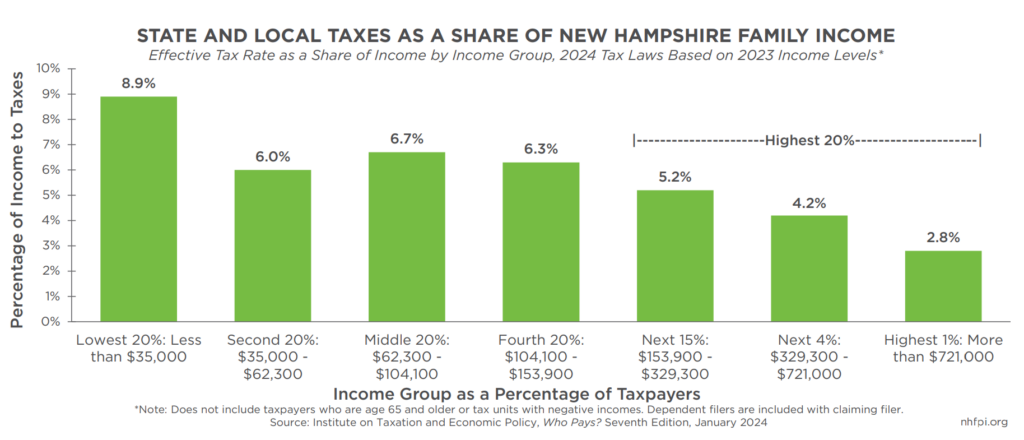
New Hampshire is one of the 42 states that requires more from the bottom 20 percent than the top 1 percent. For the 20 percent of individuals and families that include taxpayers under 65 years old with the lowest incomes in New Hampshire, which the report estimates are those making less than $35,000 per year during 2023, state and local taxes absorb about 8.9 percent of income. This represents the total effective tax rate on Granite Staters with these low incomes from state and local governments in New Hampshire, including portions of property taxes passed through rent and motor vehicle fees. Those in the middle 20 percent have a total effective tax rate of 6.7 percent from all state and local taxes. The report divides the top 20 percent into three sub-groups, and shows the top one percent of income earners, or those with more than $721,000 a year in income, paid about 2.8 percent of their incomes in state and local taxes.
ITEP’s analysis indicates that the tax rate for New Hampshire families and individuals under 65 years old with incomes in the lowest 20 percent pay a tax rate approximately 3.2 times higher than those in the top 1 percent of incomes. Individuals in the middle 20 percent of the income scale, with between $62,300 and $104,100 in income during 2023, have an effective tax rate that is 2.4 times higher than their counterparts in the top 1 percent of the income scale.
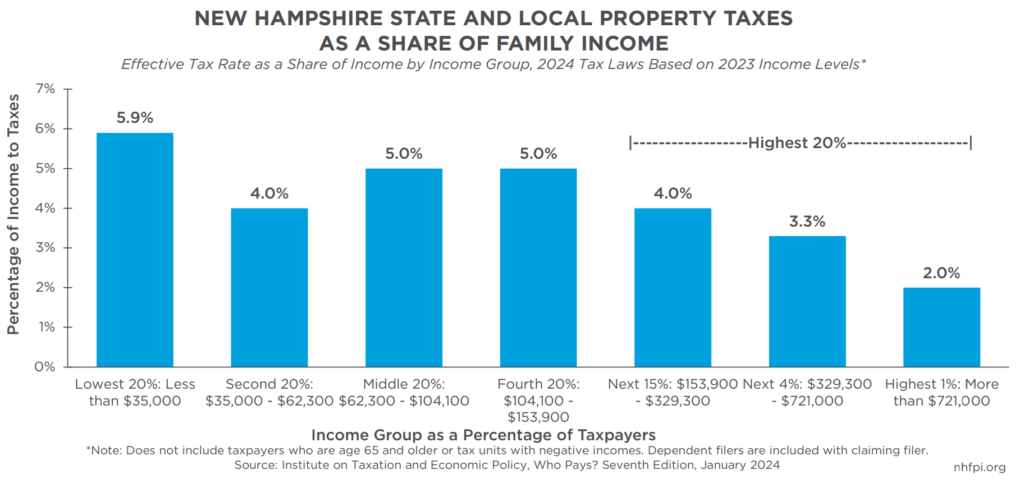
The report finds that property taxes usually fall more heavily on lower- and middle-income families in relative terms, as higher income families generally require a smaller percentage of their incomes to pay property taxes than families with lower incomes. Renters who do not pay property taxes directly see higher costs due to indirect payments of property taxes through rent paid to property owners, which is captured in ITEP’s modeling. Median renter income in the state was approximately half of median income for homeowners during 2022. New Hampshire’s property tax structure has limited opportunities for lower-income households to reduce their property tax liability, such as the small and underutilized Low and Moderate Income Homeowners Property Tax Relief program.
The analysis does not include older adults for several reasons, according to ITEP. First, interstate comparisons become more difficult with regard to older adults, and states often have different forms of preferential tax treatments for residents age 65 years or older. Second, older adults who are retired may be more likely to spend a different proportion of their income in a year relative to other households, or pay for taxes out of wealth rather than income, leading to a different economic profile than for younger adults or family and tax units without retired individuals. Blending older and younger adults might yield an analysis that is not representative of either group, although ITEP also notes that including older adults would likely make tax systems more adverse for lower-income households in many circumstances.
The report also identified that the New Hampshire Interest and Dividends Tax is due to be repealed in 2025, earlier than initially planned in 2021, due to a law change in the State Budget approved in 2023. ITEP separately modeled the impacts of this accelerated repeal, and found that only individuals and families in the top 5 percent of income earners will experience a reduction in their overall effective tax rates. This estimate matches earlier ITEP analyses that included older adults and found relatively little average tax benefit from the Interest and Dividends Tax repeal for households in the bottom 80 percent of the income scale in 2023. These modeled outcomes also reflect New Hampshire administrative data indicating half of Interest and Dividends Tax revenue came from the 2.5 percent of filers with more than $200,000 in taxable interest, dividends, and distribution income, which was likely generated from financial assets totaling several million dollars per taxpayer, in 2020.
To learn more about the ITEP analysis tax revenue collections relative to family incomes in every state, read the ITEP report titled Who Pays? A Distributional Analysis of the Tax Systems in All 50 States. To learn more about the ways in which New Hampshire raises revenue, see NHFPI’s Revenue in Review resource.
– Phil Sletten, Research Director