Food insecurity is a measure that estimates the number of households experiencing a lack of food due to insufficient money or other resources over time. This measure generally correlates with overall economic conditions, and those families and individuals who are most effected by economic declines are more likely to experience food insecurity. Food insecurity has profound negative effects on children and adults alike, and compounds hardship for individuals and families.
Following the Great Recession, which lasted from late 2007 to mid-2009, food insecurity levels increased nationwide. As the recovery from the Great Recession progressed, levels of food insecurity appeared to remain elevated in New Hampshire despite declining steadily around the nation. Limited income growth for low-wage workers, affected by both changes in employment opportunities and public policy, resulted in the economic recovery from the Great Recession taking longer to reach more vulnerable Granite Staters, and may have contributed to a delayed decline in food insecurity in New Hampshire.
In more recent years, data show that New Hampshire’s food insecurity levels began declining prior to the onset of the COVID-19 crisis, correlating with the rebound in the purchasing power for lower wages and overall improvements to economic conditions relative to before the Great Recession. However, the current COVID-19 crisis has disproportionately impacted the economic stability of more vulnerable Granite Staters, and may lead to further increases in food insecurity levels, potentially greater than those experienced during the Great Recession and recovery. Key policies and programs that provide support to individuals and families during times of economic decline will be critical to respond to increased needs during and after the current crisis.
This Issue Brief explores the trends in food insecurity levels in New Hampshire, New England, and the nation during the Great Recession and subsequent recovery, and identifies groups of people that may face higher levels of food insecurity. Analysis in this Issue Brief identifies elevated levels of food insecurity in New Hampshire during the recovery from the Great Recession, and outlines key economic trends, such as inflation-adjusted wage growth and employment opportunities, and policies in New Hampshire and other New England states that may be linked to this trend. This Issue Brief identifies several effects of the current COVID-19 crisis in New Hampshire, changes in food scarcity levels, and the additional need for economic and nutritional aid; this analysis also discusses nutritional aid and other policies that work to combat food insecurity.
Impacts of Food Insecurity
The Great Recession, which began in December 2007 and lasted through June 2009, resulted in historically high levels of unemployment, the decline of key industries, and decreases in real incomes and wages.[i] One key consequence of the Great Recession was the rise in food insecurity. Food insecurity means “households [were], at times, unable to acquire adequate food for one or more household members because they had insufficient money and other resources for food,” according to the United States Department of Agriculture (USDA).[ii] Food insecurity increased during and throughout the aftermath of the Great Recession, both nationally and in New Hampshire, as many individuals and families faced severe negative effects from the economic downturn. Food insecurity has existed continually across both rural and urban areas, and typically affects certain groups of individuals and families more than others. Food insecurity is also most likely to impact those with less economic stability and fewer resources, which may lead to increased levels due to the COVID-19 crisis.[iii]
The Negative Effects of Food Insecurity
A lack of stable access to food has negative effects on children and adults, both physiologically and psychologically. Adults who experience food insecurity are likely to have lower levels of overall health.[iv] Food insecure adults also tend to work in the low-wage labor market and face additional economic and nutritional challenges.[v] Children experiencing hunger at home are more likely to experience developmental impairments, perform poorly in school, have more behavioral and social problems than their food secure peers, and have adverse health outcomes. Research examining the long-term effect of youth food insecurity shows a greater likelihood of disadvantages these children may face later in life. Individuals who experienced food insecurity as children tend to have lower overall quality of life as adults compared to individuals who were food secure as a child.[vi], [vii], [viii]
Individuals and Families Impacted by Food Insecurity
Food insecurity most commonly results from a lack of resources to afford food. This lack of resources can come in the form of long-term poverty or limited income, or from sudden changes in financial situations brought on by economic shocks and recessions. Certain groups of individuals and families experience economic hardships, such as poverty, at higher rates, and others are at greater risk of falling into poverty or economic hardship as well due to their work situation or other strains on their finances. As food insecurity is closely tied to economic stability and well-being, individuals and families with the lowest incomes and those living in or near poverty are the most likely to be impacted.[ix]
National data representing the most recent estimates of household food insecurity in the United States show that certain groups experienced heightened levels of food insecurity. These 2019 data show that 10.5 percent of households nationally indicated experiencing food insecurity in that prior 12 months. These data also show that all households with children, regardless of other factors, faced higher levels of food insecurity than households without children, with 13.6 percent of households with children experiencing food insecurity. Households with young children under the age of six years experienced even higher levels of food insecurity, at 14.5 percent nationally. Households with children where only a single parent was present also faced higher levels of food insecurity overall, with single male-headed households with children experiencing a food insecurity rate of 15.4 percent, and single female-headed households having a rate nearly double that level, at 28.7 percent.[x]
Households headed by single individuals who lived alone faced higher levels of food insecurity, at 13 percent and 12.8 percent for women and men, respectively. Households headed by individuals identifying as Hispanic or African American also experienced higher levels of food insecurity, at 15.6 percent and 19.1 percent, respectively, while households headed by individuals identifying as white and non-Hispanic overall experienced food insecurity at much lower rates. Additionally, households experiencing poverty or living just above poverty-level incomes experience household food insecurity at the highest estimated levels. The national data show that 27.6 percent of households earning under the 2019 federal poverty thresholds, which was $20,578 for a household of three with one child, experienced food insecurity. Households with incomes just above federal poverty thresholds, up to 1.85 times the threshold levels, also experienced much higher levels of food insecurity than households with higher incomes, indicating that poverty and lower levels of income and resources are correlated with food insecurity.[xi], [xii]
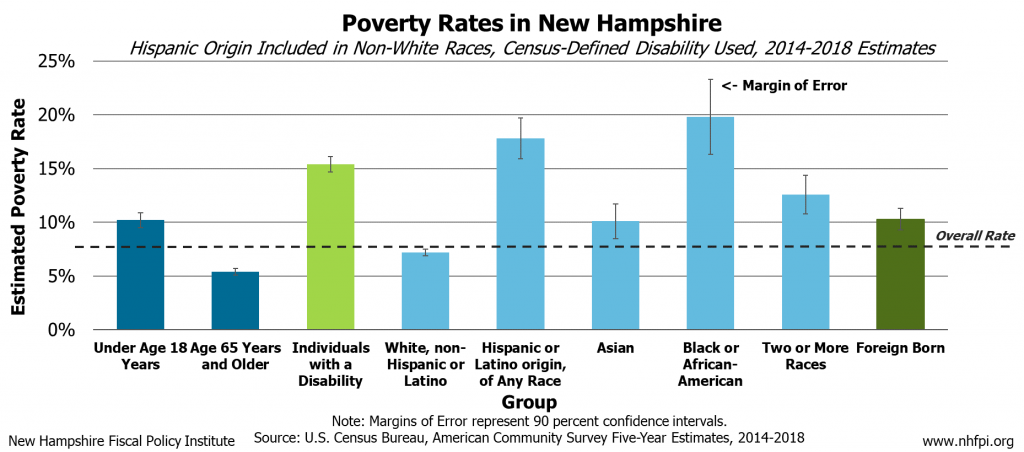
While official estimates for household food insecurity breakdowns by age, disability, origin, and racial and ethnic group are not available at the state level, analyzing the disparities between poverty among different groups in New Hampshire may provide insights into how prevalent food insecurity is within those groups. Estimated poverty rates and median household incomes over the five-year period from 2014 to 2018 provide reliable statewide estimates of the economic challenges facing certain groups of Granite Staters. Over this period in New Hampshire, children, people living with disabilities, and those identifying as a race or ethnicity other than white and non-Hispanic experienced poverty at higher rates than estimates for the state overall. Households with children and a single parent present also faced higher levels of poverty; for example, approximately one in three households headed by a single women with a child or children under five years old present were in poverty during this period.[xiii] Additionally, median household income estimates over this same period show that Hispanic- and African American-headed households, households headed by individuals identifying as two or more races, households headed by older adults, and households comprised of single parents with children all had estimated median household incomes lower than the statewide median.[xiv] These disparities in poverty and income among groups likely result in similar trends of household food insecurity by group as they do on the national level.
Food Insecurity Across Geographies
National estimates, prior to the COVID-19 crisis, showed that households in large cities and in rural areas experienced higher levels of food insecurity than the overall national average, at 12.1 percent and 12.4 percent, respectively. Households outside principal cities in metropolitan areas and in more suburban areas faced lower estimated levels, at 8.3 percent.[xv] Official estimates for household food insecurity in sub-state areas are not available, but other estimates utilizing modeling to assess food insecurity identify regions of New Hampshire that may have higher concentrations of food insecure households. Using modeling based on other existing data, northern and western counties in New Hampshire have been estimated to have higher levels of food insecurity than the state overall.[xvi]
Estimates for poverty in local areas, other proxy estimates of food insecurity, and enrollment in certain nutritional aid programs may provide insights as well. Estimates from the United States Census Bureau over the five-year period from 2014 to 2018 show that overall poverty and child poverty were elevated in both rural areas of the state and in larger, more urban, population centers like Manchester and Nashua compared to the state overall.[xvii] Enrollment in the Supplemental Nutrition Assistance Program is most prevalent in certain rural regions of the states and in large population centers.[xviii] Additionally, student enrollment in the Free and Reduced Price School Meals program, which provides nutritional aid for school children whose families may be facing food insecurity, was elevated among more rural and urban areas of the state as well, throughout the recovery from the Great Recession.[xix] These trends in New Hampshire indicate the groups experiencing food insecurity at a higher rate, whether across geographies, different racial or ethnic groups, or income and resource levels, may be quite similar to those estimates for the nation overall.
Food Insecurity Levels Throughout the Great Recession and Recovery
Official estimates of household food insecurity are calculated by the USDA through an annual survey. Households are considered food insecure if they indicated that at some point in the last year, they were unable to acquire adequate food for one or more household members because they had insufficient money and other resources for food. Data for estimates are compiled from responses collected through the annual Food Security Supplement of the Current Population Survey, which is conducted by the United States Census Bureau and the United States Bureau of Labor Statistics. When measuring food insecurity at the national level, estimates for a single year can be reliably calculated. However, when comparing state-level food insecurity estimates, the average of the last three years is used in order to improve reliability, due to smaller sample sizes at the state level than for the nation as a whole.[xx] Prior to the Great Recession, food insecurity levels hovered around 11 percent in the nation, 9 percent in the six New England states combined, and 7 percent in New Hampshire. The Great Recession resulted in large increases in food insecurity levels across the nation. Household food insecurity levels peaked nationally during the single year period of 2011, where an estimated 14.9 percent of households indicated difficultly affording and acquiring food at some point. In New England, estimated levels of food insecurity peaked during the 2010-2012 period and in New Hampshire, food insecurity peaked over the 2011-2013 period, when an estimated 10.2 percent of households in the state were food insecure.[xxi]
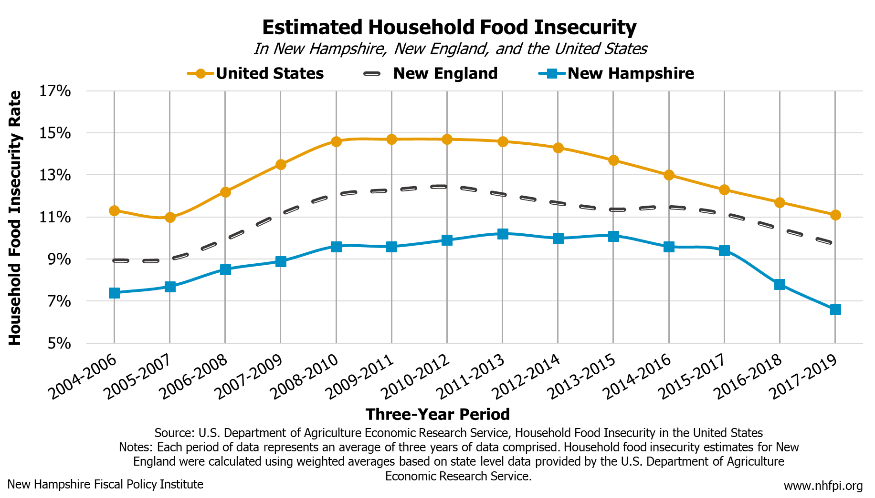
When comparing three-year periods as a rolling average across all geographies, national estimates of food insecurity peaked in the years following the end of the Recession, over the period from 2010-2012, with an estimated level of 14.7 percent. In New Hampshire, estimated household food insecurity peaked somewhat later, over the 2011-2013 period, with an estimated level of 10.2 percent. Nationally, food insecurity levels started a slow, steady, and statistically significant decline beginning in the 2011-2013 period, and continued through the 2017-2019 period. In New Hampshire, food insecurity levels remained elevated over much of this time range, and did not begin to decline significantly until the 2016-2018 period, when the state experienced a statistically significant decrease in estimated food insecurity. Only in this period did New Hampshire return to pre-Recession levels of household food insecurity. By the 2017-2019 period, estimates for New Hampshire continued to decline. Despite these more recent significant declines in household food insecurity levels experienced in New Hampshire during the 2016-2018 and 2017-2019 periods, levels remained elevated for a longer period of time than the nation as a whole. In Vermont and Connecticut, food insecurity was higher overall than New Hampshire’s rate, yet appeared to decline in a more consistent manner, similar to the nation overall. While food insecurity levels in the nation experienced steady and statistically significant declines in food insecurity since the 2011-2013 period, New Hampshire’s household food insecurity levels appear to have not declined until more recently.[xxii]
Elevated Food Insecurity Levels in New Hampshire During the Recovery
Estimated levels of food insecurity appear to have remained elevated for a longer period of time in New Hampshire than in the nation overall during the recovery from the Great Recession. When comparing the period over period changes in estimated household food insecurity, New Hampshire appears to have experienced more persistent elevated food insecurity levels than other geographies. This differentiation results from a comparison of midpoint estimates, so the potential for overlapping margin of error exists.
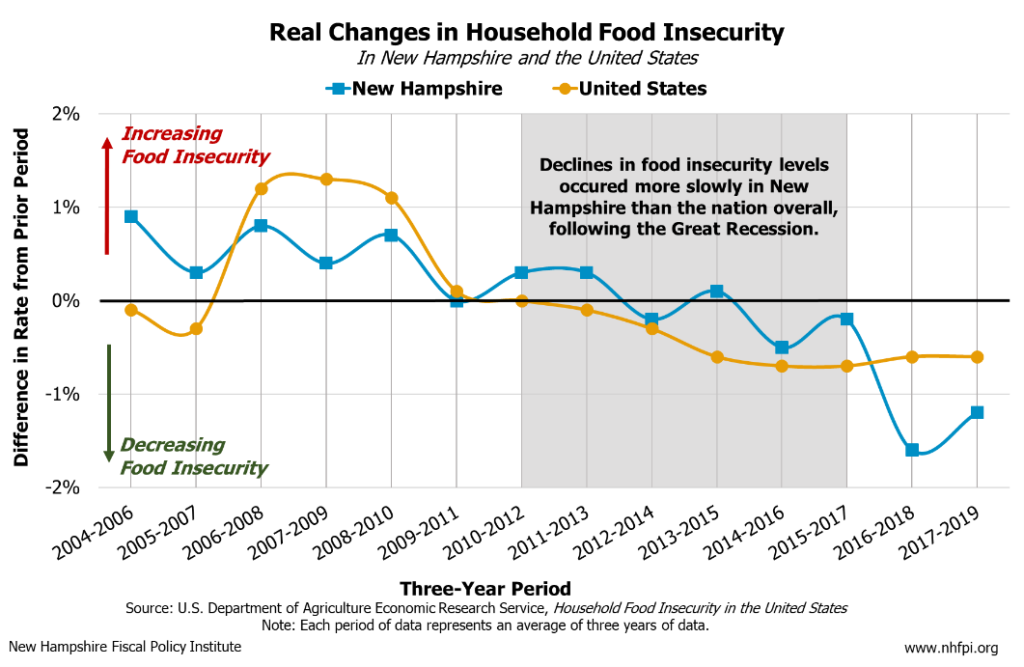
As seen in these data, household food insecurity levels increased during the Great Recession, shown as positive percentage point increases from the prior period as shown in the adjacent graph. When a line is above the horizontal axis, food insecurity increased between those two periods, and decreased when below the horizontal axis. The further away from the horizontal axis, the greater the magnitude of these changes. For example, from the 2004-2006 period to the 2005-2007 period, household food insecurity decreased by 0.3 percent, shown as a dip in the orange line representing the nation below the axis. Then from the 2005-2007 period to the 2006-2008 period, estimated household food insecurity food insecurity increased by 1.3 percentage points compared to prior period. As shown in this graph, over the periods lasting from 2010 to 2017, estimated household food insecurity levels in New Hampshire appear to have remained elevated and declined at a slower rate than the nation.
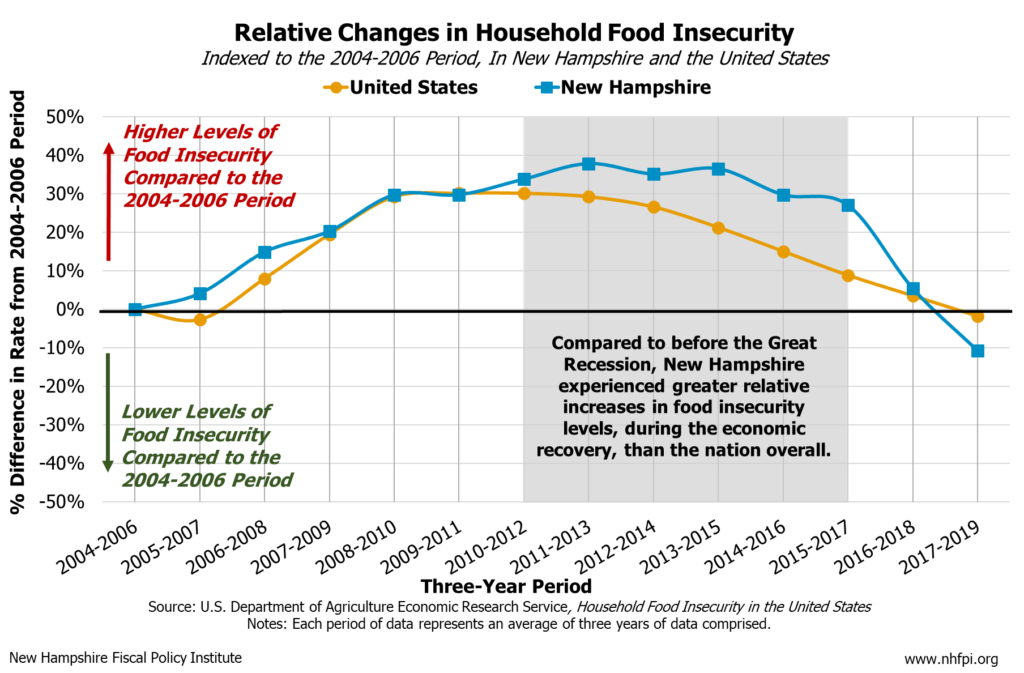
Comparing food insecurity levels for each period of data relative to a point before the Great Recession also reveals this phenomenon in the midpoint estimates. The 2004-2006 period encompasses the latest set of pre-Great Recession years, and indexing to this period permits the relative change in food insecurity compared to before the Great Recession to be calculated with a common baseline. For example, during the 2008-2010 period in the graph below, the nation’s food insecurity rate was about 29 percent higher than the rate nationally during the 2004-2006 period. Additionally, in New Hampshire, the food insecurity rate during the 2010-2012 period was about 34 percent higher than it was in the state during the 2004-2006 period. Therefore, compared to pre-Great Recession levels, New Hampshire experienced higher relative levels of food insecurity throughout most of the economic recovery compared to the nation, over the same 2010-2017 set of periods as identified in the chart and analysis above. As noted previously, this does not mean that estimated household food insecurity levels in New Hampshire were higher than the nation, but New Hampshire’s food insecurity levels experienced larger and longer relative percent increases than the nation, compared to relative pre-Great Recession
Uneven Economic Recovery from the Great Recession
Several trends in New Hampshire throughout the recovery from the Great Recession may be correlated with the food insecurity trends identified above. Despite New Hampshire’s economic recovery from the Great Recession following a positive trajectory for most economic indicators, including Gross State Product, overall employment, and decreasing unemployment levels, several key factors lead to the positive effects of the recovery being delayed in reaching those with fewer resources and lower incomes or wages.[xxiv] These factors may have contributed to estimated household food insecurity levels in New Hampshire remaining elevated for longer than in the nation as a whole.
Shifts in Job Opportunities
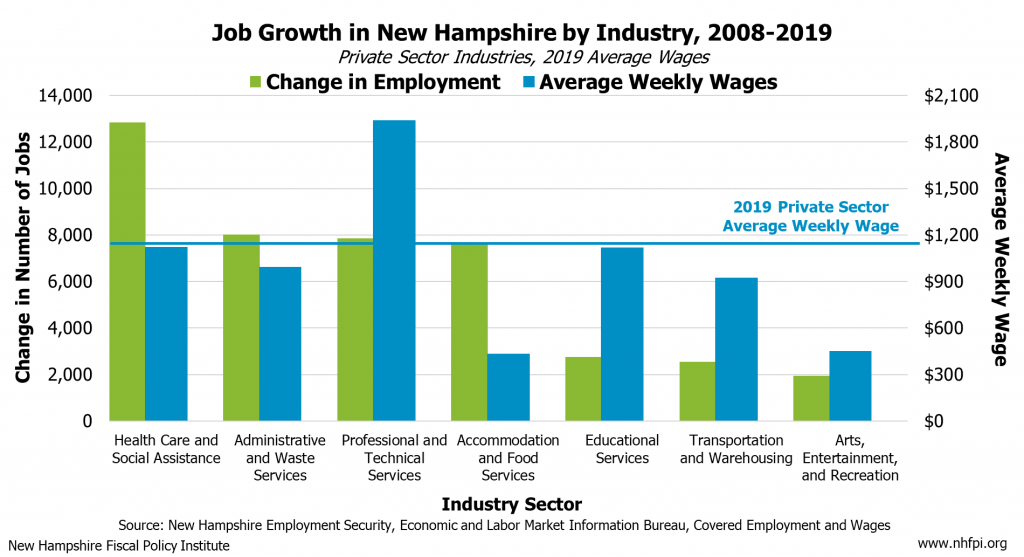
The Great Recession led to the decline of certain industries in New Hampshire and negatively impacted the wages of many workers. Significant job growth since the Great Recession through to 2019 has occurred in industries with average wages lower than the statewide average weekly wage. Between 2008, the onset of the direct industry employment impacts of the recession, and 2019, the highest levels of private sector job growth were identified in Health Care and Social Assistance, Administrative and Waste Services, Professional and Technical Services, and Accommodation and Food Services. In three of these four industries, the average weekly wages were below the statewide average in 2019. Substantial declines in employment in key industries with higher-than-average wages occurred over this same period. The industry that experienced the largest decline in employment throughout the recovery from the Great Recession was Manufacturing (not shown in the figure), which on average is an industry that pays significantly higher than the average statewide weekly wage.[xxv]
Uneven Recovery of Income and Wages
Employment changes throughout the recovery from the Great Recession are flanked by changes in wages and purchasing power, also described as inflation-adjusted or “real” wages, among different earning groups. These income categories are calculated yearly, and averaging three years of data provides more reliable insights into overall, point-to-point changes. Earning groups can be quantified through wage deciles, where the 50th percentile wage, or median wage, represents the middle wage earned among workers in New Hampshire. Deciles are used to show the changes in wages across the distribution of hourly earnings from work.
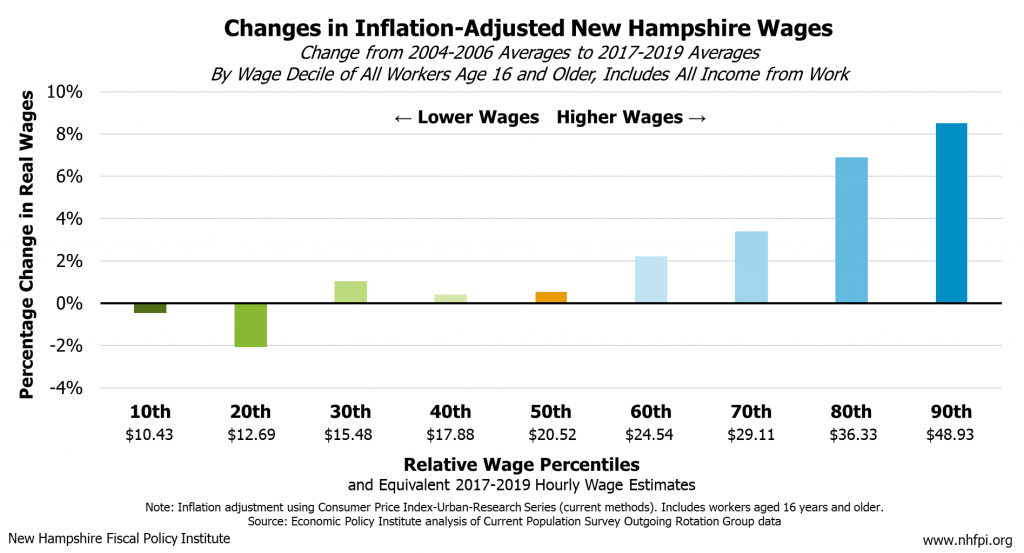
Over 2017-2019, the 50th percentile, or median, wage in the Granite State was equivalent to about $20.52 per hour, where half of the workers in the state earned more than this amount and half earned less. The 10th percentile equivalent wage over 2017-2019 in New Hampshire was $10.43 per hour, meaning that 10 percent of workers earned this wage or less and 90 percent of workers earned more than this wage. The 90th percentile equivalent wage over 2017-2019 in New Hampshire was $48.93 per hour, meaning that 10 percent of workers earned this wage or more, and 90 percent of workers earned less than this wage. Comparing the changes in real wages in New Hampshire from before the Great Recession to the end of the economic recovery in 2019, prior to the COVID-19 crisis, provides insights into the overall change in the purchasing power of wages for different earning groups. Over the period comparing 2004-2006 real wages and 2017-2019 real wages, earnings among workers in New Hampshire who were paid the median wage or less had just recovered to levels earned prior to the recession. In contrast, higher wage earners had experienced significant increases in their real wages and purchasing power compared to before the Great Recession.
Comparing pre-Great Recession real wages to the latest, pre-COVID-19 wage levels shows only the point-to-point changes, but it does not show how different earning groups fared throughout the recovery. As food insecurity impacts individuals and families with lower incomes or who are in poverty more acutely, analyzing how lower-income workers’ wages in New Hampshire changed throughout the recovery from the Great Recession may provide insights into the state’s food insecurity trends over this time. Workers earning 20th percentile wages throughout the recovery represent those who earned the 2019 equivalent of about $12.60 per hour. The 20th percentile also indicates that 20 percent of all workers in New Hampshire earned below this equivalent rate, and 80 percent earned above it. This percentile encompassed many low-income workers and many workers who may be experiencing poverty if they are the sole income earner for a household, especially for a household with children or many members.
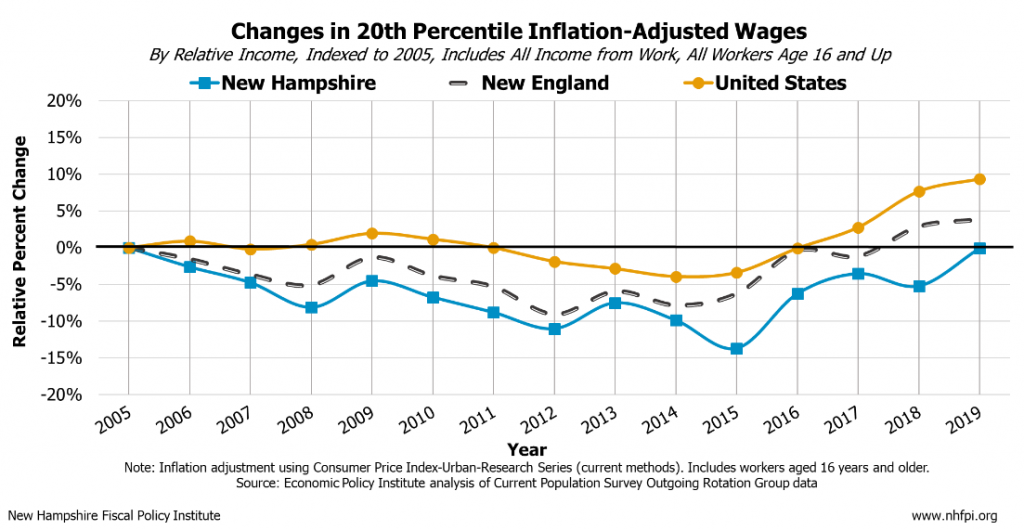
When indexed to one year before Great Recession, the relative percent changes in the purchasing power of the 20th percentile declined and stayed suppressed for much of the economic recovery, indicating that lower income earners may not have fared as well as higher wage workers during this period. The decline in the 20th percentile real wages was more severe in New Hampshire than experienced in New England as a whole and the nation. This trend indicates that, throughout the recovery, lower income workers in New Hampshire experienced relatively more severe declines in their real wages. These same lower income wages did not recover to pre-Great Recession levels until after the recovery of lower wages in New England as a whole and the nation. Wages at the 10th percentile, and up to the 50th percentile representing median wages, trended in a similar fashion to the 20th percentile for New Hampshire, New England overall, and throughout the nation.[xxvi]
Wage Decline Contributions to Food Insecurity Trends
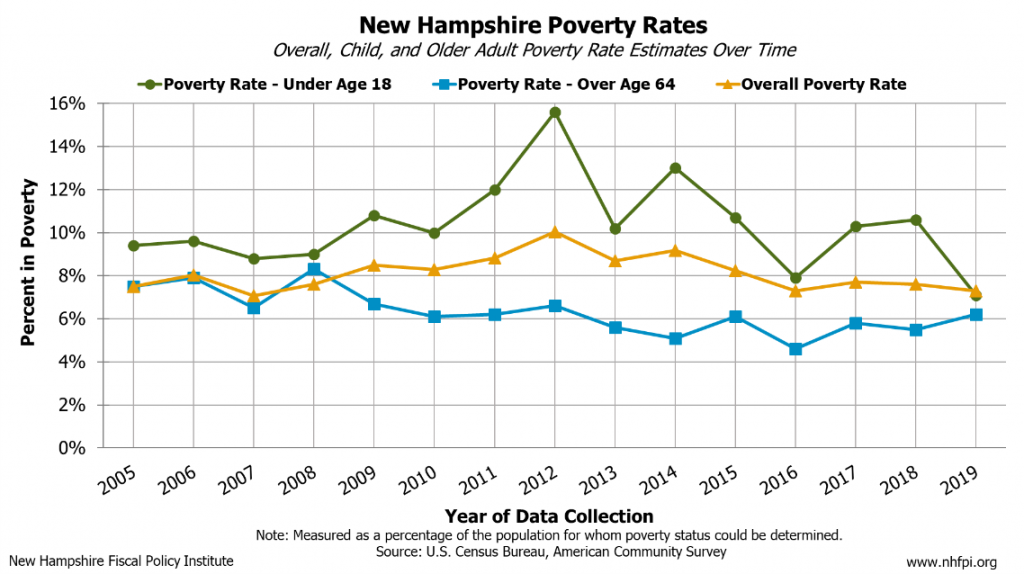
The decline in the purchasing power of wages earned by lower income individuals in New Hampshire, and across the nation, is partly due to shifting employment opportunities as a result of the Great Recession. Growth of employment in industries paying lower wages, especially in the service sector, resulted in fewer opportunities to increase earning within the shifting labor market. These shifting employment trends occurred in tandem with other negative economic trends throughout the nation, which created additional economic hardships for individuals and families with fewer resources, increasing poverty and household food insecurity levels.[xxvii] As food insecurity is closely and inversely related to economic security, these trends impacting Granite Staters with lower levels of income and fewer resources can also be visualized through analysis of poverty rates in New Hampshire. In the years following the Great Recession, the overall poverty rate and the poverty rate for children both rose and were elevated above pre-Great Recession levels, with overall poverty not reaching pre-Recession levels until the final four years of the economic recovery. These poverty rate changes seem to have occurred in tandem with the changing levels of food insecurity throughout the Great Recession and recovery, and with the economic conditions for Granite Staters with fewer resources.[xxviii] Additionally, key expenses for things such as housing have been on the rise in New Hampshire, with pressure being especially felt by renters.[xxix] As costs for critical expenses like housing increase, individuals and families prioritize resources to paying for shelter before food.[xxx] As a result, individuals and families with limited resources may face additional financial burdens, furthering the challenges in accessing food.
Many factors affected the extent to which the economic recovery reached individuals and families. However, certain policies present in other states may have contributed directly to the faster rebound and growth of low wages and provided increased support for individuals and families with fewer resources outside of New Hampshire. As a result, policies not present in New Hampshire may have resulted in food insecurity levels declining faster in other states and the nation overall relative to New Hampshire. Some of these policies in other states that may have aided in boosting the economic security of lower income individuals and families, who are most susceptible to food insecurity, include wage increases and direct aid.[xxxi]
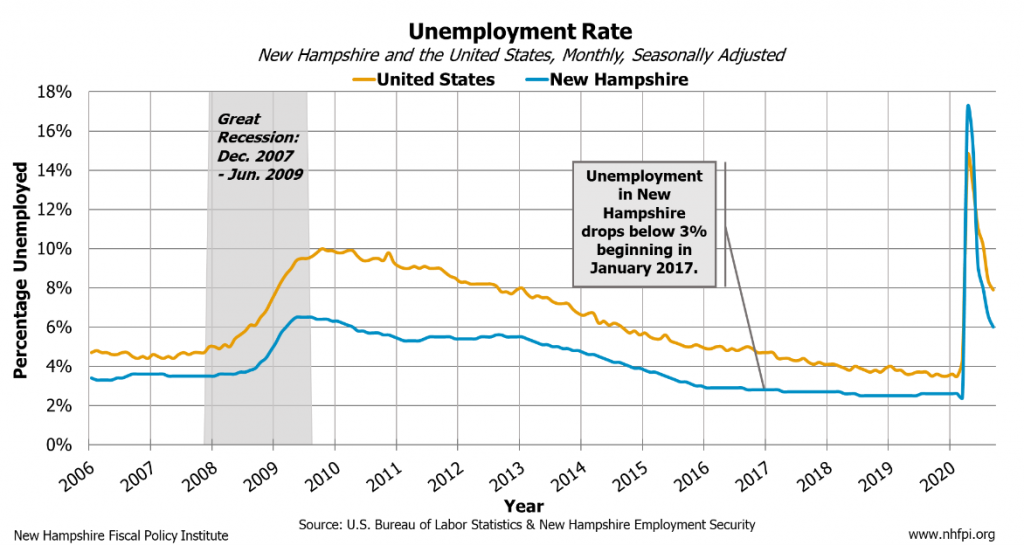
Minimum wage increases throughout the recovery at the state level among neighboring New England states and in many other states throughout the nation, aided in boosting the wages and economic well-being of lower income earners. These improvements may have contributed to the upward economic mobility of individuals and families, and limited the severity of the real wage declines some other states experienced compared to New Hampshire.[xxxii] As New Hampshire has not implemented any increases to minimum wages since 2009, the recent recovery of most lower wages in New Hampshire may be most likely attributed to increasing labor demand above the labor supply towards the latter portion of the economic recovery. By 2017, New Hampshire had one of the lowest unemployment rates in New England, and from late 2015 through the beginning of the COVID-19 crisis had an unemployment rate below 3 percent.[xxxiii] These extremely low levels of unemployment may have been the most significant force putting upward pressure on the real wages of most lower income workers to pre-Great Recession levels, albeit more slowly than the recoveries experienced regionally and nationally.[xxxiv] Additional policies in other states that may have aided in boosting the incomes and overall economic security of lower wage individuals and families include direct assistance and aid, such as state-level Earned Income Tax Credits, housing assistance, and childcare assistance. Programs like these aided lower income families and individuals directly, and some have been shown to increase levels of employment as well, potentially decreasing the likelihood of food insecurity or poverty.[xxxv]
The Role of Nutritional Aid Programs
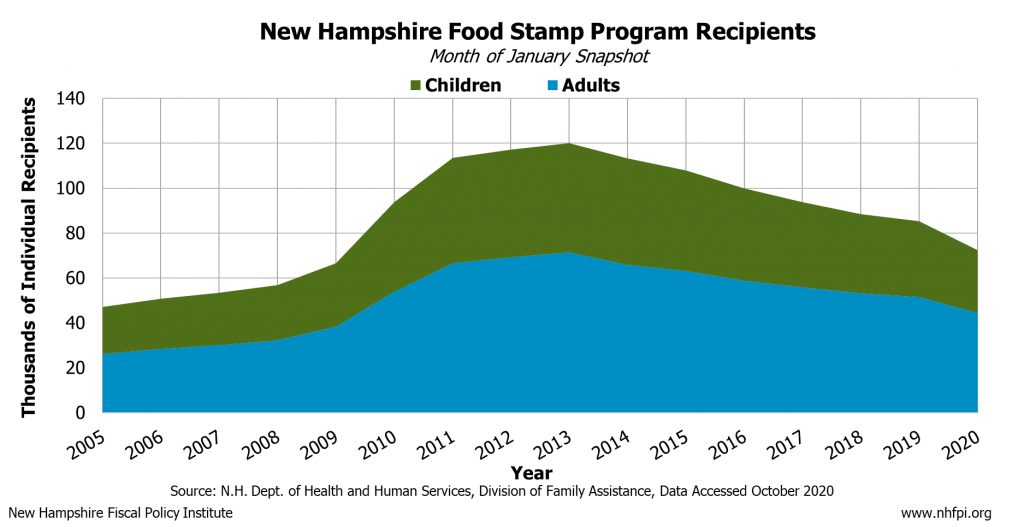
While many policies can provide aid to individuals and families with limited resources or economic stability, the largest program specifically designed to combat food insecurity nationally is the Supplemental Nutrition Assistance Program (SNAP). SNAP is a national food assistance program for households with permanent or temporary economic hardships and low incomes, and is the most effective tool currently helping to mitigate food insecurity.[xxxvi] This program was critical to providing support and direct nutritional aid throughout the economic recovery from the Great Recession. SNAP is known in New Hampshire as The Food Stamp Program and provides approximately 70,000 Granite Staters with vital nutritional aid.[xxxvii]
During the Great Recession and recovery lasting up through 2019, enrollment in SNAP rose on account of the additional economic hardships and resulting increases in food insecurity. The benefits provided through SNAP did more than directly support individuals and families requiring nutritional aid; these benefits also stimulated the weak economy and aided the economic recovery. Analysis of stimulus policies during the Great Recession showed that for every dollar invested into new SNAP benefits, individuals and families were directly supported and $1.74 of economic activity was generated.[xxxviii] Benefits provided by this key nutritional aid program supported many Granite Staters, but without additional policies as seen in other states throughout the recovery, may have responded to food insecurity less effectively. Additionally, these benefits may not be enough to cover the costs of meals for individuals and families facing food insecurity. Maximum benefits are only provided to households with the fewest resources, including those that indicate no income. Currently, a household of three people in New Hampshire with the greatest levels of need would receive a maximum benefit of $535, or $1.98 per person per meal.[xxxix]
Additional programs targeted at providing nutritional aid specifically to students from households with lower incomes are key free and reduced-price school meal programs. In New Hampshire, the percentage of students eligible for free and reduced-price lunches rose from under 20 percent just prior to the Great Recession to nearly 29 percent eligible in 2014, due in part to expanded SNAP eligibility and automatic verification with SNAP as well as changing economic conditions. During 2019, just under 25 percent of New Hampshire school children were eligible.[xl]
SNAP and free and reduced-price school meal programs were critical in helping ensure children and adults who faced food insecurity throughout the recovery from the Great Recession had greater access to food. Other key policies that boosted the wages of lower income earners and provided additional direct supports to individuals and families worked alongside SNAP to respond to the increased economic hardships caused by the Great Recession. In conjunction with improving economic factors, the food insecurity declines experienced over the periods lasting from 2015 to 2017 were significant, yet potentially may have been accelerated with additional policy actions throughout the recovery from the Great Recession.
The COVID-19 Crisis and Food Insecurity
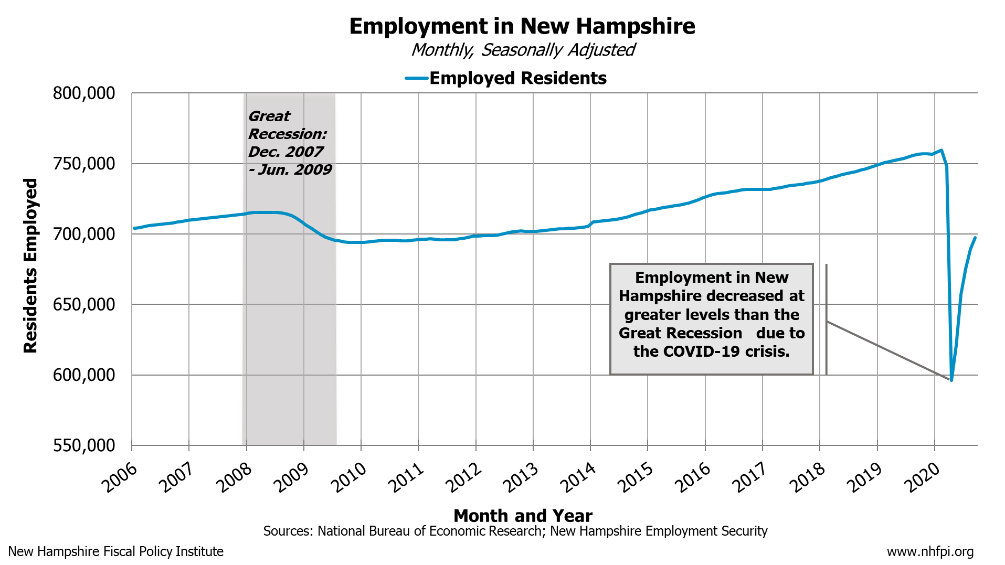
The current COVID-19 crisis has resulted in profound challenges to the health and economic well-being of many Granite Staters. The impacts of the pandemic and subsequent economic recession have been most acute on vulnerable populations throughout the state, and the impacts on food insecurity have likely been very significant. Unprecedented declines in employment and historic increases in unemployment have been the most dramatic economic impacts as businesses, schools, hospitals, and other institutions have been required to limit non-essential in-person interactions. The impacts on the incomes of individuals and families have been profound, with the most acute impacts on groups with the fewest resources. Key policies such as expanded unemployment compensation aided in supporting many impacted Granite Staters, yet many economic challenges remain. Nutritional aid programs are critical to supporting Granite Staters throughout this current crisis just as they were critical in supporting individuals, families, and the economic recovery from the Great Recession.[xli]
Impacts on Economically Vulnerable Populations
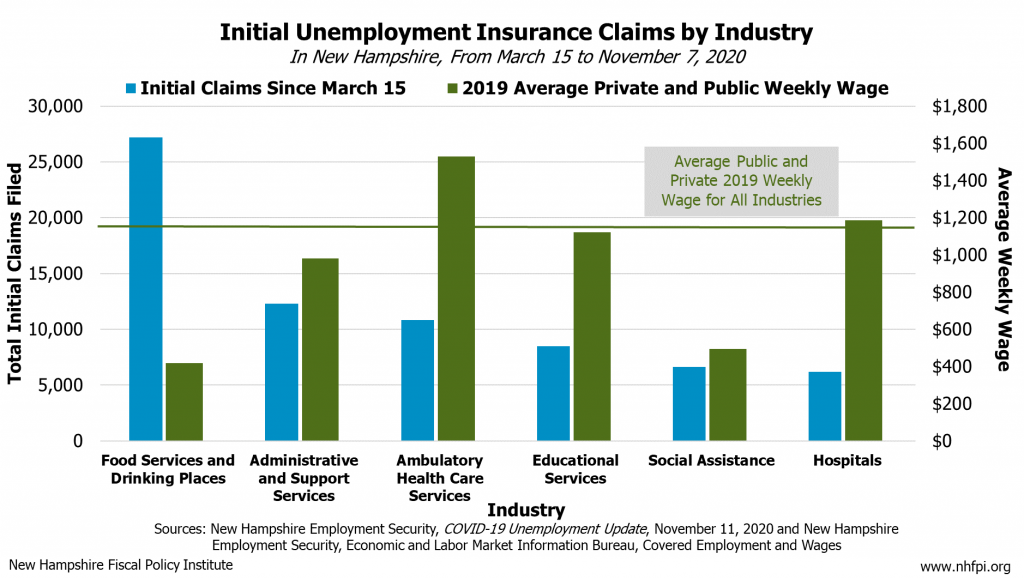
Prior to the start of the COVID-19 crisis, some of the largest industries in the state, in terms of employment, paid lower-than-average wages. Lower wages may result in individuals being less able to build savings and, subsequently, less likely to recover from reduced income or job loss.[xlii] Individuals earning lower wages may face serious financial challenges during the pandemic in addition to increased exposure risk to the virus or employment loss.[xliii] In New Hampshire, unemployment insurance claims data show that significant levels were generated by those working in industries which paid lower-than-average wages. This indicates that the negative employment and economic effects of the crisis have been most concentrated on individuals earning lower incomes in New Hampshire.[xliv] The linkage between economic stability and food insecurity provides insights into how food insecurity levels may increase as a result of the concentrated economic impacts of the COVID-19 crisis on individuals and families with lower incomes and fewer resources.[xlv]
Need for Economic Assistance and Nutritional Aid
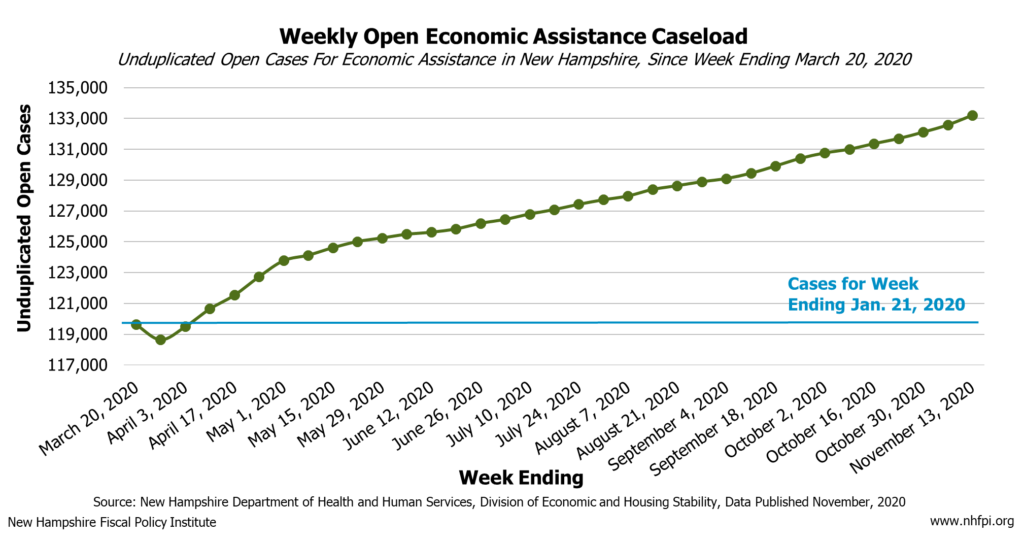
As many Granite Staters continue to face economic and financial challenges as a result of the COVID-19 crisis, the levels of need for assistance and supports have risen. According to the New Hampshire Department of Health and Human Services, which manages many of the means-tested aid programs in the state (including SNAP, Temporary Assistance for Needy Families, Medicaid, and child care assistance), the total number of unduplicated open cases for assistance has consistently risen since the COVID-19 crisis began.[xlvi]
In addition to the increased caseloads for economic assistance in New Hampshire, beginning in April, the United States Census Bureau began collecting the first phase of weekly survey data targeted at understanding the effects of the COVID-19 crisis on households. This first phase of the weekly Household Pulse Survey was conducted from April 23 to July 21, and a second phase of surveys and data collection was conducted from August 19 through October 26.[xlvii] A third phase of data collection has been approved to gather additional data.[xlviii]
Based on the responses from the first phase of the survey, the United States Census Bureau has estimated widespread income losses among Granite Staters since the pandemic began. Over these initial 12 weeks, nearly half of New Hampshire respondents reported a reduction in household income from employment since March 13, 2020.[xlix] During mid-July, about one in five households expected a decline in incomes during the next four weeks because of the pandemic. The first release of data from the second phase of the survey indicates that many of the challenges experienced by Granite Staters lingered into October. Over the period from October 14 to October 26, about one in five households expected a decline in income during the next four weeks because of the pandemic, over 30 percent of households indicated an eviction or foreclosure is at least somewhat likely in the next two months, and about a quarter of households indicated a difficulty in affording regular household expenses in the last seven days.[l]
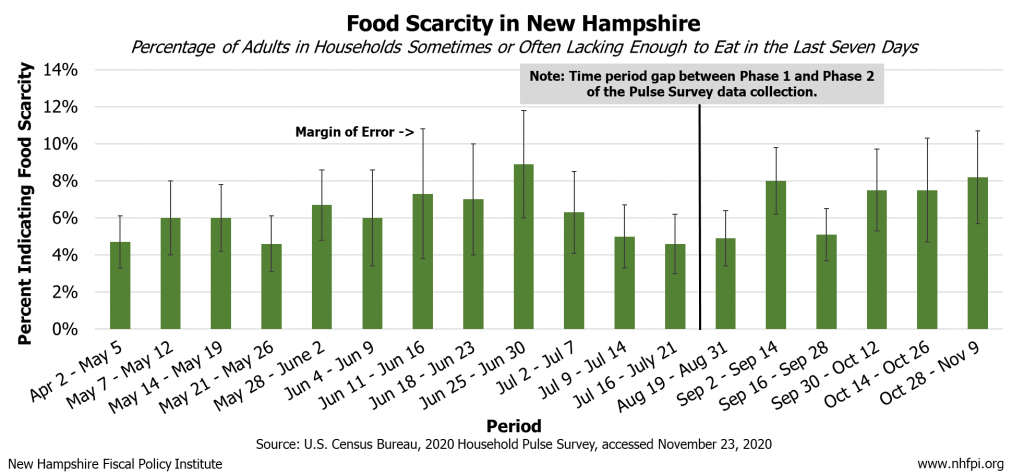
While this survey does not directly capture food insecurity, it reflects many hardships facing Granite Staters during the COVID-19 crisis. Another key indicator this survey measures is food scarcity, which is defined by the United States Census Bureau in this survey as “difficulty in affording food in the last seven days”. This condition is more severe than the traditional measure of food insecurity, which measures challenges in obtaining food at some point in the past year. Since data collection and estimates began in early April, around five percent of households in New Hampshire indicated there was either sometimes or often not enough to eat in the last seven days.[li] These consistent levels of recent difficulty in accessing food indicate that that the challenges in accessing food have been sustained since the pandemic began. Continued difficultly in accessing food in New Hampshire may indicate future increases in food insecurity and other challenges for vulnerable individuals and families in New Hampshire.
Conclusion
Food insecurity presents significant challenges to individuals and families across New Hampshire and the nation. The severe, negative physiological and psychological impacts of food insecurity affect the development of children and the health and well-being of Granite Staters of all ages. Individuals and families earning lower incomes and certain other groups are disproportionately likely to face food insecurity, which may compound existing hardships.
The negative effects of the Great Recession led to changes in employment opportunities for workers, declines in real wages, relatively high unemployment, and other challenges leading to a rise in household food insecurity. As the prevalence of food insecurity is closely and inversely related to economic well-being, those with limited economic security and resources who were most impacted by the Great Recession were the most susceptible to experiencing food insecurity. While food insecurity levels in New Hampshire were continually lower than the national estimates and estimates for New England, levels appear to have remained elevated for longer in the state than in the nation overall, indicating that the economic recovery took longer to reach vulnerable Granite Staters. In New Hampshire, the uneven economic recovery from the Great Recession is represented by the significant declines and long, slow rebound of the real wages of lower wage workers. This factor combined with fewer policies to support and boost the incomes of individuals and families with fewer resources in New Hampshire compared to other states may have resulted in New Hampshire’s food insecurity levels remaining elevated for longer than the nation.
The current COVID-19 crisis has created severe economic challenges like those of the Great Recession; declines in employment and increases in unemployment, income losses, and the potential for shifting employment opportunities, place many vulnerable Granite Staters at greater risk. Like the Great Recession, many impacts thus far have been most acutely felt by individuals and families with the fewest resources, who were only recently beginning to experience the positive effects of the last economic recovery, and food insecurity levels are likely to be significantly higher now than before the crisis began. Food insecurity trends during the recovery from the Great Recession suggest additional support for individuals and families with the fewest resources may have contributed to more consistent reductions in food insecurity in other states, and the nation overall, compared to New Hampshire. Providing aid to vulnerable populations most impacted by economic downturns is key to mitigating financial hardships and stimulating the economy. As the impacts of the COVID-19 crisis continue to effect Granite Staters, relevant policies and support programs for the people most effected, and for those with the fewest resources, will be central in helping ensure all individuals and families are able to access food and for mitigating food insecurity during and after the COVID-19 crisis.
Funding for this report was provided by:
![]()
Endnotes
[i] The National Bureau of Economic Research Business Cycle Dating Committee’s report officially recognizes the Great Recession as lasting from December 2007 through June 2009. Additionally, see NHFPI’s September 2020 Issue Brief titled Challenges Facing New Hampshire’s Workers and Economy During the COVID-19 Crisis.
[ii] The Economic Research Service of the United States Department of Agriculture defines what food insecurity is and how food insecurity is measured in their yearly data and estimate releases.
[iii] Characteristics of groups who experience food insecurity, and trends over the 2017-2019 period, were calculated and released by the Economic Research Service of the United Sates Department of Agriculture.
[iv] Health outcomes of individuals experiencing food insecurity is discussed by the Economic Research Service of the United States Department of Agriculture October 2017 publication Adults in Households With More Severe Food Insecurity Are More Likely To Have a Chronic Disease.
[v] Food insecurity and its effects on economic security and well-being are discussed by the United States Department of Health and Human Services’ Office of Disease Prevention and Health Promotion and by Feeding America in their report titled From Paycheck to Pantry.
[vi] The Negative Effects of Poverty and Food Insecurity on Child Development, authored by Mariana Chilton, Michelle Chyatte, and Jennifer Breaux and published in November 2007 in The Indian Journal of Medical Research, explains the importance of food for a child’s physical and psychological development.
[vii] Food Insecurity Affects School Children’s Academic Performance, Weight Gain, and Social Skills, authored by Diana F. Jyoti, Edward A. Frongillo, and Sonya J. Jones and published in December 2005 in The Journal of Nutrition explores the developmental consequences of food insecurity in children.
[viii] See Feeding America’s resource page on the effects of food insecurity on children and the United States Department of Health and Human Services’ topic page on the social determinants of health.
[ix] Feeding America’s resource page on health and hunger provide information on the impacts of food insecurity and the challenges faced more acutely by certain groups as does analysis conducted by the Urban Institute of United States Department of Agriculture food insecurity estimates.
[x] Levels of estimated household food insecurity by household composition over the 2017-2019 period for the United States were calculated and released by the Economic Research Service of the United Sates Department of Agriculture.
[xi] Levels of estimated household food insecurity by race or ethnicity of householder and income to poverty ratio over the 2017-2019 period for the United States were calculated and released by the Economic Research Service of the United Sates Department of Agriculture.
[xii] Information regarding poverty thresholds are published by the United States Census Bureau.
[xiii] Poverty estimates for subsets of Granite Staters are representative of the five-year span from 2014-2018 to improve data reliability beyond the level of certainty provided by single-year estimates. The 2014-2018 five-year period is the most recent available five-year data published by the United States Census Bureau; additional information is available in NHFPI’s 2020 Conference Handout.
[xiv] Median household incomes are estimates from the American Community Survey; see full estimates from the United States Census Bureau.
[xv] Levels of estimated household food insecurity by general geographic area type over the 2017-2019 period for the United States were calculated and released by the Economic Research Service of the United Sates Department of Agriculture.
[xvi] Analysis conducted by Feeding America and presented by the University of Wisconsin Public Health Institute estimated levels of food insecurity in New Hampshire by county.
[xvii] Poverty and child poverty estimates for the state and geographical subsets of Granite Staters are representative of the five-year span from 2014-2018 to improve data reliability beyond the level of certainty provided by single-year estimates. The 2014-2018 five-year period is the most recent available five-year data published and are available from the United States Census Bureau.
[xviii] Local SNAP enrollment figures provided by the New Hampshire Department of Health and Human Services, and converted to municipal-level enrollment in NHFPI analysis.
[xix] Information on Free and Reduced Price Lunch eligibility is collected and provided by the New Hampshire Department of Education.
[xx] Definitions and descriptions of food insecurity and measures are compiled by the Economic Research Service of the United States Department of Agriculture.
[xxi] Estimates of household food insecurity yearly at the national level, and over three-year periods at the national, state and substate levels, are collected, calculated, and analyzed by the Economic Research Service of the United States Department of Agriculture. Yearly releases and publications of these data and analyses are collected on this resource page.
[xxii] Estimates of household food insecurity yearly at the national level, and over three-year periods at the national, state and substate levels, are collected, calculated, and analyzed by the Economic Research Service of the United States Department of Agriculture. Yearly releases and publications of these data and analyses are collected on this resource page.
[xxiii] NHFPI analysis identifying the real and relative changes in household food insecurity estimates were conducted using the midpoint estimated released by the Economic Research Service of the United States Department of Agriculture. Yearly releases and publications of these data and analyses are collected on this resource page. Margins of error for each estimate vary by period and by state.
[xxiv] For more information on trends and analyses of the recovery period after the Great Recession, see NHFPI’s August 2019 Issue Brief titled New Hampshire’s Workforce, Wages, and Economic Opportunity.
[xxv] For more information on the composition of jobs included in these sectors, see the United States Bureau of Labor Statistics, Industries at a Glance web page. These figures, as well as other figures citing specific job numbers in this Issue Brief, are from the Quarterly Census of Employment and Wages as presented by New Hampshire Employment Security.
[xxvi] Federal Current Population Survey data analyzed by the Economic Policy Institute provided the data for tracking wages by percentile in New Hampshire.
[xxvii] For more information on trends and analyses of the recovery period after the Great Recession, see NHFPI’s August 2019 Issue Brief titled New Hampshire’s Workforce, Wages, and Economic Opportunity.
[xxviii] See NHFPI’s September 18, 2020 fact sheet titled Census Bureau 2019 Estimates for Income, Poverty, Housing Costs, and Health Coverage.
[xxix] See NHFPI’s August 9, 2020 Common Cents blog titled Continued Rise of NH’s Rental Costs Increases Financial Burdens on Residents, NHFPI’s August 2019 Issue Brief titled New Hampshire’s Workforce, Wages, and Economic Opportunity, and NHFPI’s September 2020 Issue Brief titled Challenges Facing New Hampshire’s Workers and Economy During the COVID-19 Crisis.
[xxx] Assessing the Effect of Increasing Housing Costs on Food Insecurity authored by James M. Fletcher, Tatiana Andreyeva, and Susan H. Busch, and published in the Journal of Children and Poverty in November 2009 estimates the negative effects of housing cost increases on food insecurity. Additionally, the February 2011 Journal of Urban Health analysis by Sharon I. Kirkpatrick and Valerie Tarasuk titled Housing Circumstances are Associated with Household Food Access among Low-Income Urban Families found higher likelihoods of food insecurity among households paying more than 30 percent of their income on housing.
[xxxi] The Center on Budget and Policy Priorities’ July 2013 publication titled Various Supports for Low-Income Families Reduce Poverty and Have Long-Term Positive Effects On Families and Children discusses the effectiveness of support and aid programs in reducing poverty.
[xxxii] The Wage and Hour Division of the United States Department of Labor tracks minimum wages nationally and at the state level over time.
[xxxiii] Unemployment estimates are calculated and tracked by the Bureau of Labor Statistics.
[xxxiv] For more information on trends and analyses of the recovery period after the Great Recession, see NHFPI’s August 2019 Issue Brief titled New Hampshire’s Workforce, Wages, and Economic Opportunity.
[xxxv] The effectiveness of key safety net programs on reducing poverty and hardships facing families and individuals is highlighted in the Center of Budget and Policy Priorities’ October 2015 blog titled The Safety Net’s Powerful Antipoverty Impact and October 2016 report titled It Pays to Work: Work Incentives and the Safety Net.
[xxxvi] More information on SNAP can be seen in the Center on Budget and Policy Priorities report Policy Basics: The Supplemental Nutrition Assistance Program (SNAP), updated June 2019.
[xxxvii] For an overview of SNAP and the New Hampshire Food Stamp Program, see NHFPI’s October 2019 updated Fact Sheet titled The New Hampshire Food Stamp Program. SNAP enrollment figures drawn from the October 2020 New Hampshire Department of Health and Human Services caseload report.
[xxxviii] Information on the multiplier effect of SNAP benefits during the Great Recession is available from the Moody’s Analytics July 2010 publication titled How the Great Recession Was Brought to an End.
[xxxix] New Hampshire Food Stamp Manual Table F, accessed November 2020.
[xl] Information on school nutrition programs is available on the New Hampshire Department of Education’s Office of Nutritional Services and Programs resource page. Historical data showing free and reduced-price meal eligibility is available on the New Hampshire Department of Education’s website.
[xli] Information on the initial impacts and responses of the COVID-19 crisis in New Hampshire are available in NHFPI’s April 2020 Issue Brief titled The COVID-19 Crisis in New Hampshire: Initial Economic Impacts and Policy Responses and August 2020 presentation titled State and Federal Funding in New Hampshire and the Impacts of the COVID-19 Crisis.
[xlii] The economic stability of lower-income households is discussed in the Federal Reserve’s Report on the Economic Well-Being of U.S. Households in 2019 – May 2020. Analysis from the Pew Research Center suggests families with lower incomes have had more difficulty accumulating wealth than higher income families in recent decades.
[xliii] The disproportional health and economic impacts of the COVID-19 crisis on certain workers is discussed in the April 2020 Kaiser Family Foundation report titled Double Jeopardy: Low Wage Workers at Risk for Health and Financial Implications of COVID-19.
[xliv] The industries and workers most impacted by the economic effects of the COVID-19 crisis were analyzed in NHFPI’s September 2020 Issue Brief titled Challenges Facing New Hampshire’s Workers and Economy During the COVID-19 Crisis. See also analysis from the Opportunity Insights Economic Tracker for New Hampshire, presented in NHFPI’s November 10 presentation The COVID-19 Crisis and State Budget Implications for New Hampshire.
[xlv] See the Center on Budget and Policy Priorities’ resource titled Tracking the COVID-19 Recession’s Effects on Food, Housing, and Employment Hardships, updated November 2020.
[xlvi] The New Hampshire Department of Health and Human Services’ Division of Economic and Housing Stability has released weekly updates related to the COVID-19 crisis with data available on the COVID-19 Data resource page.
[xlvii] See the United States Census Bureau’s Measuring Household Experiences during the Coronavirus Pandemic.
[xlviii] A third phase of the United States Census Bureau’s Household Pulse Survey was announced on November 9, 2020.
[xlix] See NHFPI’s June 2020 Common Cents blog titled New Data Provide Insight into Extensive Economic Impacts and Income Losses from the COVID-19 Crisis and November 2020 presentation titled The COVID-19 Crisis and State Budget Implications for New Hampshire.
[l] Data and estimates from the United States Census Bureau’s Household Pulse Survey are available on the Household Pulse Survey Data Tables resource page and interactive tool.
[li] Data and estimated from the United States Census Bureau’s Household Pulse Survey are available on the Household Pulse Survey Data Tables resource page. Definitions and estimates of food scarcity for New Hampshire are available via the Household Pulse Survey Interactive Tool.