Financial stability is crucial for the overall well-being and economic prosperity of New Hampshire residents, however, individuals and families in the state may not experience the same level of security. Although statewide poverty rates have remained relatively consistent, fluctuations across different demographic and socioeconomic groups can provide insights into Granite Staters with the lowest incomes who are more likely to live in poverty and remain in poverty for long periods of time.
Although poverty can impact anyone, individual poverty rates remain elevated in the Granite State for those facing increased socioeconomic constraints. Key research has shown that lower levels of educational attainment are associated with higher rates of poverty, particularly among people not actively engaged in the labor force or working in occupational groups with lower median wages. Location within the state and opportunities within one’s community can also impact individuals with the lowest incomes. Residents in New Hampshire’s rural communities have traditionally faced higher poverty rates due to limitations in accessing educational and employment opportunities. In addition, people experiencing a disability are more likely to face hardships, with these Granite Staters representing close to a third of the state’s total population with poverty-level incomes. Ongoing health conditions can prevent those with a disability from being in the labor force full-time, contributing to lower incomes among this group.
Among the family types recorded in U.S. Census Bureau data, households headed by a single parent, most particularly single females, traditionally face the highest poverty rates in the Granite State. Barriers to accessing child care due to rising costs and low availability can limit parents’ opportunities for engaging in the state’s labor force. Families who rent their homes also face higher poverty rates, although homeowners now make up a larger percentage of families living with poverty-level incomes.
This Report provides historical context around measures of economic stability, highlighting the strengths and shortfalls of the Official Poverty Measure (OPM) used throughout this piece. It also explores poverty rates among both individuals and families in New Hampshire, including by race, age, and family composition, among other characteristics. This Report also examines populations more likely to experience poverty, highlighting barriers in terms of socioeconomic status, disability status, and housing tenure. Finally, this Report provides context around changes in poverty rates over the previous decade.
Poverty Thresholds and Varying Rates for Granite Staters
Economic hardship among individuals and families with the lowest incomes has been historically measured primarily using the federal government’s OPM. Using this measure, the U.S. Census Bureau defines poverty thresholds as the annual income levels for households of different sizes, with those with incomes lower than the threshold classified as living in poverty. The poverty threshold across the 48 contiguous states in 2023 was $15,852 for an individual under 65 years old, $24,526 for a family of three with one child, and $30,900 for a family of four with two children.[1]
The OPM is the longest-standing poverty measure and has undergone few structural changes and adjustments since its inception in the 1960s.[2] In addition, this measure only considers an individual’s income, and does not account for assets, debt, and other critical factors affecting economic hardship. Unlike the OPM, the federal government’s Supplemental Poverty Measure (SPM) is a newer measure that takes into account certain expenses, such as out-of-pocket medical costs, regional variations in housing and child care costs, taxes and tax credits, and benefits and assistance, among other factors. While New Hampshire maintained the lowest OPM rate in the nation in 2023, the SPM provided different insights into the number of people experiencing poverty. According to 2021-2023 data, which are the most recent available, the state’s SPM rate was statistically indistinguishable from 19 other states, and higher than that of neighboring Maine.[3] When only considering the OPM, the 2023 poverty rate in New Hampshire was statistically lower than all other New England States, including the rates among its neighbors of Maine (10.4 percent), Massachusetts (10.4 percent), and Vermont (9.7 percent).[4]
Cost of living estimates produced separately by the Massachusetts Institute of Technology and the Economic Policy Institute also provide insights into costs facing families across the Granite State and challenges meeting those costs. According to these two independent estimates, a family of three with two working adults and one child needed a household income close to $100,000 to afford to live comfortably in New Hampshire in 2024, with some regional variation in those costs between counties in the state.[5] These estimates are well above both the OPM and SPM income thresholds, as well as above the actual incomes of many Granite Staters. According to U.S. Census Bureau data for New Hampshire, approximately one in four households had incomes below $50,000 in 2023.[6]
Despite its shortfalls, the OPM is the most widely used poverty measure across the country, and can provide granular data surrounding the demographics, attributes, and other socioeconomic conditions of specific populations living with the lowest incomes in the Granite State.
Individual Poverty by Age, Gender, and Race
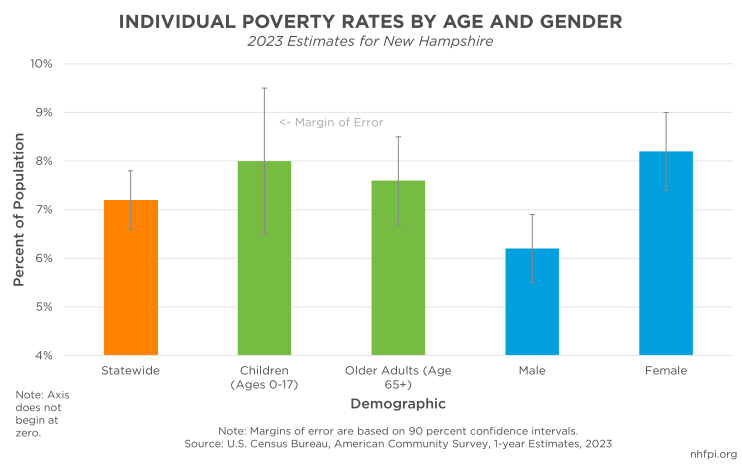
Using the OPM, around 7.2 percent of the state’s population lived with incomes below the federal poverty threshold in 2023, a rate that has remained statistically unchanged since 2016.[7] This percentage represented close to 98,000 Granite Staters, which was slightly larger than the 2023 populations of Claremont, Concord, Laconia, and Portsmouth combined.[8] Approximately 19,570 children lived in poverty in 2023, representing a poverty rate of about 8.0 percent. The poverty rate among older adults was around 7.6 percent, with an estimated 19,440 adults age 65 and older living below the federal poverty threshold. In addition, women experienced higher poverty rates than men, at 8.2 and 6.2 percent, respectively.[9]
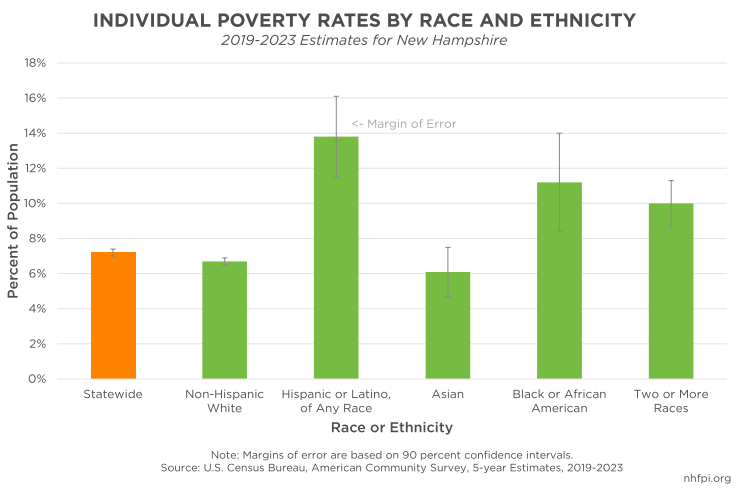
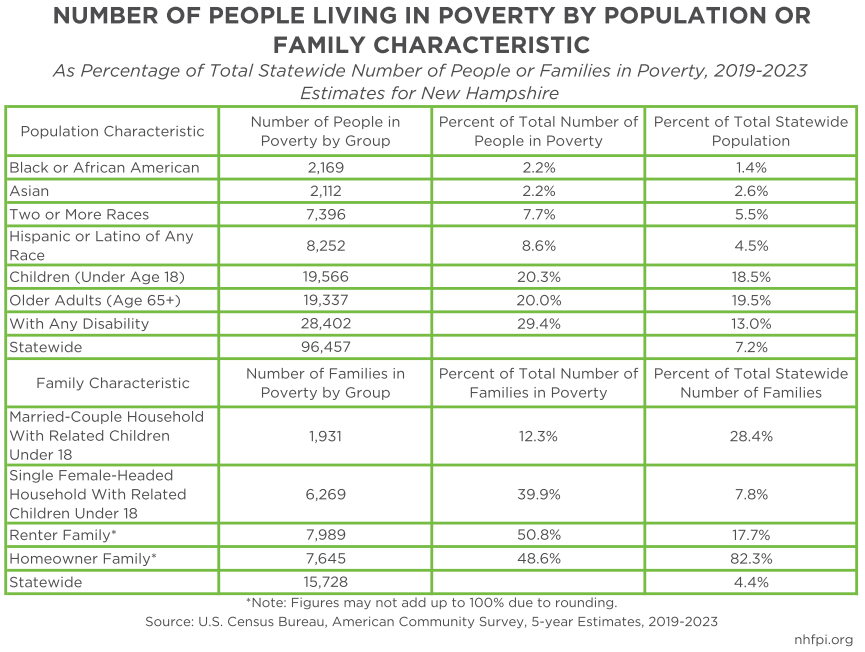
Data averaged over a five-year period can provide more reliable and granular estimates about the demographics of the almost 98,000 New Hampshire residents living in poverty. According to statewide data spanning 2019-2023, those identifying as Hispanic or Latino of any race experienced a poverty rate almost double that of the statewide rate, at an estimated 13.8 percent, with approximately 8,250 people living in poverty. Residents identifying as Black or African American also experienced an elevated rate, with around 11.2 percent of the population living in poverty, representing nearly 2,170 people. Granite Staters identifying with two or more races also had a poverty rate higher than the overall rate, at about 10.0 percent, with around 7,400 people living in poverty. While around 6.1 percent of those identifying as Asian (about 2,110 people) lived with incomes below the federal poverty threshold, this rate was statistically indistinguishable from the statewide number. Granite Staters identifying as white and non-Hispanic were the only group to experience a poverty rate (6.7 percent) lower than the statewide rate; however, this group represented about 82.7 percent (79,780 people) of the total number of residents living in poverty.[10]
Poverty among the state’s U.S.-born population remained close to New Hampshire’s overall poverty rate, at about 7.1 percent. Although foreign-born Granite Staters experienced a poverty rate of 8.2 percent, this number was statistically indistinguishable from both the statewide and U.S.-born rates. However, around 6.0 percent of foreign-born naturalized citizens in New Hampshire lived in poverty, a rate lower than that of both the state’s U.S. and foreign-born populations.[11]
Poverty Among Families
According to 2019-2023 data, families with more children face a greater likelihood of having household incomes below the federal poverty level. Across all Granite State families, those with no related children in the household experienced a poverty rate of about 2.6 percent. Among families with one or two children, the poverty rate more than doubled to 6.5 percent. During the same time period, families with three or four related children in the household experienced a poverty rate of 9.7 percent, close to four times higher than families with no related children.
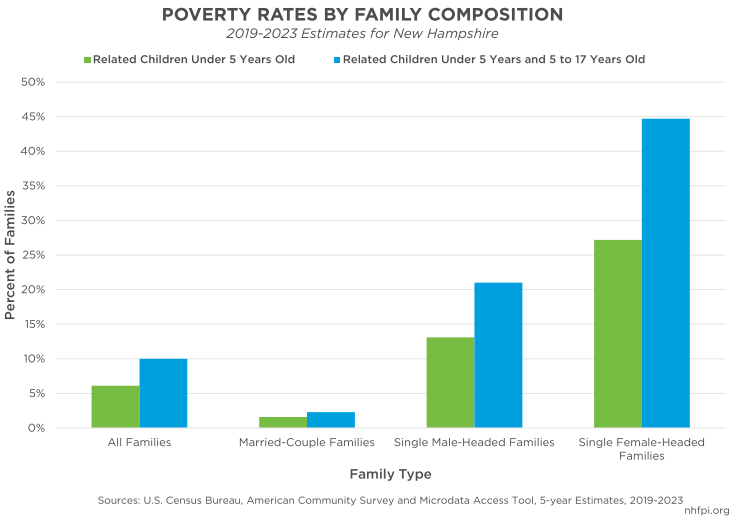
Certain family structures may limit opportunities for workforce participation and thus create additional financial challenges. Due to the scarcity and high price of child care in New Hampshire, single parents may be unable to work full-time.[12] According to 2019-2023 data for New Hampshire, around 1.6 percent of married-couple families with at least one related child under five years old lived in poverty. In contrast, single female-headed families with the same family composition were close to eighteen times more likely to live in poverty, with more than one in four (27.2 percent) having household incomes below the federal poverty threshold. Single male-headed families with at least one child under age five experienced a poverty rate of about 13.1 percent.[13] Based on 2019-2023 data, these percentages represented approximately 1,090 families headed by a single female, and an estimated 940 families headed by a single male.
According to the same five-year data, having at least two related children, one under age five and one between the ages of five and 17 years, increased a family’s likelihood of living in poverty. Around 44.7 percent of single female-headed households (1,580 households) and about 21.0 percent of single male-headed households (1,200 households) with this family composition were in poverty, compared to only about 2.3 percent of married-couple families.[14]
Although single female-headed households face the highest poverty rates among the U.S. Census Bureau’s reported family types, families headed by people of color in New Hampshire may face disproportionately high poverty rates. Based on 2019-2023 data, 16.2 percent of all single female-headed families across the state lived with incomes below the federal poverty threshold. While families headed by a single white female householder faced similar rates of poverty (16.9 percent) compared to the total rate, households headed by a single Hispanic or Latina female faced rates almost twice as high. During the indicated five-year period, nearly 30 percent of families headed by a single Hispanic or Latina female lived in poverty.[15]
Socioeconomic Characteristics of those Living in Poverty
Research has shown that access to affordable higher education can increase wages, lower unemployment rates, and decrease one’s likelihood of having poverty-level incomes.[16] Across 2019-2023, approximately 20.4 percent of Granite Staters age 25 and older without a high school degree or equivalent lived in poverty, compared to about 9.5 percent with a high school degree and no further education. Those with higher educational attainment experienced even lower rates, with around 6.4 percent of adults with an Associate’s degree or some college experience living with poverty-level incomes. Among New Hampshire adults with a Bachelor’s degree or higher, about 2.9 percent were in poverty, a rate about one-seventh of the estimated rate for Granite State adults 25 and over without a high school diploma.[17]
While higher educational attainment may decrease the likelihood of living in poverty, particular groups may experience greater economic hardship regardless of education. According to 2019-2023 data, close to one in three (32.7 percent) foreign-born Granite State adults ages 25 and older with poverty-level incomes had at least a Bachelor’s degree. However, higher levels of educational attainment still may have helped reduce poverty rates. Relative to the entire foreign-born population age 25 and older, those without a high school diploma experienced a poverty rate of approximately 15.0 percent, while those with a high school diploma or higher experienced a poverty rate less than half that, at 6.5 percent.[18]
In addition to higher educational attainment, participating in the workforce full-time and year-round also decreased a Granite Stater’s likelihood of living in poverty, with less than one percent of this population having incomes lower than the federal poverty threshold. Among those engaged in New Hampshire’s workforce part-time or for part of a year, such as seasonal workers, the poverty rate rose to around 8.8 percent. For the state’s residents over the age of 16 who did not participate in the labor force, the poverty rate was around 15.7 percent.[19]
While participation in the workforce can increase economic stability among Granite State families, some workers may still struggle to afford expenses in the Granite State. According to data from 2019-2023, four occupational groups had poverty rates at or above ten percent: health care support workers (10.0 percent), personal care and service workers (10.1 percent), housekeeping and groundskeeping workers (10.2 percent), and food preparation and serving-related workers (10.8 percent). In comparison, the poverty rate across all occupational groups during the same five-year period was 4.8 percent, with most groups experiencing rates at or below this number.[20]
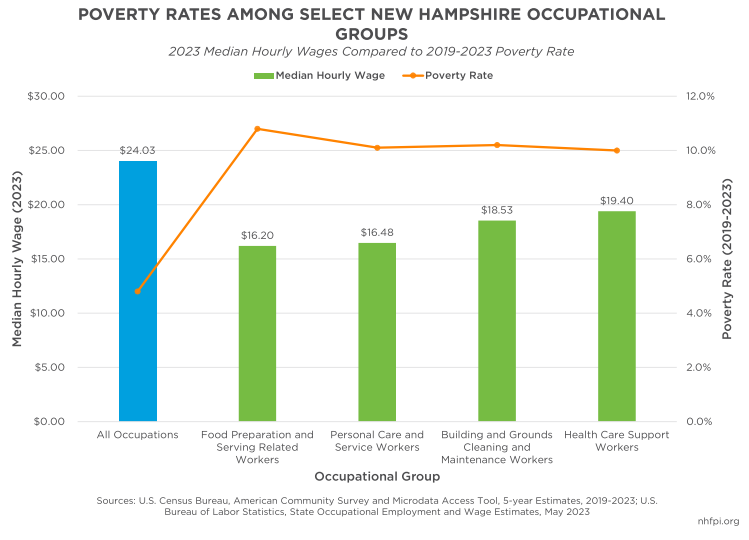
Higher rates of poverty among certain occupational groups are largely due to lower wages. According to 2023 median hourly wage data, all four listed occupational groups with elevated poverty rates had median wages far below the median wage across all occupations ($24.03).[21] In addition, workers in these groups may be more likely to work inconsistent hours depending on workload demands, including changing schedules and varying shift lengths, impacting the number of hours worked and, as a result, total wages earned.
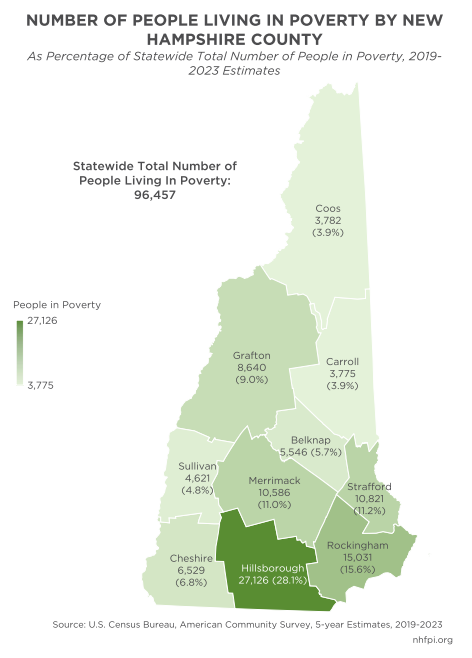
Location within the state can have an impact on employment and educational opportunities, particularly among families with low incomes who may not have the resources or time flexibility to commute long distances to work or school. During the 2019-2023 period, New Hampshire’s rural counties generally experienced higher poverty rates compared to more suburban areas, with Coos and Sullivan Counties experiencing the highest rates across the state, at 12.9 percent and 10.8 percent, respectively. While more people lived in poverty in Hillsborough and Rockingham Counties due to their larger population sizes, both experienced the state’s lowest poverty rates during the five-year period, at 6.9 percent and 4.8 percent, respectively.[22]
In addition to differing rates between counties, instances of poverty also differed in New Hampshire’s largest cities. According to 2019-2023 Manchester-level data, approximately 12,070 individuals resided in poverty, with an overall poverty rate of 10.7 percent across the city’s residents. Concord and Nashua had lower poverty rates, at 8.7 percent (about 3,660 people) and 7.1 percent (about 6,360 people), respectively; however, only Manchester’s poverty rate differed substantially from the overall statewide rate during this period. About 77.1 percent of the state’s population in poverty lived outside of these cities, which are the three most populous in the state.
Disability Status and its Association with Poverty
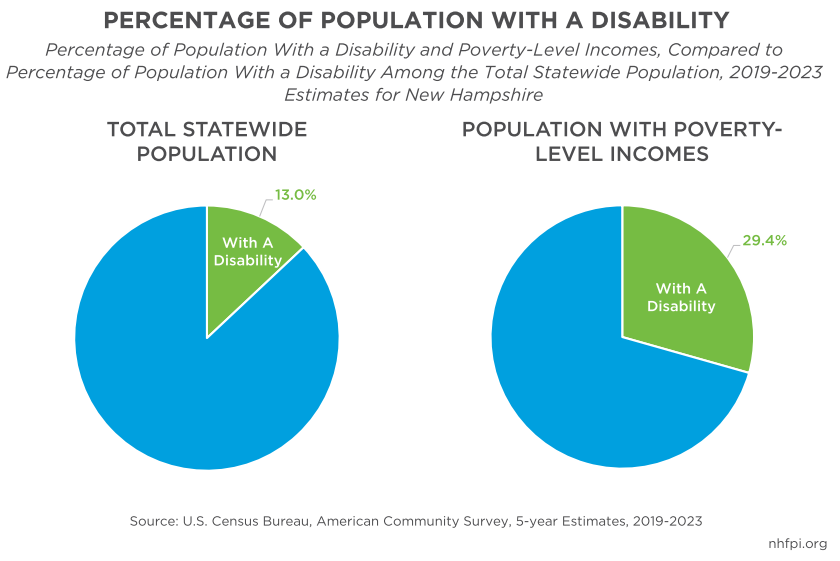
Individuals with disabilities have traditionally experienced some of the highest poverty rates among the population, both in New Hampshire and across the county.[23] According to 2019-2023 data, about 16.1 percent, or one in six, New Hampshire residents experiencing a disability lived with incomes below the federal poverty threshold. Based on data from the same five-year period, this percentage represented approximately 28,400 people who had a disability and were also living in poverty, or about 29.4 percent of the total population with incomes below the federal poverty threshold.[24] Conditions classified as disabilities by the U.S. Census Bureau include difficulties with hearing, vision, cognition, ambulation, self-care, and independent living.[25] Older adults are more likely to experience a disability, with those over the age of 65 representing about 42.9 percent of Granite Staters with a disability in 2023, regardless of poverty status.[26]
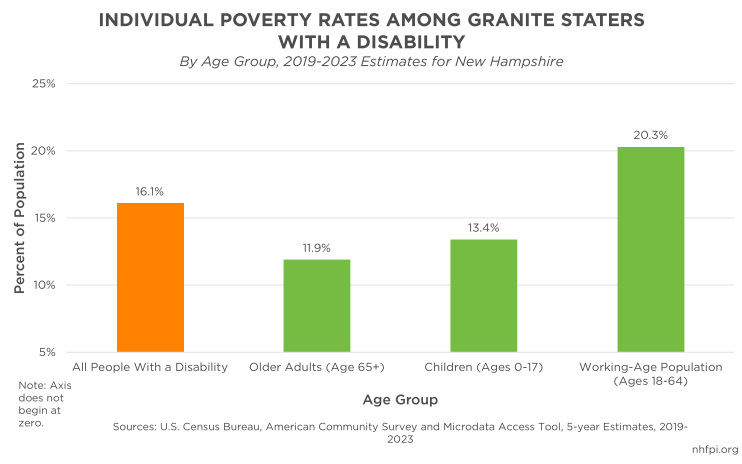
While adults age 65 and older face a greater likelihood of having a disability, other age groups experiencing disabilities may face greater likelihoods of living in poverty due to their health conditions. According to estimates from 2019-2023, about 11.9 percent of older adults with a disability had incomes below the federal poverty threshold. Children under the age of 18 experienced a similar poverty rate of approximately 13.4 percent. However, traditional working-age adults ages 18 to 64 with a disability faced an estimated poverty rate of 20.3 percent. Increased poverty rates among this age group are largely due to more limited participation in the labor force, likely associated with the disabilities they experience.[27]
Although approximately 27.5 percent of residents living in poverty with a disability were participating in the state’s workforce, based on 2019-2023 data, around 65.9 percent were unemployed or out of the labor force entirely. According to U.S. Census Bureau data collected during the same five-year period, approximately 55,300 Granite Staters living with incomes below the federal poverty threshold were out of the state’s labor force; among this total number, about 22,500 residents (40.8 percent) were experiencing a disability.[28]
For Granite Staters with a disability, maintaining health coverage is crucial for receiving needed health care. Approximately 60.3 percent of New Hampshire residents living in poverty with a disability were enrolled in Medicaid or another medical assistance program, according to 2019-2023 data.[29] Medicaid is a federal-state fiscal partnership that provides public health coverage for those with low incomes and people experiencing a disability, among other eligible populations. According to the most recent caseload report from the New Hampshire Department of Health and Human Services, 14,652 adults ages 19-64 with disabilities, 9,520 older adults regardless of disability status, and 1,099 children with severe disabilities were enrolled in Medicaid as of January 31, 2025. When combined, Granite Staters with disabilities comprised over 8.4 percent of the population enrolled in New Hampshire’s Medicaid program.[30] While those with a disability may be insured under other plans, such as private health insurance, Medicaid is vital for Granite Staters with disabilities who are out of the labor force and thus do not receive coverage from an employer.
Poverty's Disproportionate Impact on Renters
In addition to higher rates of poverty among individuals with disabilities, families renting their homes typically experience poverty rates higher than other groups. During the 2019-2023 period, approximately 12.6 percent, or one in eight, Granite State families who rented their homes lived with incomes below the federal poverty threshold; in comparison, only around 2.6 percent of families who owned their homes lived in poverty. Single female-headed families renting their home experienced the highest poverty rate among recorded family-types, at 24.1 percent, while married-couple renter families had a poverty rate of about 5.7 percent. According to 2019-2023 data, these percentages of families living in poverty represented nearly 7,990 families who rented their homes, with around 4,910 families headed by a single female.[31]
According to 2019-2023 data, close to half (48.6 percent) of New Hampshire residents living in poverty rented their homes and around 23.1 percent were paying a mortgage on a purchased home, with the remainder owning their home outright or in a situation in which they were not paying rent. Among those with incomes higher than the federal poverty threshold, the rate of renting was more than cut in half, with only about 20.2 percent paying rent and 55.0 percent paying a mortgage.[32]
For renters with the lowest incomes, housing assistance is critical for obtaining affordable housing. The Housing Choice Voucher (HCV) Program, the largest rental assistance program in the country, provides subsidies to families to help them pay for housing costs in the private rental market. According to New Hampshire Housing, the state’s housing finance authority and the largest HCV administrator in the Granite State, 4,338 vouchers were distributed to families in 2024; this number does not include the around 19 municipal-level Public Housing Authorities who also administer HCVs across the state.[33] While the program can serve households with incomes higher than the federal poverty threshold, assistance is typically prioritized among those with the highest financial need; in 2024, the average household income of an HCV recipient served through New Hampshire Housing was $19,260.[34]
Rising housing costs may be keeping more Granite State families in the rental market, as those earning close to the state’s median income may be no longer able to afford to purchase a home. Based on data collected during 2019-2023, around 42.4 percent of renters in poverty lived in their homes for two years or less, 22.9 percent for two to four years, 19.7 percent for five to nine years, and only an estimated 15.0 percent for ten years or more. Similar numbers were recorded among renters who were not living in poverty; about 38.1 percent lived in their units for less than two years, 28.4 percent for two to four years, 20.0 percent for five to nine years, and 13.5 percent for ten years or more.[35] This suggests that New Hampshire’s limited housing inventory and fewer opportunities for homeownership are impacting all renters across the state, regardless of income or economic hardship. According to New Hampshire Housing, a vacancy rate of 5.0 percent is considered a balanced rental market; however, the state’s vacancy rate has fallen below this balanced rate since at least 2014, reaching a record low of 0.5 percent in 2022 following the initial impacts of the COVID-19 pandemic on the housing market.[36]

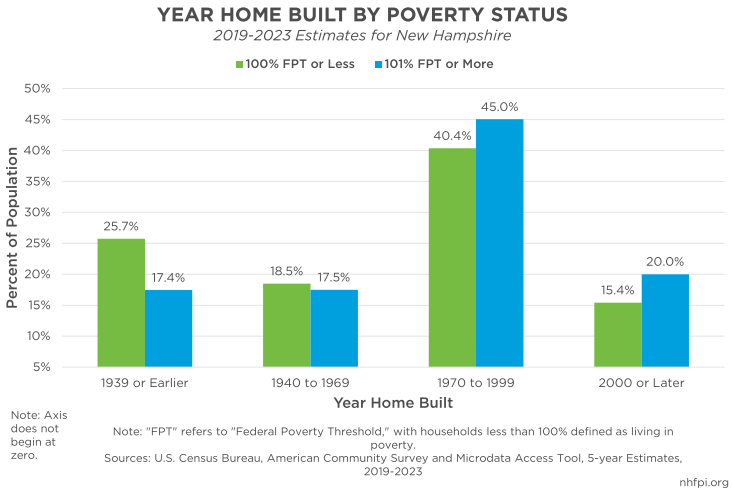
Regardless of the type of housing cost, individuals and families with poverty-level incomes were more likely to be living in older houses or rental units. Based on data from 2019-2023, about one in four (25.7 percent) Granite Staters in poverty lived in homes constructed before 1940, with only around 15.4 percent living in the newest housing structures built in 2000 or later. Among people with incomes higher than the poverty thresholds, about 17.5 percent lived in older homes built before 1940, while around 20.0 percent lived in newer homes constructed during the 21st century.[37] Families with limited financial resources tend to face increased difficulties securing safe housing. Those living in older homes are more likely to be exposed to environmental pollution and hazards, such as lead paint and water pipes. Continuous exposure to such environments has been linked to worsened or new health conditions, particularly among children, which can hinder development and academic success.[38]
Changes in Poverty Over the Prior Decade
Fewer people experienced poverty in the years surrounding the COVID-19 pandemic compared to the years following the Great Recession; however, poverty rates did not decline among all groups. Averaged data from the five-year periods of 2009-2013 and 2019-2023 reveal that the state’s overall poverty rate declined by approximately 1.5 percentage points. Poverty rates also declined among most racial and ethnic groups in the state, including Granite Staters identifying as Hispanic or Latino of any race (6.2 percentage points), Asian (6.4 points), Black or African American (11.8 points), biracial or multiracial (4.9 points), and white and non-Hispanic (1.3 points). The state’s U.S.-born and foreign-born populations both experienced declines in poverty, at 1.4 and 4.2 percentage points, respectively; poverty among foreign born naturalized residents remained statistically similar between these two periods. Those identifying as Black or African American experienced one of the largest declines in poverty across this ten-year period, with declines displayed in more recent data as well. Between 2014-2018 and 2019-2023, the poverty rate among this group declined by 8.6 percentage points.
Although poverty among children declined by about 3.3 percentage points, poverty among older adults increased slightly by around 1.1 percentage points. Additionally, older adults now represent a larger percentage of the population living in poverty compared to ten years prior. During the 2019-2023 period, older adults made up around 20.0 percent of the total population living with poverty-level incomes; from 2009-2013, older adults made up half that number, at 10.1 percent. Simply put, while the poverty rate among older adults has remained similar, more older adults are living in poverty now compared to previous years. This is likely due to a greater number of Granite Staters reaching ages at which they decide to retire, reducing their incomes relative to when they had employment.
While the poverty rate for those with a disability remained statistically unchanged between the two five-year periods, the poverty rate among Granite Staters without a disability declined by 1.8 percentage points. Similar to older adults, people with a disability now represent a larger portion of those with poverty-level incomes. Granite Staters with a disability made up about 29.4 percent of the population living in poverty during 2019-2023, an increase from 22.4 percent in 2009-2013.
Granite Staters ages 25 and older without a high school degree or equivalent experienced a poverty rate increase of about 3.4 percentage points, while those with an Associate’s degree or some college education experienced a slight decline of around 0.7 percentage points. Poverty rates remained statistically the same among residents with a high school diploma or equivalent and no further education, as well as among those with a Bachelor’s degree or higher. While poverty rates remained the same, those with a Bachelor’s degree or higher represent higher percentages of the population living in poverty, according to newer data. In 2019-2023, those with this level of educational attainment represented around 17.7 percent of those with poverty level incomes, an increase from 13.7 percent in 2009-2013.
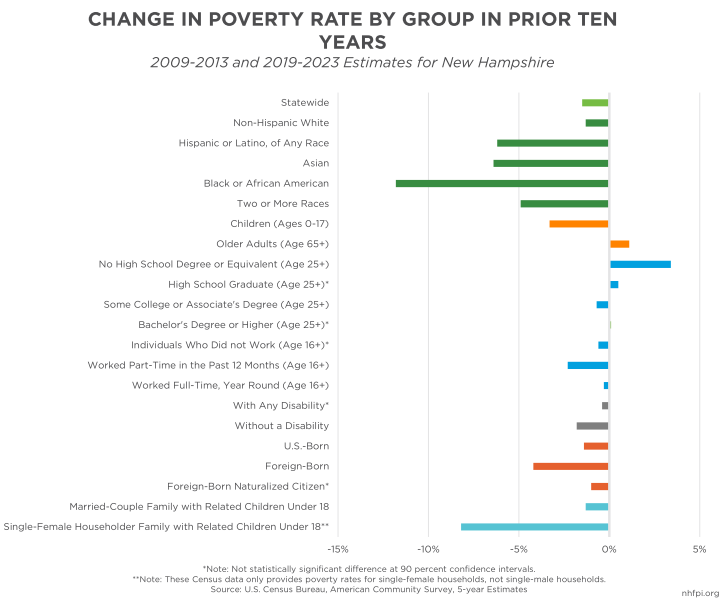
While single female-headed families typically experience the highest rates of poverty, such families also experienced one of the largest declines in poverty (8.2 percentage points) over the previous ten-year period relative to other measured groups. The OPM does not account for tax credits, most notably expansions to the Child Tax Credit in 2021, so pandemic-related tax assistance would not be a direct factor in this decline. Declines in poverty among single female-headed families is more likely due to the state’s labor force constraint helping to increase wages for workers at the bottom end of the income scale. In addition, household investments and increased spending, facilitated by pandemic-related aid, may have boosted private sector incomes and opportunities for employment. During the 2009-2013 period, single female-headed families with related children under 18 represented 51.1 percent of the total number of families living in poverty; in 2019-2023, this number dropped to 39.9 percent.[39]
Although poverty data surrounding homeowner and renter families is unavailable for 2009-2013, data from other prior five-year time frames can provide insight into changes over time. Between 2014-2018 and 2019-2023, poverty among the state’s renter families declined by about 3.8 percentage points, while poverty among homeowner families increased slightly by 0.5 percentage points.[40] On the contrary, while the poverty rate remained relatively flat among homeowner families, more families owning their homes were living in poverty compared to prior years. During 2019-2023, homeowner families represented about 48.6 percent of the total number of families in poverty, up from 34.5 percent in the prior five-year period.[41]
Concluding Discussions and Considerations
While anyone can experience poverty, certain characteristics can place individuals at an increased risk of living with poverty-level incomes. In the Granite State, children and older adults, those with lower levels of educational attainment, adults with limited labor force participation, and those with a disability traditionally represent the largest percentages of the total population living with poverty-level incomes. Amongst families, single female-headed families and families who rent their homes traditionally represent the groups with the highest poverty rates. Among individuals or families who fall into multiple of these populations, the likelihood of experiencing poverty may be higher.
Socioeconomic status, which includes factors such as educational and employment opportunities, provides more insight into groups with a higher likelihood of experiencing poverty. Granite Staters age 25 and older with no more than a high school diploma or equivalent accounted for more than half (56.1 percent) of those living in poverty in the most recent five-year span of data. This percentage has remained similar over the previous decade, highlighting an ongoing association between lower levels of educational attainment and economic hardship. These similarities suggest that those with lower educational backgrounds are not only more susceptible to poverty, but such groups may also be more likely to remain with poverty-level incomes for long spans of time. While engagement in the labor force may decrease the likelihood of poverty, not all occupations provide the same level of economic security for Granite Staters. Most occupational groups experiencing higher poverty rates tend to require lower levels of educational attainment, reflecting the association between education and economic constraints for families in New Hampshire. Limited access to higher education and other skill-based training can be a barrier to securing employment with more sustainable wages.
In addition to socioeconomic considerations, disability status is also a key determinant of poverty. According to the most recent five-year data, individuals with a disability represented close to one in three (29.4 percent) of the state’s residents living in poverty, a notable increase from the more than one in five (22.4 percent) residents ten years prior. While this rise may be in part due to the state’s aging population, since older adults are more likely to experience a disability, increasing percentages can reflect financial instability. Ongoing health conditions can limit full-time labor force participation, pushing more individuals with disabilities under the federal poverty thresholds. Medicaid and other forms of assistance remain critical for ensuring Granite Staters with disabilities are able to access needed care, particularly among those who are not working and not otherwise receiving health coverage through private employer-based means. According to 2019-2023 data, nearly two in three (60.3 percent) individuals with a disability who were also living in poverty relied on Medicaid or another form of medical assistance for their health coverage. Without such assistance, many in the Granite State would likely face significant barriers in obtaining needed health care services.
Housing affordability is also impacting poverty rates among New Hampshire residents. Although renter families accounted for nearly two thirds of families in poverty in 2014-2018, the rising number of homeowners experiencing poverty in recent data may reflect the state’s ongoing housing constraints. Since the start of the COVID-19 pandemic, rising costs for single-family homes have outpaced income and wage growth in the state. For instance, new homeowners purchasing a home in 2024 paid monthly mortgage rates more than double (134.0 percent) that of someone purchasing a home in 2017. Rising prices are likely preventing families from entering the purchasing market, limiting wealth-building opportunities that are associated with homeownership. Despite increasing constraints for homeowner families, renter families in the Granite State still experience poverty rates almost five times higher than families who own their home. Given these disparities, housing assistance is vital for helping ensure families are able to remain in their homes amidst ongoing housing concerns.
While social assistance and supports are critical for those with the lowest incomes, program uncertainties and changes could disrupt services for these communities. Proposed federal funding changes for Medicaid could shift substantial costs to the state, potentially limiting services for those with lower incomes and disabilities.[42] Suggested changes to the HCV Program, an entirely federally-funded initiative, could also impact New Hampshire residents. According to the Center on Budget and Policy Priorities, recently proposed federal funding adjustments could decrease housing assistance for up to 1,500 voucher recipients in the Granite State. HCVs administered through New Hampshire Housing would account for approximately 500 of these voucher reductions, equal to around 11.5 percent of the 4,338 HCVs allocated through New Hampshire Housing in 2024.[43]
Considering potential policy changes, maintaining and expanding assistance will be essential for ensuring economic stability for those with the lowest incomes in New Hampshire. As the state continues to navigate economic and demographic shifts in coming years, targeted assistance will play a crucial role in addressing economic hardship and improving the well-being of Granite Staters living with poverty-level incomes.
Works Cited
[1] See the U.S. Census Bureau webpage, Poverty in the United States: 2023, Official Poverty Measure, Poverty Thresholds.
[2] For more information around the history of the OPM, see NHFPI’s February 2024 Issue Brief, Poverty and Food Insecurity in New Hampshire During and Following the COVID-19 Crisis and the U.S. Census Bureau’s webpage, The History of the Official Poverty Measure.
[3] See NHFPI’s October 2024 blog, Low Poverty Rate in New Hampshire Does Not Rank Lowest Among States by All Estimates of Poverty. For more SPM data, see NHFPI’s June 2024 blog, Poverty Among Older Adults Rose Significantly, and Rebounded for Children, in 2022.
[4] For poverty rates across New England States, see the U.S. Census Bureau, American Community Survey, Table S1701, 1-year estimates, 2023. All statistical significance tests throughout the report were calculated using the U.S. Census Bureau’s Statistical Testing Tool.
[5] For 2024 cost of living estimates in New Hampshire, see the Massachusetts Institute of Technology’s Living Wage Calculator and the Economic Policy Institute’s Family Budget Calculator.
[6] For household income data, see the U.S. Census Bureau, American Community Survey, Table S1901, 1-year estimates, 2023.
[7] For poverty rates, see the U.S. Census Bureau, American Community Survey, Table S1701, 1-year estimates, 2016-2023.
[8] See the U.S. Census Bureau, Population Estimates Program, City and Town Population Totals, 2023.
[9] For poverty rates by age and gender, see the U.S. Census Bureau, American Community Survey, Table S1701, 1-year estimates, 2023.
[10] For poverty rates by race and ethnicity, see the U.S. Census Bureau, American Community Survey, Table S1701, 5-year estimates, 2019-2023.
[11] For poverty rates among native and foreign-born populations, see the U.S. Census Bureau, American Community Survey, Table S1703, 5-year estimates, 2019-2023.
[12] For more information on early child care and education, see NHFPI’s May 2024 Issue Brief, The Fragile Economics of the Child Care Sector and February 2025 Report, The Economic Impact of the Granite State’s Child Care Shortage.
[13] Poverty rates among single male householders were calculated using the U.S. Census Bureau’s Microdata Access Tool, drawing on data supplied by the American Community Survey, 5-year estimates, 2019-2023. Raw numbers for households in poverty are also accessible on the U.S. Census Bureau’s website.
[14] For poverty rates by family composition, see the U.S. Census Bureau, American Community Survey, Table S1702, 5-year estimates, 2019-2023.
[15] Poverty rates among single female householders by race were calculated using the U.S. Census Bureau’s Microdata Access Tool, drawing on data supplied by the American Community Survey, 5-year estimates, 2019-2023. Raw numbers for households in poverty by race and ethnicity can be found for those identifying as Hispanic or Latina, Black or African American, and white and non-Hispanic. Due to small population sizes, all data used in this Report calculated from the Microdata Access Tool are subject to statistical uncertainty, with margins of error unavailable.
[16] For more research on the impacts of higher education, see the Brookings Institution’s report, Twelve Facts About the Economics of Education, published June 2024.
[17] For poverty rates by educational attainment, see the U.S. Census Bureau, American Community Survey, Table S1701, 5-year estimates, 2019-2023.
[18] Poverty rates among the foreign-born population by educational attainment were calculated using the U.S. Census Bureau’s Microdata Access Tool, drawing on data supplied by the American Community Survey, 5-year estimates, 2019-2023. The U.S. Census Bureau tool provides access to raw numbers for the number of foreign-born New Hampshire residents in poverty by educational attainment.
[19] For poverty rates by employment status, see the U.S. Census Bureau, American Community Survey, Table S1701, 5-year estimates, 2019-2023.
[20] Poverty rates by occupational group were calculated using the U.S. Census Bureau’s Microdata Access Tool, drawing on data supplied by the American Community Survey, 5-year estimates, 2019-2023. The U.S. Census Bureau tool provides access to raw numbers for New Hampshire workers in poverty by occupational group.
[21] For median wage data, see the U.S. Bureau of Labor Statistics, May 2023 State Occupational Employment and Wage Statistics, New Hampshire.
[22] For poverty rates by New Hampshire county, see the U.S. Census Bureau, American Community Survey, Table S1701, 5-year estimates, 2019-2023. For more information around poverty by county, see NHFPI’s December 2024 blog, Seven N.H. Takeaways from Recent U.S. Census Data: Income Gains, Poverty Gaps, and Housing Challenges.
[23] For more research on economic barriers facing individuals with disabilities, see the U.S. National Council on Disability, 2023 Progress Report, Toward Economic Security: The Impact of Income and Asset Limits on People with Disabilities, published October 2023 and the Kaiser Family Foundation’s webpage, Medicaid: Working-Age Adults with Disabilities Living in the Community, published January 2024.
[24] For poverty rates by disability status, see the U.S. Census Bureau, American Community Survey, Table S1703, 5-year estimates, 2019-2023.
[25] For more information on disability data, see the U.S. Census Bureau’s webpage, How Disability Data are Collected from The American Community Survey.
[26] For the percent of the population with a disability by age, see the U.S. Census Bureau, American Community Survey, Table B18101, 1-year estimates, 2023.
[27] Poverty rates by age group among those with a disability were calculated using the U.S. Census Bureau’s Microdata Access Tool, drawing on data supplied by the American Community Survey, 5-year estimates, 2019-2023. The U.S. Census Bureau tool provides access to raw numbers for New Hampshire residents with a disability and living in poverty can be found for older adults (65+), children (0-17), and traditional working-age adults (18-64).
[28] Labor force participation rates among those in poverty were calculated using the U.S. Census Bureau’s Microdata Access Tool, drawing on data supplied by the American Community Survey, 5-year estimates, 2019-2023. The U.S. Census Bureau tool provides access to raw numbers for those in poverty and their employment statuses.
[29] Enrollment in Medicaid or medical assistance among those in poverty was calculated using the U.S. Census Bureau’s Microdata Access Tool, drawing on data supplied by the American Community Survey, 5-year estimates, 2019-2023. The U.S. Census Bureau tool provides access to raw numbers for those in poverty who were experiencing a disability.
[30] See the New Hampshire Department of Health and Human Services, Medicaid Enrollment Demographic Trends and Geography, January 2025, page 2. The older adult population enrolled in Medicaid is grouped together, regardless of disability status. Thus, a precise number around the percentage of the state’s total Medicaid population with a disability cannot be provided, according to this data. Children (ages 0-18) and adults (ages 19-64) with disabilities make up 8.4 percent of the total Medicaid population when combined.
[31] For poverty rates by housing tenure, see the U.S. Census Bureau, American Community Survey, Table S1702, 5-year estimates, 2019-2023.
[32] Housing tenure among those in poverty was calculated using the U.S. Census Bureau’s Microdata Access Tool, drawing on data supplied by the American Community Survey, 5-year estimates, 2019-2023. The U.S. Census Bureau tool provides access to raw numbers for those in poverty and those not in poverty.
[33] See the U.S. Department of Housing and Urban Development’s webpage, PHA Contact Information. The dates of publication and most recent update are unavailable, so this list may not be a current list of all PHAs in New Hampshire.
[34] See New Hampshire Housing, 2024 Annual Report, page 12. For more information on Housing Choice Vouchers, see the Center on Budget and Policy Priorities webpage, Policy Basics: The Housing Choice Voucher Program, updated September 2024.
[35] Housing tenure length among those in poverty was calculated using the U.S. Census Bureau’s Microdata Access Tool, drawing on data supplied by the American Community Survey, 5-year estimates, 2019-2023. The U.S. Census Bureau tool provides access to raw numbers for those in poverty and those not in poverty.
[36] See New Hampshire Housing, 2023 Residential Rental Cost Survey Report, page 10.
[37] Data surrounding the decade of housing construction was calculated using the U.S. Census Bureau’s Microdata Access Tool, drawing on data supplied by the American Community Survey, 5-year estimates, 2019-2023. The U.S. Census Bureau tool provides access to raw numbers for those in poverty and those not in poverty. ACS data for year housing structure built is collected via survey participant (e.g. renter/homeowner), assuming the participant knows when their home was originally built. Year of construction refers to the year the original home was built, not the year of any added renovations.
[38] For more information on the impacts of environmental and housing hazards, see the U.S. Department of Health and Human Services’ webpage, Healthy People 2030: Quality of Housing.
[39] For more information on the impacts of the Child Tax Credit, see NHFPI’s March 2022 Issue Brief, Expansions of the Earned Income Tax Credit and Child Tax Credit in New Hampshire.
[40] All changes in poverty were calculated using the U.S. Census Bureau’s American Community Survey, Tables S1702, S1702, and S1703, 5-year estimates.
[41] Homeowner and renter families as a percentage of all families in poverty are calculated using poverty rates among such populations. For poverty rates, see the U.S. Census Bureau, American Community Survey, Table S1702, 5-year estimates. Numbers may not add up to 100% due to rounding.
[42] For more information on proposed federal funding changes to Medicaid and its impact on the state, see NHFPI’s January 2025 blog, Potential Federal Medicaid Policy Changes Could Shift Substantial Costs to States.
[43] See the Center on Budget and Policy Priorities’ February 2025 report, To Better Meet Record Levels of Need, Keep Families Housed, Congress Must Increase 2025 Funding for Housing Assistance. For 2024 HCV recipient totals, see New Hampshire Housing, 2024 Annual Report, page 12. Percentage calculated by dividing 500 by 4,338; HCV allocations fluctuate year-to-year based on availability and need.