Federal funding plays a crucial role in New Hampshire’s economy. Direct payments to individuals, such as through Social Security benefits, and funding that supports government services constitute the majority of the funds that flow from the federal government to New Hampshire. Contracts for goods and services that are supplied to federal agencies and aid that is deployed to institutions for specific purposes, such as Pell Grants for enhanced access to higher education, also contributed substantially to federal spending in New Hampshire.
The dollars awarded through these two mechanisms totaled $14.8 billion pledged during Federal Fiscal Year (FFY) 2024 and to be spent in New Hampshire. Of that total, pledged assistance totaled $12.5 billion in FFY 2024, and contracts awarded for work to be done in New Hampshire totaled $2.3 billion.[1] The New Hampshire economy produced about $121 billion in goods and services during 2024, making these federal dollars the equivalent of about 12.3 percent of the entire state economy.[2]
In addition to grants and payments to support services, federal employment also contributes to New Hampshire’s economy. About 19,000 federal workers lived in New Hampshire, and about 9,000 federal jobs were based within the state’s borders.
Using a broader measure with older data, the Rockefeller Institute of Government at the State University of New York estimated that total federal funding that flowed to New Hampshire in Federal Fiscal Year (FFY) 2022, including COVID-19-related expenditures, was $21.8 billion. This figure includes Medicare payments, tax credits, Veteran benefits, salaries for federal workers, aid to state and local governments, housing and food assistance, military expenditures, and direct payments to individuals and businesses.[3] For context, the size of the total New Hampshire economy in 2022 was about $106 billion, putting total federal funding at the equivalent of about 21 percent of the size of the state’s economy in 2022.[4]
As the federal government makes changes to both grant funding opportunities and federal employment, understanding the role of federal funds in New Hampshire’s economy may provide insights into the potential impacts of policy changes in the Granite State.
Federal Assistance Programs and Contracts in New Hampshire
The federal government provides assistance to individuals, businesses, and the economy through a wide variety of mechanisms. Some of this aid is funded directly by the federal government, while other supports are awarded to people and organizations outside of the federal government.
For example, Medicare is a federally-operated health insurance program primarily for adults age 65 and older. About 7.8 percent of Granite Staters had Medicare as their only health coverage in 2023, and approximately 13.8 percent of the state’s population had a combination of Medicare and another coverage plan.[5] In Federal Fiscal Year 2021, which spanned from October 1, 2020 through September 30, 2021, the federal government spent about $2.2 billion on hospital, outpatient, equipment, and preventative services costs for Granite Staters enrolled in Medicare.[6]
The U.S. Internal Revenue Service, which primarily collects revenue through taxation, also provides assistance directly to individuals in the form of tax credits. For example, in 2021, child poverty as measured by the Supplemental Poverty Measure was reduced by half both nationally and in New Hampshire; this drop was due to a temporary expansion of the Child Tax Credit and the one-time Economic Impact Payments, which were both delivered through the tax code.[7] Specific tax credits in the federal income tax code reduced federal tax liability by $582.8 million for New Hampshire residents in Tax Year 2022; additionally, $116.1 million in Earned Income Tax Credit, 84.8 percent of which was paid as refundable tax credits to working taxpayers with low incomes, and $18.9 million in refundable American Opportunity Tax Credit payments for certain higher education-related expenses were paid to New Hampshire residents beyond those baseline credits.[8]
However, other federal aid is delivered through awards, including assistance and contracts, to non-federal entities that operate separately from the federal government. “Assistance” includes money transferred to a non-federal entity for a public purpose established by the U.S. Congress, while “contract” spending is used to purchase goods and services for federal agencies to fulfill their public duties.
Federal expenditures awarded to non-federal entities can be tracked based on where the assistance is being provided to or, in the case of contracts, the work will be performed. Many of the non-federal organizations that receive federal assistance grants or contracts are large entities that may be working in several different states or countries. While some award recipients may be based outside of the state, the analyses below reflect where the “place of performance,” or where the work is expected to be substantively completed, was identified as New Hampshire in federal records.
Federal Agencies Funding Assistance and Contracts in New Hampshire
In FFY 2024, an estimated $14.8 billion in awards were obligated for activities in New Hampshire. These include initial assistance or contracts made during FFY 2024. While not all those dollars were spent during FFY 2024, the $14.8 billion total does not include assistance or contracts granted in prior years that were still generating active spending of federal resources in New Hampshire during FFY 2024. These payments included awards to individuals, businesses, and other organizations outside the federal government.
Payments to individuals from the Social Security Administration accounted for $8.0 billion, or 53.9 percent, of total awards made for New Hampshire activities in FFY 2024. About $7.0 billion were for monthly Social Security payments earned by retired individuals, while $879.1 million were for payments to individuals with disabilities and $122.2 million were for the Supplemental Security Income assistance program.[9]
The next largest federal agency contributing to awards in New Hampshire was the Department of Defense, primarily through contracts with private-sector organizations. The Department of Defense was the source of 93.4 percent of the $2.3 billion in federal contract spending in New Hampshire, followed by the Department of Veterans Affairs with about $32.1 million, or 1.4 percent of total contract spending. Within the Defense Department, the largest contract amounts initiated in FFY 2024 were for the Navy ($826.3 million), the Air Force ($624.0 million), the Army ($464.8 million), and the Defense Logistics Agency ($141.1 million).
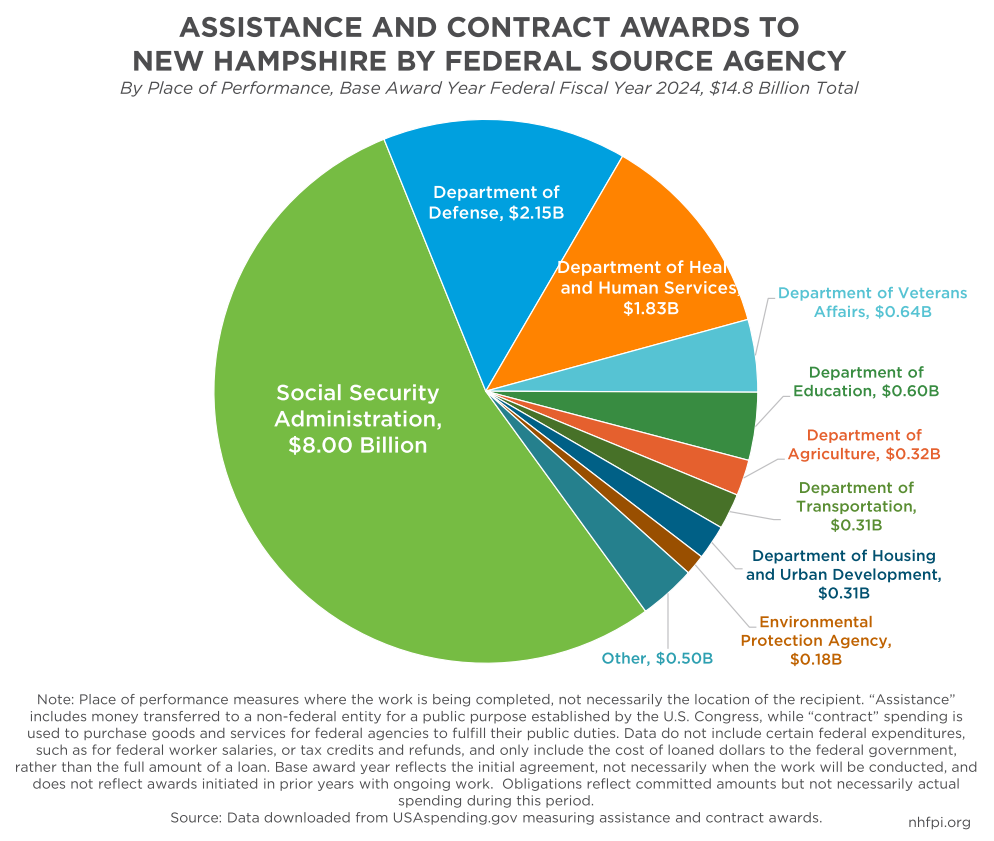
The $1.83 billion in assistance grants from the federal Department of Health and Human Services included $1.55 billion from the U.S. Centers of Medicare and Medicaid Services, and $1.38 billion that were specifically for Medicaid vendor payments. These Medicaid payments flowed through the New Hampshire Department of Health and Human Services (NH DHHS) at the State government level, making the State’s agency a top recipient of federal award funds in New Hampshire.
Aid from the federal Department of Education included about $408.5 million in Pell Grants obligated in FFY 2024, which are provided to higher education institutions for eligible and enrolled students who have exceptional financial needs.[10]
Supplemental Nutrition Assistance Program (SNAP) benefits, which are federally-funded food assistance and flow from the U.S. Department of Agriculture to the NH DHHS, totaled $145.2 million in obligations during FFY 2024. Both public and private section analyses identify SNAP benefits as economically stimulative, as recipients are more likely to spend food assistance dollars relatively quickly and in their local economies. A 2021 analysis from Moody’s Analytics identified that the $1.61 of estimated economic growth within the year of a $1 federal investment in SNAP benefits was the highest return on investment of any policy Moody’s analyzed, and the U.S. Department of Agriculture estimated the economic multipliers from SNAP benefits would be larger in rural areas.[11]
Aid to state and local governments for transportation operations, housing supports, and environmental programs focused on water quality also contributed significantly to aid flowing into New Hampshire. The federal Highway Infrastructure Grant Program totaled $88.3 million in funding to New Hampshire during FFY 2024, while the Surface Transportation Block Grant program was $65.4 million. Tenant-based emergency rental assistance totaled $31.4 million in new obligations in FFY 2024, and funding for the Low Income Home Energy Assistance Program, which helps fund heating and cooling costs, totaled $31.0 million.[12] Environmental Protection Agency funding in FFY 2024 for the State revolving funds for clean water and drinking water infrastructure totaled $105.7 million.
Largest New Hampshire Recipients of Federal Assistance and Contract Dollars
While the majority of assistance and awards granted for activities within New Hampshire were to individuals receiving earned retirement benefits and other payments from the Social Security Administration, individual organizations were recipients of significant federal awards in New Hampshire.
The NH DHHS was the single-largest recipient of federal awards to be used in New Hampshire. Of the $1.94 billion received by the NH DHHS in FFY 2024, $1.38 billion (71.2 percent) were for Medicaid payments. Medicaid, a program jointly-funded by the state and federal governments designed to support the health of people with low incomes, limited assets, or certain disabilities or health conditions, was the single-largest program the State of New Hampshire operated last fiscal year and served about 13 percent of the state’s population.[13] Other significant federal programs providing funding to the NH DHHS included the Supplemental Nutrition Assistance Program, the Temporary Assistance for Needy Families block grant, and grants for substance abuse treatment.
The next largest recipient of funds in the state in FFY 2024 was BAE Systems, a private company working in the military and space sectors, with $1.48 billion in new contracts generated that year.[14] These contracts were all between BAE Systems and the Department of Defense, and included payments for aircraft, missile guidance systems, and electronic warfare technologies. The fifth-largest recipient, Newington-based Sig Sauer, also had contracts primarily with the Department of Defense, but also with the federal Departments of Veterans’ Affairs, Homeland Security, Interior, and State. Most of the dollars in these contracts were for ammunition and small arms. Other contracts among the top 20 recipients were almost entirely dollars flowing from the federal Department of Defense.
Other major recipients of federal awards in the state included other New Hampshire government organizations in charge of administering federally-supported services, including transportation, education, and environmental services, particularly funding designed to support water infrastructure and quality. Housing authorities, including both statewide authorities and those in Manchester and Nashua, received significant direct funding from the federal government for financing rental and other housing assistance programs.
Three higher education institutions are in the top 20 recipients. Southern New Hampshire University, a private institution, received $358.7 million in funding, primarily for federal Pell Grants, with an additional small amount for federal work-study programs and other educational supports. Southern New Hampshire University reports that more than 3,000 students are enrolled on campus, while more than 200,000 are online students; while many of the students benefitting from these Pell Grants live out of state, the payments are still made to Southern New Hampshire University and counted as assistance to an institution in the state’s borders.[15] The public University System of New Hampshire received funding from the National Aeronautics and Space Administration, the National Oceanic and Atmospheric Administration, and the Department of Energy for research and development, as well as the National Science Foundation and the National Institutes of Health. Dartmouth College, another private institution, also received funding for research, including biomedical and infectious disease research, from the federal Department of Health and Human Services and the National Science Foundation, with smaller amounts from the Departments of Defense, Education, and Energy.

These data do not trace the transfers of these dollars to subawards, such as subcontracts, that may ultimately shift significant portions of the funding to other organizations to execute the purpose of the dollars. For example, the NH DHHS contracts with nonprofit agencies to manage key Medicaid services and to deliver developmental disability and mental health care, which are significant expenditures.[16] A February 2025 analysis from the Urban Institute estimated that nonprofits in New Hampshire received $1.1 billion in government grants in 2021, and that about 62.9 percent of the 663 nonprofits with government grants in New Hampshire would be at risk of a financial shortfall without those grants.[17]
Federal Employees in New Hampshire
There are two primary ways to comprehensively count the number of federal employees connected to New Hampshire with available data. One measure counts federal jobs with physical worksites within the state. The other measures the number of New Hampshire residents who work for the federal government, whether or not their jobs are formally based in New Hampshire.
According to New Hampshire Employment Security, the number of non-vacant federal jobs based in New Hampshire during 2023 was 8,792, compared to 18,885 State government jobs, 54,248 local government jobs, and 682,265 jobs based in the state overall, including part-time and full-time positions. For the first three quarters of 2024, the average number of filled federal positions was 9,095, with a reported average weekly wage of $1,977. Using the available 2024 data and assuming 52 weeks per year of work totaling $102,804 average annual pay, about $935.0 million in wages paid by the federal government flowed to workers with jobs based in New Hampshire.[18]
However, more New Hampshire residents indicate they are federal employees in response to U.S. Census Bureau surveys than have positions based within the state’s borders. Federal employees may have been commuting out of state, such as to regional federal offices in Massachusetts or to the Portsmouth Naval Shipyard in Maine, or may have been working for agencies remotely. U.S. Census Bureau data from 2023 estimated that about 19,000 residents, or about 2.5 percent of all employed residents, were federal government workers.[19]
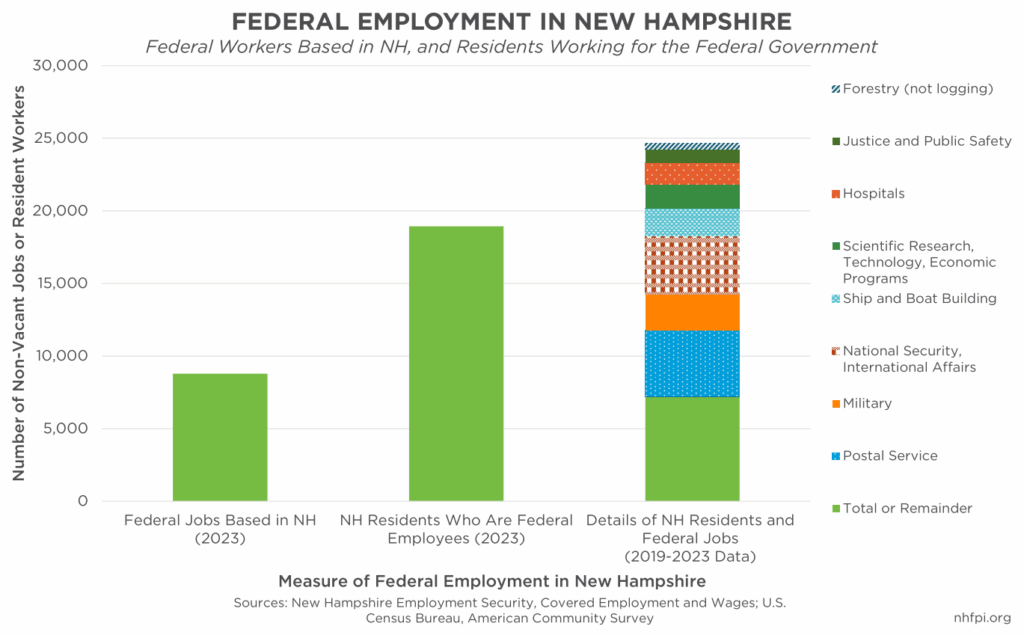
U.S. Census Bureau data collected from 2019-2023 allow for more granular analysis of the roles of these federal workers. During this period, an average of about 25,000 New Hampshire residents indicated they were federal employees when surveyed. About 4,500 were U.S. Postal Service workers. Approximately 4,000 worked in national security or international affairs, and another 2,500 were employed by the military. An estimated 1,900 worked in ship and boat building, and 1,600 worked in hospital or outpatient medical settings. Another 1,600 worked in economic program administration or scientific research.[20]
Comparisons to Other States
The federal government has an important role in the public services and economies of every state. The relative impacts of federal transfer do vary, however, and federal expenditures in New Hampshire are the equivalent of about 21 percent of both the state’s economy and total personal income, which is relatively low compared to the majority of other states.
New Hampshire Typically Pays More Than It Receives
With some of these federal funds flowing into New Hampshire at risk of changing as major federal policy shifts are considered, New Hampshire residents continue to contribute to federal funds through taxation and fees.
For FFY 2022, the Rockefeller Institute of Government estimated that the federal government distributed about $15,611 per New Hampshire resident within the state. That same year, the federal government collected about $17,347 per person from the state’s residents and businesses. New Hampshire was one of ten states that contributed more to the federal government than was collected from it, according to the Rockefeller Institute. This imbalance is made possible by federal deficit spending, as more aggregate expenditures occur each year than revenue is collected. By the Institute’s calculations, New Hampshire paid more than in received in FFY 2015, 2016, 2017, and 2022, while it received more than it paid in FFYs 2018 through 2021, a period that included increased federal aid associated with the COVID-19 pandemic and lower revenue collections following the federal Tax Cuts and Jobs Act.[21]
New Hampshire’s position reflects a relatively high median household income in the state and a relatively low poverty rate.[22] As the federal government collects significant revenues through individual income taxes, states with more prosperous local economies and higher incomes within their borders, such as Massachusetts, New Jersey, Washington, and California, pay more per capita than states with lower amounts of personal income collected.[23]
Federal Government Expenditures Larger Relative to Most Other State Economies
New Hampshire’s economy was about $106 billion in 2022 as measured by Gross State Product, which reflects the value of all goods and services produced in the state that year.[24] According to the Rockefeller Institute of Government, the federal government distributed about $21.8 billion in New Hampshire during FFY 2022. That total included direct federal payments such as Social Security payments and housing assistance, tax credits such as the Earned Income Tax Credit, grants from federal agencies, contracts, federal worker wages, and expenditures related to COVID-19.[25]
Not all these dollars go directly into New Hampshire’s Gross State Product as measured. While the federal assistance also includes transfer payments to individuals, they do not directly translate into personal income in all situations, either; total personal income to people living in New Hampshire totaled nearly $105 billion in 2022. However, both economic measures can be used to show the relative magnitude and importance of federal expenditures. The value of the FFY 2022 distribution of federal expenditures in New Hampshire was the equivalent of 20.5 percent of 2022 Gross State Product in New Hampshire, and the equivalent of 20.9 percent of 2022 personal income.
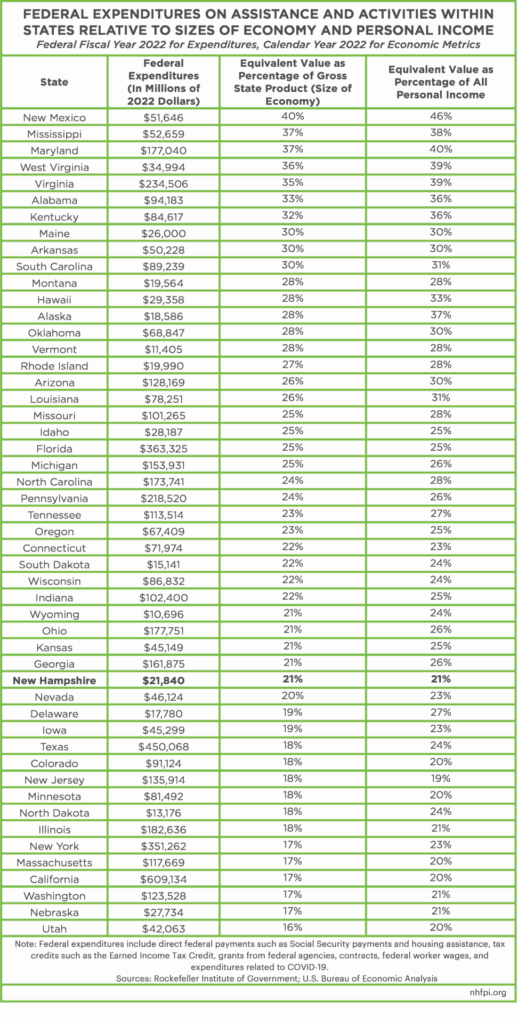
Relative to both the size of its economy and personal income, federal expenditures in New Hampshire are lower than a majority of states. While federal expenditures in Utah were the equivalent of only 16.1 percent of that state’s economy in 2022, only 14 other states had smaller relative percentages than New Hampshire. New Mexico (40.3 percent), Mississippi (36.9 percent), Maryland (36.5 percent), West Virginia (35.6 percent), and Virginia (35.2 percent) received FFY 2022 expenditures from the federal government that were the largest relative to the sizes of their 2022 economies.
Only six states have federal expenditures that, relative to their total personal incomes, were smaller than New Hampshire. New Hampshire’s 20.9 percent was larger than Utah (20.5 percent) and some states with many higher-income residents, led by New Jersey (18.9 percent), Massachusetts (19.5 percent), and California (20.3 percent). New Mexico (46.0 percent), Maryland (40.3 percent), West Virginia (39.3 percent), Virginia (38.8 percent), and Mississippi (38.0 percent) again topped the list.
For more interstate comparisons of federal expenditures to Gross State Product and personal income, see the Appendix of this Issue Brief.
Conclusion
Federal funding plays a significant role in the New Hampshire economy. More than $14.8 billion were pledged to individuals or organizations in New Hampshire during FFY 2024, and that does not include the payments to the thousands of federal employees who work in the state, payments for health coverage for older adults through Medicare, or the assistance provided to households and businesses through the tax code. A more expansive measure, relying on older data, estimated that federal expenditures in New Hampshire, beyond solely assistance and contracts, totaled $21.8 billion in FFY 2022.
These expenditures come in many forms. The $8.0 billion in Social Security Administration payments to individuals in the state in FFY 2024 is the equivalent of 6.9 percent of the estimated $116.8 billion in personal income statewide in 2024.[26] More than $2.1 billion in new contracts with the Department of Defense were signed by companies doing their work in New Hampshire in FFY 2024. Nearly $1.4 billion in federal funds were used to support Medicaid health services for people with low incomes and limited resources, while $408.5 million supported students with financial hardships in accessing higher education, and $145.2 million was devoted to supporting the State’s largest food assistance program. These dollars all have economic impacts on the local economy in New Hampshire, particularly including food assistance, which generates more than a dollar of economic output for every dollar invested in the Supplemental Nutrition Assistance Program.[27]
Changes to federal funding could impact both the ability of the State, local governments, and nonprofits to provide public services in New Hampshire and the economy overall.
Appendix
The table below shows the amounts of federal expenditures directed to each state, as calculated by the Rockefeller Institute of Government, for FFY 2022. The expenditure amount is then compared to the value of the state’s economy, as measured by Gross State Product, and the total personal income in the state. While these economic metrics provide points of comparison, federal expenditures are not necessarily incorporated completely into either measure. As such, federal expenditures are not necessarily the portion of the state’s economy equivalent to the percentage displayed in the table.
Endnotes
[1] These figures are based on downloaded data from USAspending.gov. Data from USAspending.gov are used throughout this Issue Brief in analysis of awards amounts, which includes assistance and contracts. The data are filtered for Federal Fiscal Year 2024 as a base year, representing the initial date of the assistance granted or the contract agreement. These are obligated dollars, which reflect committed amounts but not necessarily spending within that year. “Assistance” includes money transferred to a non-federal entity for a public purpose established by the U.S. Congress, while “contract” spending is used to purchase goods and services for federal agencies to fulfill their public duties. Data do not include certain federal expenditures, such as for federal worker salaries, or tax credits and refunds, and only include the cost of loaned dollars to the federal government, rather than the full amount of a loan. Base award year reflects the initial agreement, not necessarily when the work will be conducted, and does not reflect awards initiated in prior years with ongoing work. The data reflect where the “place of performance,” or where the work is expected to be substantively completed, was identified as New Hampshire in federal records For more information, see the USAspending.gov Federal Spending Guide and Glossary.
[2] The $121 billion figure reflects the size of the New Hampshire economy as measured by preliminary Gross State Product, using the figures for Calendar Year 2024 as of May 2025. For more information and analysis, see the U.S. Bureau of Economic Analysis’s March 28, 2025 data release Gross Domestic Product by State and Personal Income by State, 4th Quarter 2024 and Preliminary 2024, Table 1 and the most recent data from the U.S. Bureau of Economic Analysis’s Regional Economic Accounts ZIP Files.
[3] For the Rockefeller Institute of Government’s interactive dashboard showing federal receipts and collections by state, as well as a filter for funding related to COVID-19, see the Rockefeller Institute of Government’s Balance of Payments Portal. For a full methodology, see the analysis Giving or Getting? New York’s Balance of Payments with the Federal Government, 2024 Report. A federal fiscal year is based on October 1; for example, Federal Fiscal Year 2024 was October 1, 2023 through September 30, 2024.
[4] The $106 billion figure reflects the size of the New Hampshire economy as measured by Gross State Product, using the revised figures for Calendar Year 2022 as of March 2024. For more information and analysis, see the U.S. Bureau of Economic Analysis’s March 29, 2024 data release Gross Domestic Product by State and Personal Income by State, 4th Quarter 2023 and Preliminary 2023, Table 1 and updated data from the U.S. Bureau of Economic Analysis’s Regional Economic Accounts ZIP Files.
[5] See NHFPI’s October 10, 2023 analysis Health Coverage in New Hampshire Remained Steady in 2023.
[6] For more details, see the Kaiser Family Foundation’s Total Medicare Spending indicator and NHFPI’s February 4, 2025 Fact Sheet The Medicare Savings Program.
[7] For more information and analysis on the impacts of federal tax credits in New Hampshire, see NHFPI’s September 2023 analysis Latest Census Bureau Data Show Median Household Income Fell Behind Inflation, Tax Credit Expirations Increased Poverty, NHFPI’s March 2022 Issue Brief Expansions of the Earned Income Tax Credit and Child Tax Credit in New Hampshire, and NHFPI’s June 2024 analysis Poverty Among Older Adults Rose Significantly, and Rebounded for Children, in 2022.
[8] Data showing aggregated New Hampshire federal income tax data available from the U.S. Internal Revenue Service’s Statistics of Incomeprogram. To learn more about the Earned Income Tax Credit, see NHFPI’s March 2022 Issue Brief Expansions of the Earned Income Tax Credit and Child Tax Credit in New Hampshire. Learn more about the refundable American Opportunity Tax Credit on the U.S. Internal Revenue Service’s website, including comparisons to the non-refundable Lifetime Learning Credit.
[9] Detailed analysis derived from program-level data available through USAspending.gov. For more information on each of these operations within the Social Security Administration, see the webpages for the Disability Insurance Trust Fund, the Old-Age & Survivors Insurance Trust Fund, and Supplemental Security Income (SSI).
[10] For more information on Pell Grants and their delivery mechanisms, see the U.S. Department of Education’s website Federal Pell Grants.
[11] Learn more about the Supplemental Nutrition Assistance Program in NHFPI’s July 2021 Issue Brief The Supplemental Nutrition Assistance Program: An Overview of Potential Under Enrollment in New Hampshire. For more information on the economic multiplier effects of SNAP benefit payments, see NHFPI’s November 2021 blog Federal Increases to SNAP Benefits May Aid the Recovery from the COVID-19 Crisis More in Rural Areas and NHFPI’s 2025 New Hampshire Policy Points: Conclusion chapter.
[12] Learn more about the Low Income Home Energy Assistance Program in NHFPI’s November 2021 blog Federal Funds Boost Home Heating Assistance Ahead of Expected Winter Price Increases.
[13] For more information on Medicaid funding, see NHFPI’s January 2025 analysis Potential Federal Medicaid Policy Changes Could Shift Substantial Costs to States.
[14] See the BAE Systems website for more information on company products and activities.
[15] See Southern New Hampshire University’s reporting on the number of students enrolled at the University’s About Us webpage, accessed May 2025.
[16] For more information, see NHFPI’s publication Long-Term Services and Supports in New Hampshire, July 2022, page 6.
[17] For the full analysis, see the Urban Institute’s February 2025 data visualization What Is the Financial Risk of Nonprofits Losing Government Grants?
[18] New Hampshire Employment Security data used in this analysis were drawn from the Covered Wages and Employment dataset, which is based on participation in the unemployment compensation system. These data include both part-time and full-time workers.
[19] See the U.S. Census Bureau’s American Community Survey Tables K202402 and DP03.
[20] Analysis performed using the U.S. Census Bureau’s MDAT microdata analysis tool.
[21] For the Rockefeller Institute of Government’s interactive dashboard showing federal receipts and collections by state, as well as a filter for funding related to COVID-19, see the Rockefeller Institute of Government’s Balance of Payments Portal. For a full methodology, see the analysis Giving or Getting? New York’s Balance of Payments with the Federal Government, 2024 Report. See also the Concord Coalition’s Fiscal Dashboard. Learn more about the federal Tax Cuts and Jobs Act in NHFPI’s September 2024 analysis Federal Policymakers Will Consider Tax Changes Benefitting Higher-Income Granite Staters in 2025.
[22] See NHFPI’s October 2024 analysis Low Poverty Rate in New Hampshire Does Not Rank Lowest Among States by All Estimates of Poverty, and NHFPI’s September 2024 analysis New Hampshire’s Median Household Income Increased in 2023, Poverty Remained Steady.
[23] For more analysis, see the Rockefeller Center of Government’s Giving or Getting? New York’s Balance of Payments with the Federal Government, 2024 Report.
[24] The measure of the economy used in this analysis is Gross State Product. For both Gross State Product and Personal Income data by state and year, see the U.S. Bureau of Economic Analysis’s Regional Economic Accounts ZIP Files.
[25] For a full methodology, see the analysis Giving or Getting? New York’s Balance of Payments with the Federal Government, 2024 Report.
[26] See the U.S. Bureau of Economic Analysis data release Gross Domestic Product by State and Personal Income by State,
4th Quarter 2024 and Preliminary 2024, Table 4.
[27] See NHFPI’s New Hampshire Policy Points publication’s Conclusion chapter.