On December 12, 2024, the U.S. Census Bureau released new data that provide information about the wellbeing of Granite Staters during 2019 to 2023. These insights build on less detailed one-year data released earlier and collected only during 2023, and offer a deeper look into New Hampshire’s economy, poverty levels, and housing challenges. Here are seven quick takeaways from the one-year and five-year American Community Survey datasets that provide greater understanding about the lives of Granite Staters:
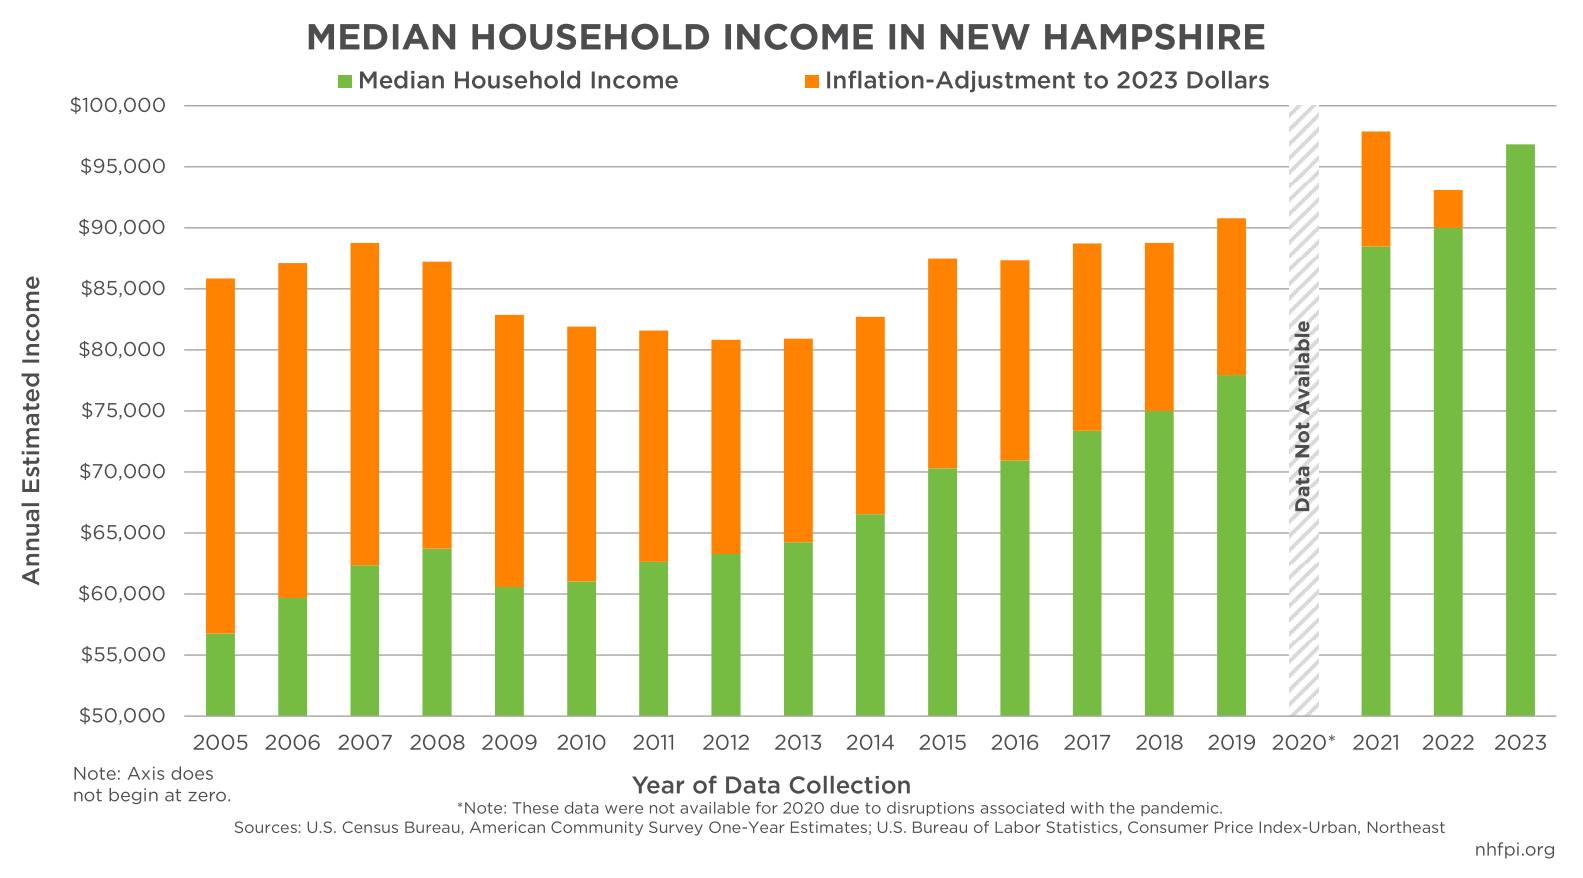
- Median household income growth outpaced inflation in 2023 after slipping behind in 2022. In 2023, New Hampshire’s median household income grew to about $97,000, which was an increase from approximately $90,000 in 2022. Even after adjusting for inflation and accounting for statistical uncertainty, the median Granite State household experienced a boost in the real purchasing power of the median household in 2023. Incomes had previously slipped behind inflation in 2022, and 2023’s increase brought inflation-adjusted income to about the 2021 level, the prior peak, rather than growing to a new high.

- Coos County median household income was about half of Rockingham County’s level. During the 2019-2023 period, median household income in Coos County, the northernmost and least populous county in the state, was about $58,000 in inflation-adjusted 2023 dollars, which was the lowest among the counties in the state. Rockingham County, the second-most populated New Hampshire county and the closest to metropolitan Boston, had a median household income of about $114,000, which was the highest in the state and nearly double that of Coos County. The Massachusetts Institute of Technology’s Living Wage Calculator estimated that the cost of living in Rockingham County for two working adults and one child was $105,005 in 2024, while in Coos County the same household would face living costs of $79,714.
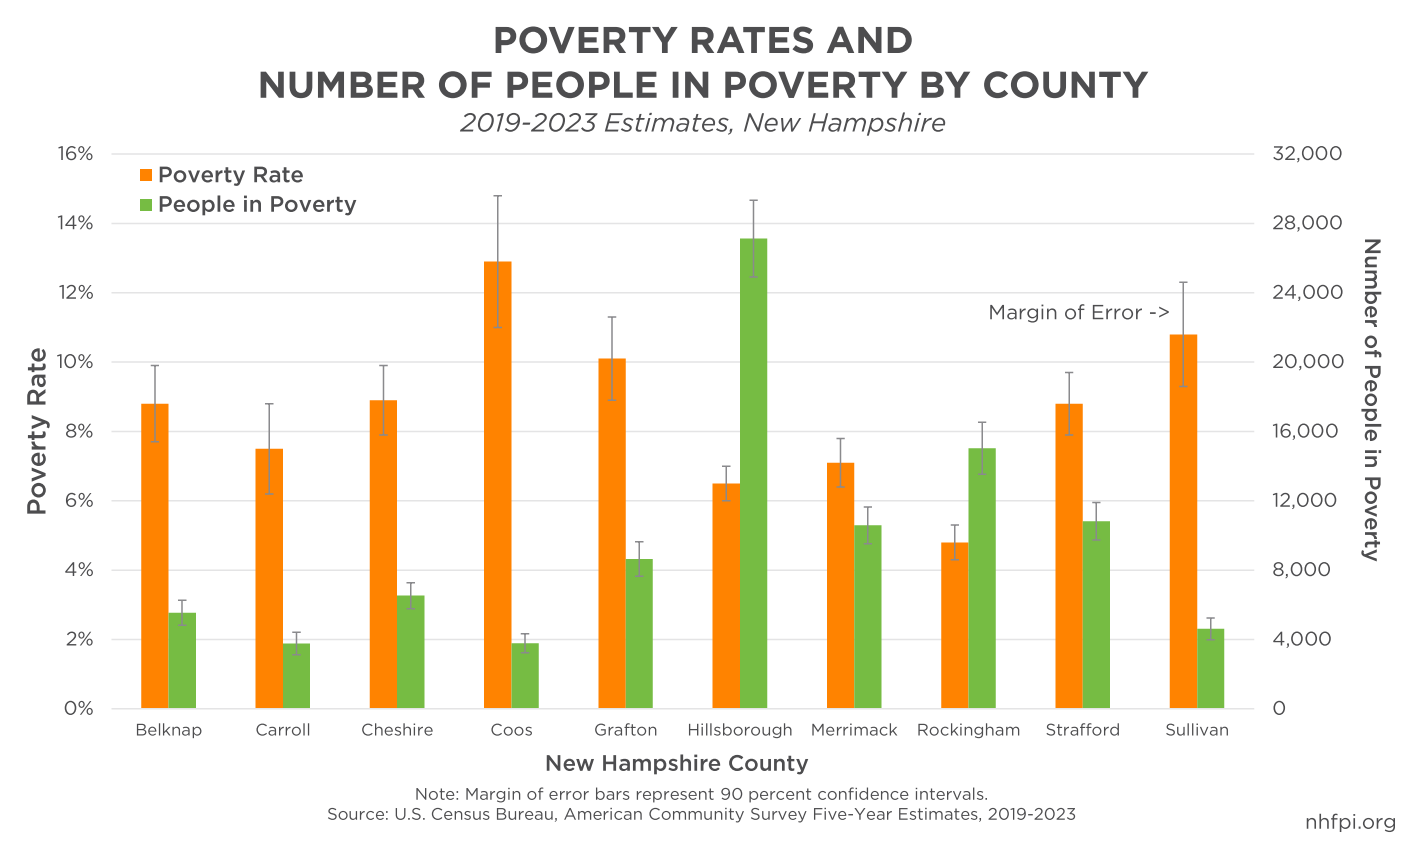
- Poverty rates were higher in northern and western counties. In the 2019-2023 period, poverty rates were highest in Coos County (12.9 percent) and Sullivan County (10.8 percent) in west-central New Hampshire. Uncertainty in these survey-based data render these two poverty rates statistically indistinguishable from each other, but both reflect that rural areas in northern and western New Hampshire faced higher concentrations of poverty.

- While it had the lowest poverty rate, Rockingham County had the second-highest number of people in poverty among the state’s counties. About 15,000 people lived in poverty in Rockingham County, behind only Hillsborough County’s 27,000 people, in the 2019-2023 period. While Coos County had a much higher poverty rate than either Rockingham or Hillsborough County, the total population in poverty was likely just under 4,000 people, based on available data.
- About 98,000 people in the state lived in poverty in New Hampshire during 2023. The Official Poverty Measure is based on income and household composition. Poverty thresholds for 2023 varied by household size and composition: in 2023, poverty level incomes were $15,852 for a single person under 65 years old, $21,002 for a household with one adult under 65 and one child, $24,526 for two adults and one child, and $30,900 for two adults with two children. Poverty thresholds varied based on other adjustments for different household compositions. In 2023, an estimated 98,000 people (7.2 percent) lived with incomes below Official Poverty Measure poverty thresholds, including about 20,000 children under 18 years old and 21,000 adults over age 64 years.
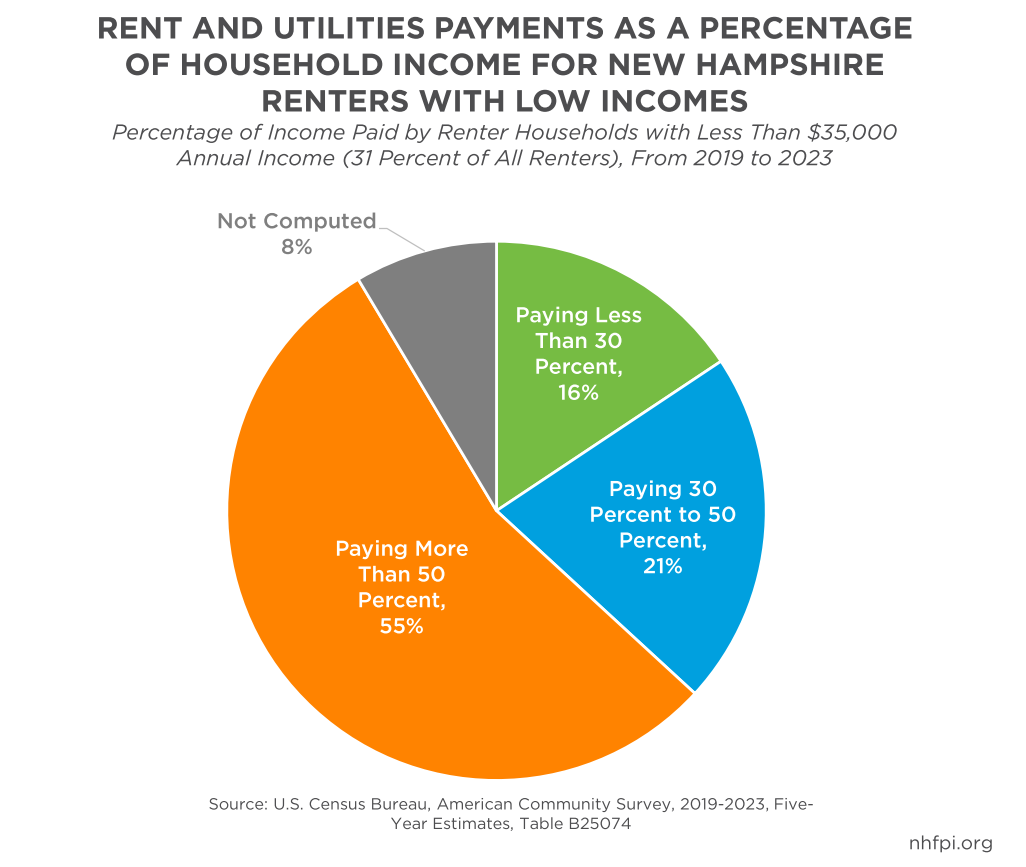
- More than half of renters were cost-burdened by housing, and renters with lower incomes faced even more significant hurdles paying for a place to live. The term “cost-burdened,” used by the U.S. Department of Housing and Urban Development describes households that pay more than 30 percent of their income toward housing. In 2023, approximately 51 percent of New Hampshire’s 157,000 renter households met the criteria of being housing cost-burdened, compared to about 28 percent of the 258,000 owner households paying a mortgage and about 20 percent of 155,000 owner households without a mortgage. More granular data for the 2019-2023 period shows that about 31 percent of New Hampshire’s renter households had annual incomes below $35,000 per year. Among these households, about three quarters were cost-burdened, and more than half were billed at least half of their income in rent and utilities.

- Poverty rates varied substantially among Granite Staters by race, ethnicity, disability status, and family structure. Reflecting long-standing structural barriers to opportunity and success that are more profound for some Granite Staters than others, poverty rates varied substantially by population group in New Hampshire in the 2019 to 2023 period. Female Granite Staters were more likely to be in poverty than male residents. Compared to the statewide rate of 7.2 percent, about one in five residents without a high school degree were in poverty, as were nearly one in ten residents who had a high school degree or the equivalent with no further formal education. The estimated poverty rate for Hispanic or Latino Granite Staters was about twice as high as for non-Latino white residents. About one in ten Granite Staters who identified as Black or African American, as well as those identifying as two or more races, were in poverty. Approximately one in six New Hampshire residents with a disability lived in poverty. Nearly one quarter of households with children headed by a single woman without a partner present had incomes below poverty levels as well.
These U.S. Census Bureau data can reveal key trends related to income and poverty, health coverage, housing, and other aspects of life in New Hampshire. Further analysis, particularly from the new five-year data covering 2019-2023, will provide additional insights into the wellbeing of different communities throughout the Granite State. For more research and information, subscribe to the New Hampshire Fiscal Policy Institute’s newsletter at nhfpi.org.
– Phil Sletten, Research Director
