This second edition of New Hampshire Policy Points provides an overview of the Granite State and the people who call New Hampshire home. It focuses in on some of the issues that are most important to supporting thriving lives and livelihoods for New Hampshire’s residents. Moreover, the book addresses areas of key policy investments that will help ensure greater well-being for all Granite Staters and a more equitable, inclusive, and prosperous New Hampshire.
New Hampshire Policy Points is intended to provide an informative and accessible resource to policymakers and the general public alike, highlighting areas of key concerns. Touching on some important points but by no means comprehensive, each section within New Hampshire Policy Points includes the most up-to-date information available on each topic area. The facts and figures included within this book provide useful information and references for anyone interested in learning about New Hampshire and contributing to making the Granite State a better place for everyone to call home.
To purchase a print copy or download a free digital PDF of New Hampshire Policy Points, visit nhfpi.org/nhpp

Education is a core public service and key to a well-informed citizenry. Education supports social mobility, opening doors to greater access to job opportunities and helping build financial stability.[1] Higher levels of educational attainment are associated with higher levels of health and well-being later in life, including longer lifespans.[2] Educational attainment is also correlated with lower levels of unemployment and poverty.[3] Investing in education and training opportunities for a skilled and well-educated workforce is vital to supporting both the individual lives of Granite Staters and the state economy overall.
Educational Attainment
New Hampshire’s population has a relatively high level of formal education. About 94.4 percent of Granite State residents over 25 years old held at least a high school diploma or equivalent in 2023, and approximately 40.7 percent had a bachelor’s degree or above.[4] These percentages are higher than the national figures of 89.9 percent and 36.2 percent, respectively.[5] While New Hampshire’s high school graduation rate is similar to neighboring Maine and higher than all other New England states except Vermont (95.5 percent), the percentage of New Hampshire’s population holding a bachelor’s degree or above falls below that of several other New England states including Massachusetts (47.8 percent), Vermont (43.7 percent), and Connecticut (42.9 percent).[6] The median earnings of individuals aged 25 and over increase with the level of formal education attained, making investment in the Granite State’s public education system vital to the long-term economic stability of New Hampshire’s residents.[7]
K-12 Public Education
Local public education in New Hampshire is primarily administered by school districts covering individual cities and towns or encompassing collaborative efforts among multiple municipalities. During the 2022-2023 school year, about 61 percent of school district funding for local public education was collected through local property taxes. Approximately 26 percent came through Adequate Education Aid from the State, including State property taxes raised and retained locally. Most Adequate Education Aid is allocated through grants on a per-pupil basis. These grants depend on several factors, including the number of students who are English language learners, who have special education needs, and who live in households with low incomes. Federal grants provided about 9 percent of local school district revenue, which was relatively high due to one-time funding related to the COVID-19 pandemic, while other State aid and other locally generated revenue comprised the remainder of revenues.[8]
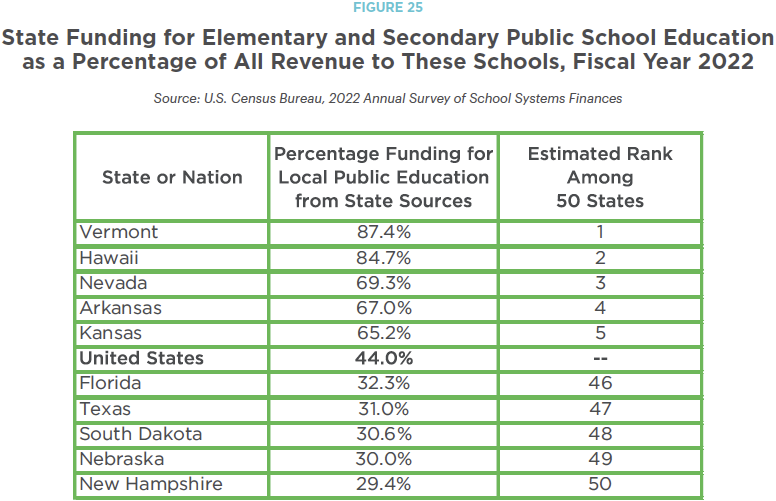
Significant inequities in education funding exist across New Hampshire due to the heavy reliance on local property taxes to raise revenue. Since property valuations vary substantially between school districts, as does the number of students served, there are significant disparities in the resources available for and invested in each student across town and city borders.[9] Greater support for education from the State could help alleviate these disparities. While New Hampshire had the 10th highest estimated total revenue per pupil from all sources among the 50 states in fiscal year 2022, it ranked 34th in state revenue per pupil and had the smallest percentage of local public education revenue coming from the state government (29 percent).[10] By directing more resources to districts with lower property values and students with lower incomes, the State could help address issues of education inequity and strengthen New Hampshire’s future workforce.
Higher Education
The Granite State is home to both public and private universities and colleges, as well as public community colleges, which provide a range of opportunities for higher education within the state. The state has both a public university system and a community college system. The University System of New Hampshire is comprised of Keene State College, Plymouth State University, University of New Hampshire – Durham, University of New Hampshire – Manchester, and the University of New Hampshire School of Law; while the Community College System of New Hampshire includes seven colleges with eleven campuses located in Berlin, Claremont, Concord, Keene, Laconia, Littleton, Manchester, Nashua, Portsmouth, and Rochester.[11]
Both prior to and during the pandemic, New Hampshire increased investments into public higher education, but still fell below every other state.[12] In fiscal year 2024, New Hampshire budgeted $125 dollars for public higher education for every person in the State.[13] The next-lowest funder of public higher education that year was Pennsylvania at $158 per capita while the national average was $378. Similarly, New Hampshire spent $3,990 per full time equivalent student in 2023. The next lowest funder was Vermont at $5,649, while the national average was $11,040.[14]
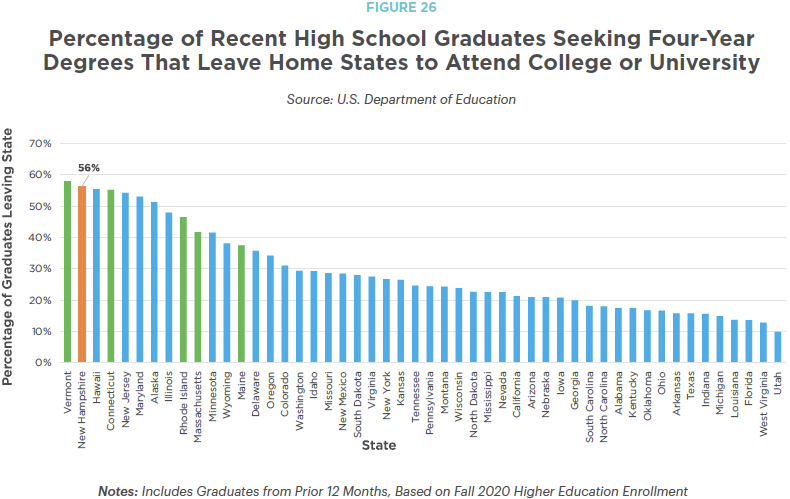
Relative to other states, these low funding levels may contribute to higher education costs for students. New Hampshire students face some of the nation’s highest in-state tuition rates of public four-year universities and colleges with 2024-2025 in-state tuition and fees ranging from more than $14,500 at Keene State College and Plymouth State University to over $19,000 at the University of New Hampshire-Durham.[15] These high costs may contribute to more high school graduates leaving the state for more affordable opportunities. In 2020, the most recently available data, New Hampshire had the nation’s second-highest percentage of recent high school graduates going out of state to attend a four year college or university at 56 percent, second only to Vermont’s 58 percent.[16]
Low state funding for public higher education may also result in increased student loan debt. Data for 2020, which are the most recent available, found graduates from New Hampshire’s colleges and universities who have higher education loan debt carry the highest average debt, at $39,950, compared to all other graduates in the country.[17] Additionally, New Hampshire ranks second for the highest percentage of graduates (70 percent) with student debt.[18] Student debt burden is not equally distributed across racial and ethnic groups. A 2022 national report from the Institute of Education Sciences revealed that Black bachelor’s degree graduates who completed their degrees in 2015 or 2016 and had federal loans owed, on average in 2020, 105 percent of the original amount borrowed through federal loans, with interest costs increasing the total debt amount beyond the original value. In contrast, graduates who were white and not Hispanic or Latino owed approximately 73 percent of the original loan value during the same period. American Indian or Alaska Native graduates owed approximately 87 percent, Asian graduates owed 63 percent, Hispanic or Latino (of any race) graduates owed 84 percent, Native Hawaiian or Other Pacific Islander graduates owed 82 percent, and graduates identifying as two or more races owed 84 percent.[19]
In addition to the individual financial ramifications, academic research suggests that higher student debt is related to a variety of factors that directly and indirectly influence state and local economies. These factors include lower rates of homeownership, more demand on the rental market resulting in increased prices for rent, and poorer health-related decisions that contribute to later health problems.[20]
Post-Secondary Education, Job Training, and Building a Strong Workforce
The Granite State is experiencing a long-predicted workforce shortage that is, in part, related to an aging New Hampshire population and has been further exacerbated by fewer residents who are employed or looking for employment than were prior to the pandemic.[21] Future workforce constraints in key industries could be disproportionately severe due to a lack of qualified job candidates. State projections suggest some of these shortfalls will occur in industries that typically require college degrees.
Four of the ten occupations with the largest projected ten-year growth, and three of the top five, are in fields that require college degrees. These include registered nurses, general and operations managers, accountants and auditors, and software developers. Of the other professions in the top ten, two require some postsecondary credential or training (carpenters and truck drivers), and the remaining positions are in sales and supervisor positions that do not typically require postsecondary training.[22]
As New Hampshire seeks to bolster its economy and expand its workforce pipeline, greater investments in education will be key to helping ensure broad access to opportunity and to building a vibrant and resilient economy. High quality schools can serve as anchor institutions for communities and help attract new families and residents into the state. As New Hampshire’s population grows older, the state’s future economic success will be impacted by its ability to both attract and retain young people and to invest in the individuals and families already in New Hampshire. Expansions of educational opportunities, especially for Granite Staters who currently face difficulty accessing them, can help to build a more enriched and vibrant New Hampshire for everyone.
• • •
This publication and its conclusions are based on independent research and analysis conducted by NHFPI. Please email us at info@nhfpi.org with any inquiries or when using or citing New Hampshire Policy Points in any forthcoming publications.
© New Hampshire Fiscal Policy Institute, 2024.
Endnotes
[1] See the Economic Development Quarterly 2018 article Human Capital and Intergenerational Mobility in U.S. Counties.
[2] See the Proceedings of the National Academy of Sciences 2021 peer-reviewed article, Life expectancy in adulthood is falling for those without a BA degree, but as educational gaps have widened, racial gaps have narrowed. See also the Annual Review of Public Health 2018 article The Relationship Between Education and Health: Reducing Disparities through a Contextual Approach.
[3] See the National Academy of Sciences February 2024 issue brief, Reducing Intergenerational Poverty: Education’s Critical Role in Reducing Intergenerational Poverty and NHFPI’s February 2024 issue brief, Poverty and Food Insecurity in New Hampshire During and Following the COVID-19 Crisis. See also the U.S. Bureau of Labor Statistics published analysis Unemployment Rates for Persons 25 Years and Older by Educational Attainment.
[4] See U.S. Census Bureau, American Community Survey, Educational Attainment, S1501.
[5] See U.S. Census Bureau’s 2022 American Community Survey Table S1501 for New Hampshire.
[6] See the National Center for Education Statistics High School Graduation Rates and U.S. Census Bureau’s 2022 American Community Survey Table S1501 for New Hampshire.
[7] See NHFPI’s November 2023 issue brief, Limited State Funding for Public Higher Education Adds to Workforce Constraints.
[8] See New Hampshire Department of Education’s State Summary Revenue and Expenditures of School Districts 2022-2023 and Valuations, Property Tax Assessments and Tax Rates of School Districts 2022-2023.
[9] See NHFPI’s October 2023 fact sheet, Education in New Hampshire: Fiscal Policies in 2023. See also data showing 2023 taxable property values per capita, published by the New Hampshire Community Development Finance Authority.
[10] See U.S. Census Bureau’s 2022 Public Elementary-Secondary Education Finance Data.
[11] See the University System of New Hampshire’s “Our Institutions” and the Community College System of New Hampshire’s “Locations” pages.
[12] See NHFPI’s November 2023 issue brief, Limited State Funding for Public Higher Education Adds to Workforce Constraints.
[13] See the State Higher Education Executive Officers Association’s State Higher Education Finance report Grapevine 2024 National Table 3.
[14] See State Higher Education Finance Report Figure 3.2.
[15] See Keene State College, Plymouth State University, and University of New Hampshire’s admissions and financial aid and services webpages.
[16] See National Center for Educational Statistics Table 309.30 (Fall 2020).
[17] See The Institute for College Access and Success’ Student Debt and the Class of 2020 (November 2021) Table 3: Percentage of Graduates with Debt and Average Debt of Those with Loans, By State.
[18] See The Institute for College Access and Success’ Student Debt and the Class of 2020 (November 2021) Table 3: Percentage of Graduates with Debt and Average Debt of Those with Loans, By State.
[19] See the Institute of Education Sciences’ 2022 report, Baccalaureate and Beyond (B&B:16/20), p. 19.
[20] See the 2021 peer-reviewed article, Does Student Loan Debt Hinder Community Well-Being? In the International Journal of Community Wellbeing.
[21] See New Hampshire Fiscal Policy Institute’s August 2023 issue brief Granite State Workers and Employers Face Rising Costs and Significant Economic Constraints, under the heading “New Hampshire’s Recovery Slowed by Workforce Constraints.” See the Carsey Institute’s 2012 publication, New Hampshire Demographic Trends in the Twenty-First Century, and the NH Center for Public Policy Studies 2017 archived post, NH Economic Outlook 2018, more information about on-going demographic trends in New Hampshire.
[22] See the New Hampshire Department of Business and Economic Affairs’ State of New Hampshire Workforce Assessment from August 2022, Updated April 2023 (used to determine number of projected job openings), and New Hampshire Employment Security’s New Hampshire Employment Projections by Industry and Occupation: Base Year 2020 to Projected Year 2030 report from January 2022 (used to confirm necessary educational attainment and training for occupations).