This second edition of New Hampshire Policy Points provides an overview of the Granite State and the people who call New Hampshire home. It focuses in on some of the issues that are most important to supporting thriving lives and livelihoods for New Hampshire’s residents. Moreover, the book addresses areas of key policy investments that will help ensure greater well-being for all Granite Staters and a more equitable, inclusive, and prosperous New Hampshire.
New Hampshire Policy Points is intended to provide an informative and accessible resource to policymakers and the general public alike, highlighting areas of key concerns. Touching on some important points but by no means comprehensive, each section within New Hampshire Policy Points includes the most up-to-date information available on each topic area. The facts and figures included within this book provide useful information and references for anyone interested in learning about New Hampshire and contributing to making the Granite State a better place for everyone to call home.
To purchase a print copy or download a free digital PDF of New Hampshire Policy Points, visit nhfpi.org/nhpp

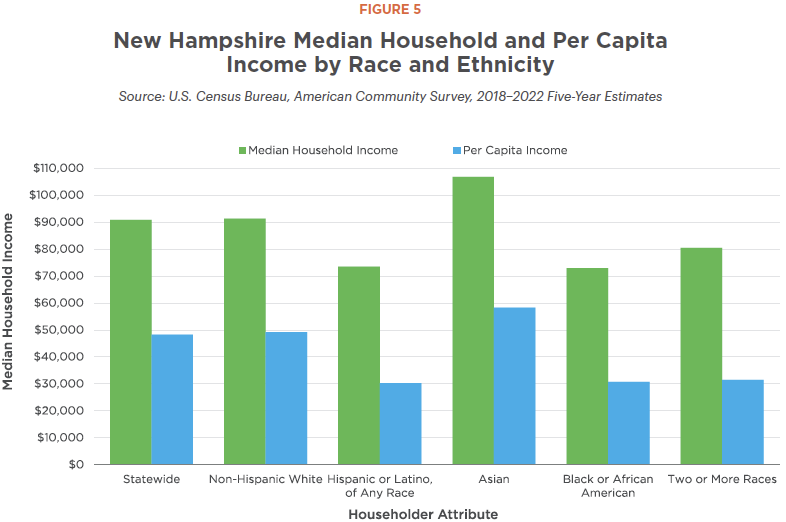
New Hampshire has a relatively high median household income compared to other states. In 2023, the Granite State’s median household income was about $96,838 per year. Median household income, which tracks the middle level of income for all households, provides a valuable but incomplete picture of the economic circumstances facing New Hampshire families, particularly families experiencing financial hardship. In 2023, over one in four Granite State households had less than $50,000 per year in income, and more than one in six had less than $35,000.[1]
In 2023, the median income for New Hampshire families with at least one child under 18 was about $122,319. However, certain Granite Staters populations had considerably lower median incomes, including families headed by single adults, individuals identifying as members of certain racial and ethnic minority groups, women, and people with lower levels of formal education. Households with at least one child under 18 and headed by a single female adult, for example, reported a median annual household income of about $45,086.[2] According to estimates from the U.S. Census Bureau, income inequality grew at a faster rate in New Hampshire from 2010 to 2019, a period that includes the recovery from the Great Recession of 2007-2009, than in the nation overall. This growing inequality suggests Granite Staters with lower or moderate incomes experienced increasing relative hardships during the last economic recovery and beyond. These same Granite Staters will likely have faced continued challenges making ends meet into the following decade. While the economic recovery following the COVID-19 pandemic has been quicker than the Great Recession recovery, it has not been steady among Granite Staters with low incomes.[3]
Poverty
As a state, New Hampshire has a relatively low level of poverty. Based on the official poverty measure, the estimated poverty rate in New Hampshire was 7.2 percent in 2023 – the lowest in the nation.[4] However, for those living in or near poverty, obtaining basic, everyday household needs, such as food, clothing, and medical care, can present a significant challenge. Living in poverty means living below the federal poverty threshold based on income and family size. For households with one adult and no children, the threshold in 2024 was $15,060 per year; for households with two adults and two children, it was $30,200 per year.[5] In 2023, the most recently available data suggest about 98,000 Granite Staters lived below the poverty threshold.[6]
Other measures indicate a higher relative poverty level in New Hampshire. For example, the federal Supplemental Poverty Measure (SPM) factors in financial circumstances beyond those considered in the official poverty rate, including tax liability, tax credits, certain expenses related to employment, out-of-pocket medical costs, and regional adjustments for housing costs. This measure showed that, in 2022, New Hampshire’s SPM poverty rate was higher compared to the comparable official poverty rate, at 9.3 percent compared to 6.6 percent, respectively.[7] This demonstrates the official poverty measure may not fully reflect the relative cost of living for people with very low incomes or with more limited means.
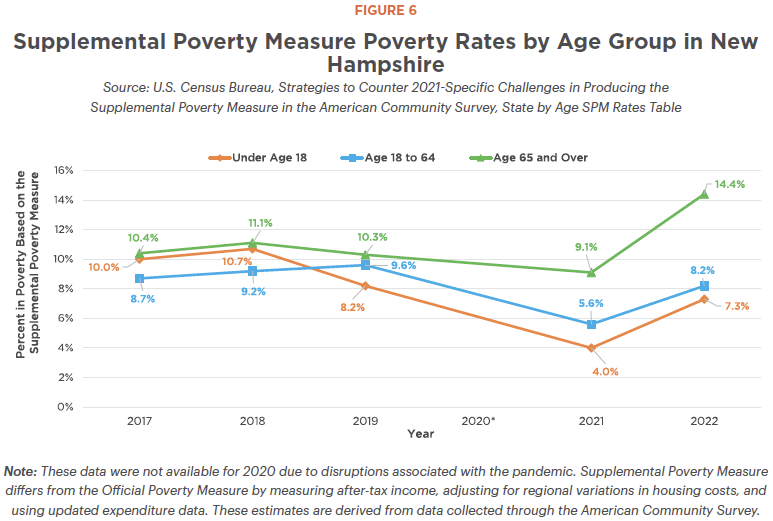
After declining to lower levels in 2021, SPM poverty among both older adults and children increased in 2022. Before that, child poverty in New Hampshire was cut in half between 2019 and 2021. National-level data show the COVID-19 assistance provided by the federal government through the tax code, and thus not captured in the official poverty measure, had a profound impact on SPM poverty, particularly among children, due to targeted policies designed to alleviate hardship for families during the pandemic. Foremost among these was the one-year expansion to the Child Tax Credit, which resulted in larger amounts of aid reaching more households with children.[8] Other financial and policy supports to households, particularly the Economic Impact Payments, also helped temporarily reduce hardship. When these programs largely expired in 2022, SPM poverty rebounded, and rose to higher than pre-pandemic levels for older adults in New Hampshire.[9]
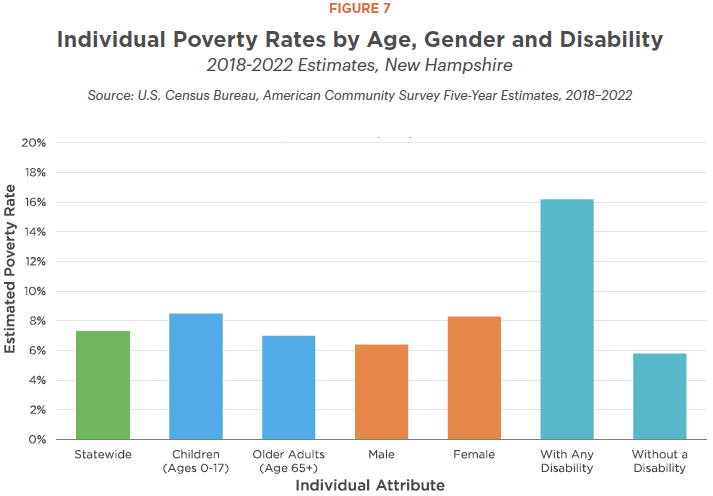
Poverty, by the official poverty measure, is more prevalent among historically marginalized groups of Granite Staters than the population overall. Individuals identifying as certain racial and ethnic minority groups, as well as individuals born outside the United States, experience higher poverty rates. Additionally, single-female-headed households with children have much higher poverty rates. Moreover, in 2023, about 8.0 percent of individuals under the age of 18 lived in poverty, as did 7.6 percent of individuals over age 64. Poverty is also more prevalent among individuals with disabilities and individuals working part-time or not working.[10]
Across New Hampshire, poverty rates also vary by geography. From 2018-2022, the poverty rate in Rockingham County was estimated to be about 4.8 percent, compared to an 11.7 percent poverty rate in Sullivan County. Furthermore, poverty rates within counties and municipalities can vary considerably. Communities with low concentrations of poverty may still have many residents in poverty due to the size of the population. For example, despite its relatively low poverty rate, Rockingham County had more residents in poverty than any New Hampshire county except Hillsborough.[11]

Cost of Living
The cost of living in certain regions provides key context when considering household incomes and challenges faced by those living in or near poverty. As prices for housing and other key costs vary across locations, the level of income families and individuals need to afford basic expenses varies across geographies. Living wage calculators address these differences by estimating the income a family or individual would need to meet basic living costs in a particular location.
The 2024 updates to the Massachusetts Institute of Technology (MIT) Living Wage Calculator estimate that a family with two working adults and one child would need $97,876 annually to afford to live in New Hampshire. For a family with a single adult and two children, however, expenses would total about $111,700, in part due to increased child care costs.[12] Separate calculations from the Economic Policy Institute (EPI) Family Budget Calculator, updated for 2024 and only available by county, estimate that a family of two adults and one child living in Hillsborough County, New Hampshire’s most populous county, would face average yearly expenses of $91,836, which is similar to the MIT estimate for the county. A family consisting of a single adult and two children living in Hillsborough County, based on the EPI Family Budget Calculator, would face average yearly expenses of $105,372.[13]
During the first nine months of 2024, about 30 percent of New Hampshire adults reported paying for usual household expenses during the last seven days had been somewhat or very difficult. This was a smaller percentage than the about 33 percent, or one third, of Granite State adults who had trouble affording household expenses in 2022 and 2023.[14]
Following the start of the pandemic, costs have risen faster than usual for individuals and families. Policy supports helped many families meet these expenses, particularly in 2021, but many temporary policies designed to respond to COVID-19 expired after that year. These expirations left many Granite Staters to face rising costs without additional supports and led to elevated hardships in 2022 and 2023 that, while potentially slowly easing, remain elevated compared to lower poverty rates and levels of difficultly meeting expenses reported in 2021.
• • •
This publication and its conclusions are based on independent research and analysis conducted by NHFPI. Please email us at info@nhfpi.org with any inquiries or when using or citing New Hampshire Policy Points in any forthcoming publications.
© New Hampshire Fiscal Policy Institute, 2024.
Endnotes
[1] See the U.S. Census Bureau, American Community Survey, Income in the Past 12 Months, S1901.
[2] See the U.S. Census Bureau, American Community Survey, Median Income in the Past 12 Months, S1903.
[3] See NHFPI’s 2021 issue brief, Uneven Employment Impacts and Recovery from the COVID-19 Crisis; 2022 issue brief, Key Challenges Facing Granite Staters Amid the COVID-19 Economic Recovery; and 2023 issue brief, Granite State Workers and Employers Face Rising Costs and Significant Economic Constraints.
[4] See the U.S. Census Bureau, American Community Survey, Poverty Status in the Past 12 Months, S1701.
[5] See the U.S. Department of Health and Human Services, 2024 Poverty Guidelines.
[6] See the U.S. Census Bureau, American Community Survey, Income in the Past 12 Months, S1901.
[7] See the U.S. Census Bureau’s June 2023 publication Strategies to Counter 2021-Specific Challenges in Producing the Supplemental Poverty Measure in the American Community Survey and accompanying American Community Survey-derived SPM data tables.
[8] See NHFPI’s March 4, 2022 issue brief, Expansions of the Earned Income Tax Credit and Child Tax Credit in New Hampshire.
[9] See NHFPI’s June 10, 2024 blog, Poverty Among Older Adults Rose Significantly, and Rebounded for Children, in 2022, as well as NHFPI’s September 2023 blog Latest Census Bureau Data Show Median Household Income Fell Behind Inflation, Tax Credit Expirations Increased Poverty and NHFPI’s March 2022 issue brief Expansions of the Earned Income Tax Credit and Child Tax Credit in New Hampshire.
[10] See the U.S. Census Bureau, American Community Survey, Poverty Status in the Past 12 Months, S1701.
[11] See the U.S. Census Bureau, American Community Survey, Poverty Status in the Past 12 Months, S1701.
[12] See the Massachusetts Institute of Technology, Living Wage Calculator, accessed August 2024.
[13] See the Economic Policy Institute, Family Budget Calculator, accessed August 2024.
[14] See the U.S. Census Bureau, Household Pulse Survey. Note: 2023 data includes survey data collected from January through October of that year.