Estimates from the U.S. Census Bureau’s annual American Community Survey provide insights into the economic conditions and resources available to residents of New Hampshire’s counties. Estimates released in December 2020 average responses over the five-year period from 2015 to 2019, which allows for more measurement certainty among smaller population groups and geographies than the annual data.
Income Levels Differ Across Counties
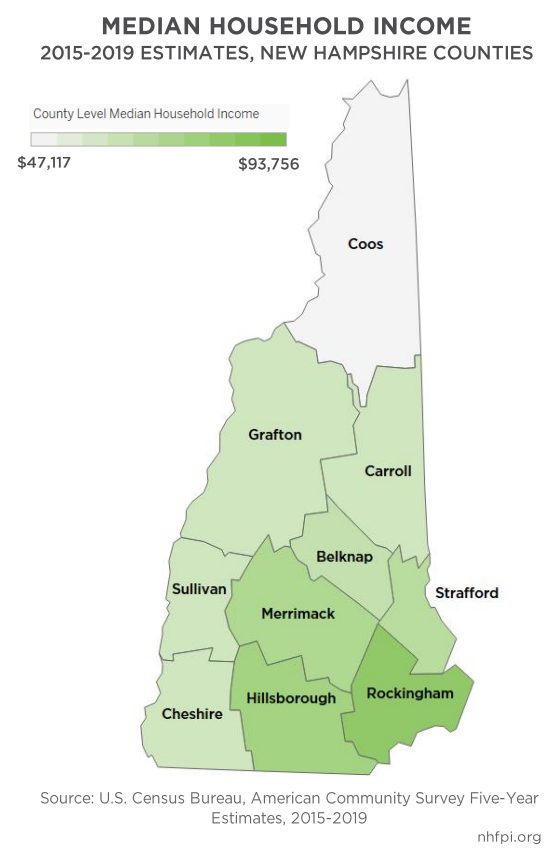
New Hampshire’s estimated median household income during the 2015-2019 period was $76,768. Medians varied between counties, driven in part by distances from the Boston metropolitan area. Rockingham County’s estimated annual median household income for the 2015 to 2019 period was approximately $93,800 in inflation-adjusted 2019 dollars, which was about $12,300 per year greater than the next highest income county, Hillsborough County. Coos County had the lowest estimated median household income during this period at approximately $47,100, which was about $14,200 less than that of Sullivan County, the second lowest county estimate. Coos County’s median household income was only about half of Rockingham County’s level.
Despite limited reliability of survey data for certain sub-state populations, available data permit some comparisons. For groups where reliable data were available, households where the householder identified their ethnicity as Hispanic or Latino, or their race as Black or African American or Two or More Races, had lower median household incomes.
Income Levels Across Counties and Family Composition
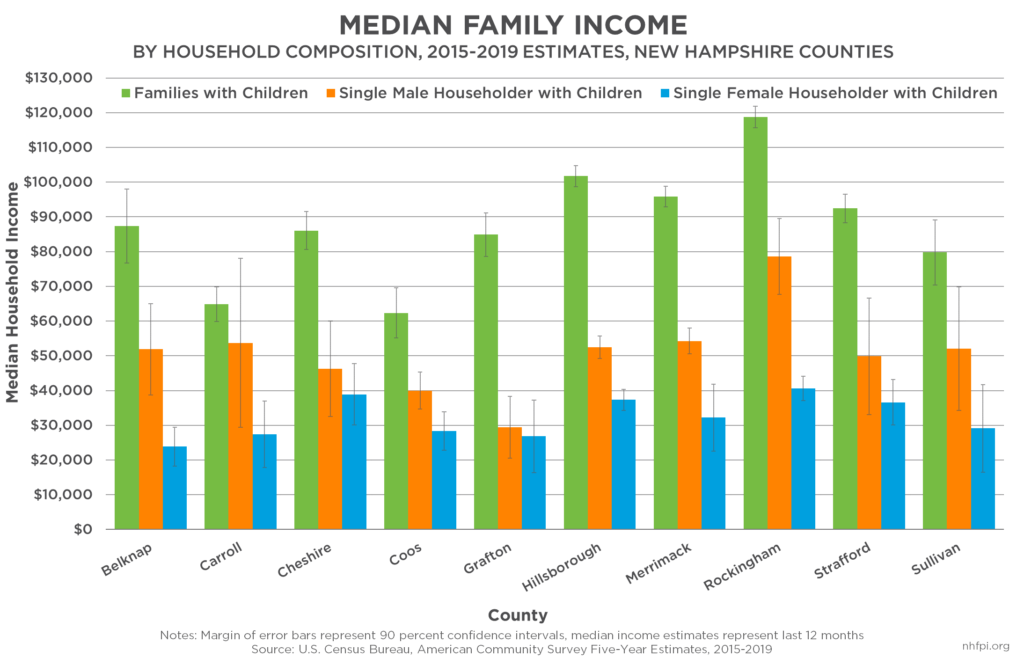
Median incomes of families varied between counties in New Hampshire, and further differed based on family composition within counties. For groups where reliable data are available, family households with children where only one adult without a spouse was present faced lower median household incomes than the incomes of families with two adults present. The midpoint estimates were lowest for families with children with a female householder with no spouse, compared to families where only a single male householder was present or to families that included married couples with children
Poverty Levels Across Counties
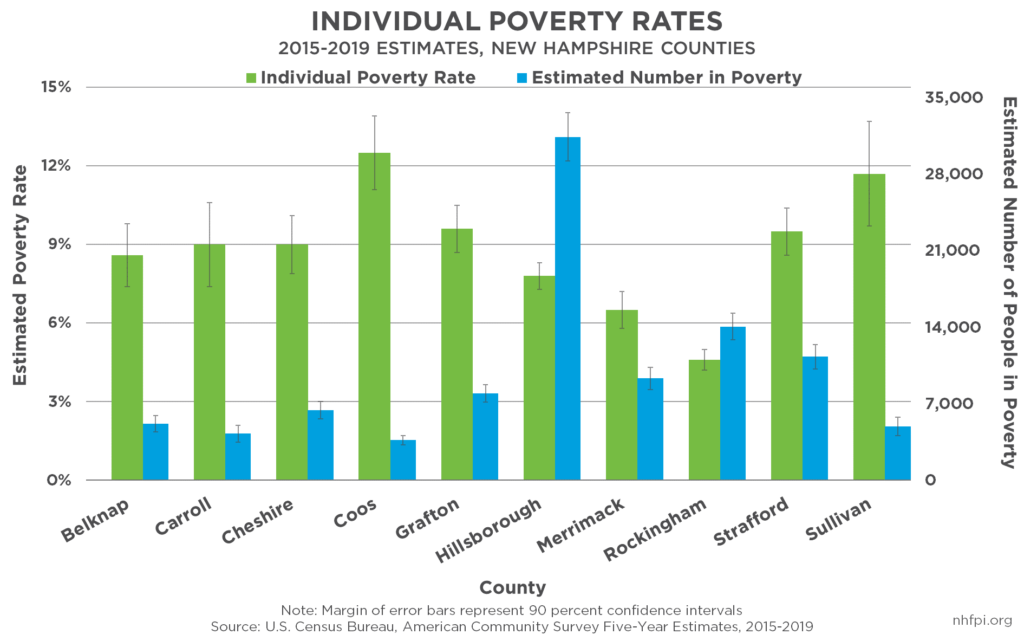
Poverty is defined by the federal government as having an income below a certain level, based on the size and composition of the household. For 2019, the federal poverty thresholds were $13,300 for an individual under age 65, $17,622 for a single adult under 65 with one child, and $25,926 for two adults with two children. Individual poverty rates varied between counties in New Hampshire. Rockingham County had the lowest poverty rate in the state at 4.6 percent. While all other county estimates were statistically indistinguishable from at least one other county estimate, the highest estimated poverty rate was 12.5 percent, in Coos County. Although Rockingham County has the lowest poverty rate in New Hampshire, this county is estimated to be home to the second-largest number of people in poverty, about 14,100, relative to other counties in the state. Hillsborough County was home to an estimated 31,500 people living at or below poverty-level incomes, the highest county-level estimate in the state.
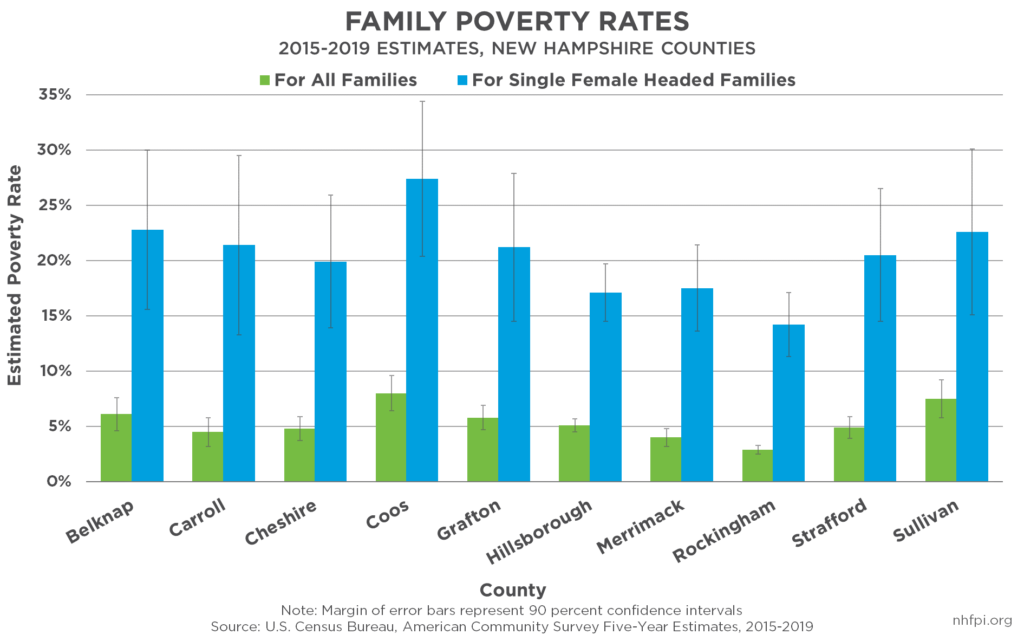
Family poverty levels varied based on composition in a statistically significant fashion across all counties between families headed by single women and the overall family poverty levels.


