During the past decade, New Hampshire has experienced several ongoing trends in terms of its population size and changing demographics. Population growth has been largely influenced by both international and domestic migration, rather than births in the state. While statewide population has increased, particularly during the current decade, counties have experienced population changes differently, with the four southeastern counties experiencing the most growth in terms of the number of new residents.
The state has become more ethnically and racially diverse in recent years. From 2018 to 2022, more individuals identifying as Hispanic or Latino migrated into the state (about 5,811 people) compared to the prior five-year period (about 4,659 people). The vast majority of the state’s residents identified as white and non-Hispanic as of 2023, however, the number of Granite Staters identifying as members of racial and ethnic minority groups in New Hampshire has grown faster, similarly to national trends. The number of Granite Staters identifying as a member of a racial or ethnic minority group increased by about 9.7 percent from 2020 to 2023, compared to the 0.8 percent growth among those identifying as non-Hispanic white.
As of 2023, those aged 65 and older comprised about 20.8 percent of the population in New Hampshire. Despite a large number of young people moving into the state, New Hampshire’s population is aging faster compared to the nation overall. By 2030, the number of adults over age 65 in the state is expected to be larger than the number of children, according to the New Hampshire Department of Business and Economic Affairs.[1]
While the population has grown, the state’s increasing number of older adults has several potential impacts on the workforce. With more residents reaching traditional retirement ages over the coming decade, many may leave the labor force, possibly contributing to workforce shortages and a smaller labor force. A larger number of older adults will likely have additional impacts directly on younger, working-age Granite Staters, who may be more likely to temporarily leave the workforce or reduce their working hours to care for older family members. As Granite Staters continue to age, both health and workforce challenges may be addressed through public policy investments designed to support the state’s changing population.
This Issue Brief examines population changes in recent years, including births and deaths, international and domestic migration, and differences among these factors affecting populations by county. This Issue Brief will also outline demographic changes by race, ethnicity, and age across the state. Additionally, this Brief will identify the implications of a changing population and its impact on the state’s health care services, labor force, and economy.
Population Growth Across the State
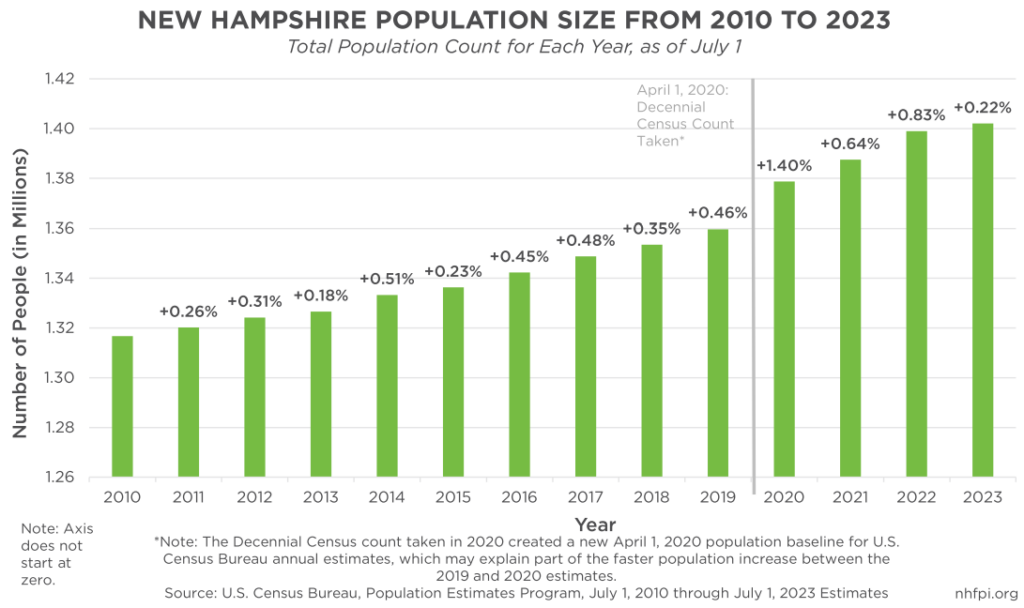
New Hampshire’s population increased each year throughout the past decade. The most recently published U.S. Census Bureau state-level population estimates suggest the state’s population was 1,402,054 people on July 1, 2023, an increase of about 6.5 percent from the estimated population of 1,316,762 on July 1, 2010. While the population continued to increase during this period, growth slowed between 2022 and 2023 (0.2 percent) compared to prior years, with the largest estimated population increase occurring between 2019 and 2020 (1.4 percent), likely in part reflecting clarity provided by new data from the Decennial Census count.[2]
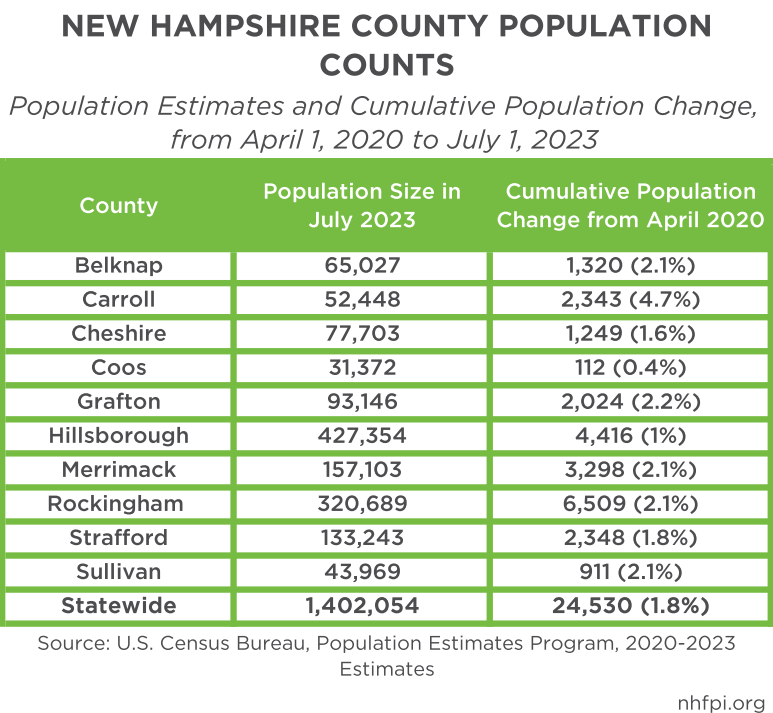
While the state’s population grew by 1.8 percent between April 2020 and July 2023, population changes varied significantly by county. Based on population estimates for 2020 and 2023, Carroll County experienced the fastest rate of population growth among the state’s ten counties at about 4.7 percent. Coos County experienced the lowest population increase during this time, at approximately 0.4 percent, while also remaining the smallest county in 2023 in terms of population size (31,372 people). Although Hillsborough County had the largest population size in 2023 (427,354 people) and was home to about 30.5 percent of the state’s residents, Rockingham County had faster population growth from April 2020 to July 2023. During this period, Hillsborough County gained about 4,416 new residents (1.0 percent growth), while Rockingham County gained about 6,509 (2.1 percent growth). None of the state’s counties experienced a cumulative population loss during the 2020 to 2023 period, however, both Coos County’s and Hillsborough County’s populations slightly decreased from 2022 to 2023.[3]
In addition to changes within counties, New Hampshire has also experienced population changes within its cities and towns. Three of the state’s six largest municipalities experienced population growth from July 2020 to July 2023, including growth rates of 3.1 percent in Rochester, 2.2 percent in Dover, and 1.3 percent in Concord. The other three largest communities experienced slight population declines during this time, with -0.03 percent in Manchester, -0.17 percent in Derry, and -0.21 percent in Nashua.
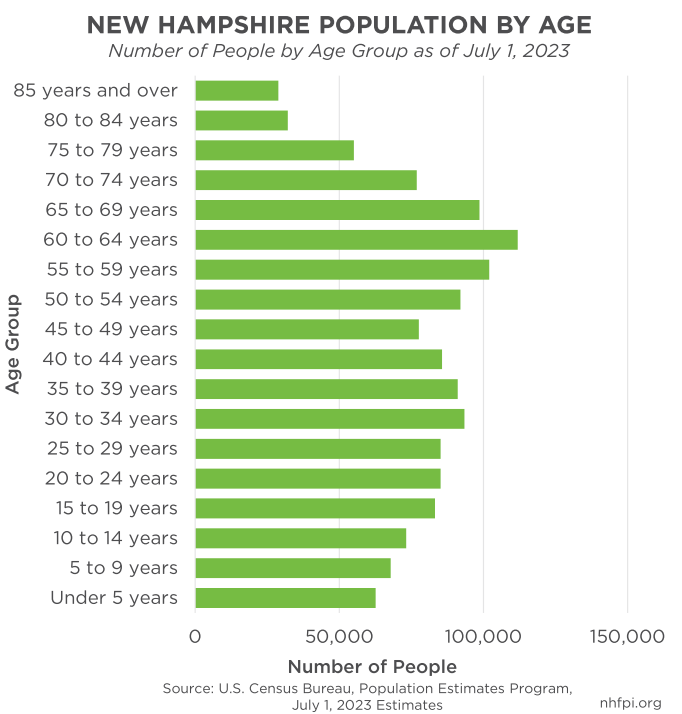
As of July 1, 2023, the median age in New Hampshire was 43.4 years old, making it tied with Vermont as the second oldest state in the United States by median age, behind only Maine (44.8 years). Based on population estimates from July 2023, approximately 20.8 percent of the state’s population was over the age of 65, which was an increase of about 2.0 percentage points from about 18.8 percent of the state’s population in July 2020. In contrast, those under the age of 18 made up about 18.0 percent of the population in 2023, decreasing 0.8 percentage points since 2020. The percentage of children in the state has continued to decline over the past decade, with New Hampshire experiencing the largest percentage reduction in people under age 18 (about 10.5 percent) of any state from 2010 to 2020.[4] While the state’s aging population follows trends seen across the country, New Hampshire’s population is aging faster in comparison. As of 2023, those 65 and older comprised about 17.7 percent of the nation’s population, or an estimated 59,248,361 people, which was up by around 0.9 percentage point from its 2020 estimates of about 54,452,561 people, compared to the 2.0 percentage point increase seen in New Hampshire during that same period.[5] In addition, a large number of Granite State residents will be reaching retirement age over the next decade. In 2023, about 15.3 percent of the state’s population fell between the ages of 55 to 64.
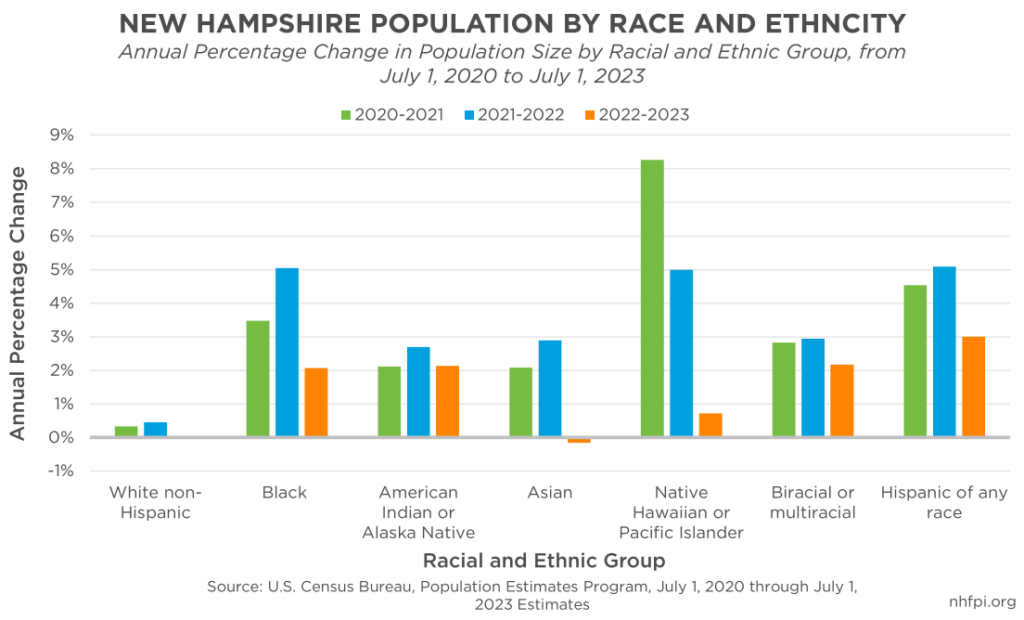
New Hampshire has become increasingly more ethnically and racially diverse over the last three decades.[6] Based on population estimates from July 1, 2023, the majority of the state’s population, 88.5 percent of the total population, identified as white and non-Hispanic. Those identifying as Hispanic or Latino of any race made up 4.8 percent of the population; Asian, 3.1 percent; Black, 2.1 percent; American Indian or Alaska Native, 0.3 percent; Native Hawaiian or Pacific Islander, 0.06 percent; and Biracial or Multiracial, 1.9 percent. While those identifying as a member of a racial or ethnic minority group in New Hampshire made up smaller percentages of the population, the number of individuals identifying as such has increased rapidly since July 2020. Those who identified as Native Hawaiian or Pacific Islander experienced the largest relative percentage increase in population from 2020, at about 14.5 percent growth from 2020 to 2023, with those identifying as Hispanic or Latino of any race experiencing the second largest increase during the three year period, at about 13.2 percent.[7] Children in the state have also become increasingly more diverse. According to the University of New Hampshire, in 2020, 20.2 percent of children identified with a racial or ethnic minority group.[8]
In-Migration Largely Driving Population Growth
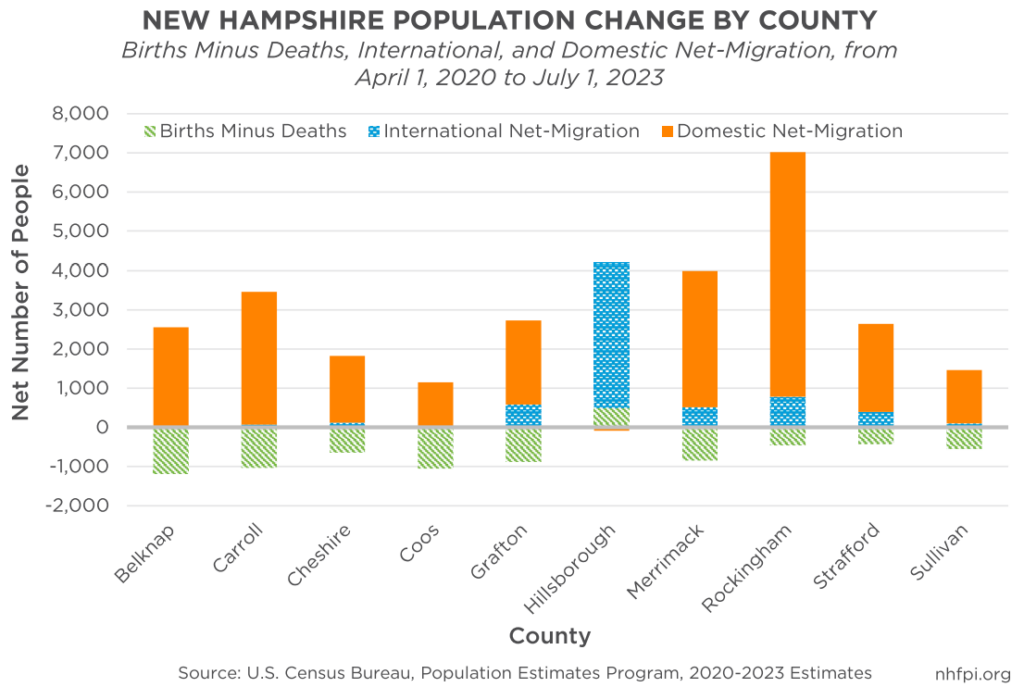
Net migration to New Hampshire was responsible for the entirety of estimated population growth between 2020 and 2023. From April 1, 2020 to July 1, 2023, the state experienced a population change of approximately 24,530 people. During this time period, there were around 39,525 births and 46,128 deaths across the state, contributing to a decrease of about 6,603 people. During that same time period, however, New Hampshire experienced a net population gain of around 30,472 people through migration into the state. An estimated 79.2 percent of the net migration gain was due to migration from other states, while about 20.8 percent was due to international migration. Domestic net-migration into New Hampshire more than doubled from 2020 through 2023 compared to the prior decade. For example, from July 1, 2010 to July 1, 2019, a combined increase of around 9,840 people migrated into the state from other states across the country.[9] Population growth driven by migration into the state is not unique to New Hampshire; from 2020 to 2023, five out of the six New England states experienced more deaths than births among their populations, with Massachusetts being the only New England state to experience more births than deaths.[10]
While domestic and international migration has grown the statewide population, increases due to this migration differed by county. Hillsborough County was the only county to experience a domestic net migration loss from April 1, 2020 to July 1, 2023; however, the county also experienced the largest international net increase during this time, and was the only county to have more births than deaths among its residents. Rockingham County and Merrimack County, two other populous southeastern counties, experienced the largest net increase in terms of the number of people migrating into the state during this time, while Coos County and Sullivan County experienced the smallest.[11]
State and Countries of Origin
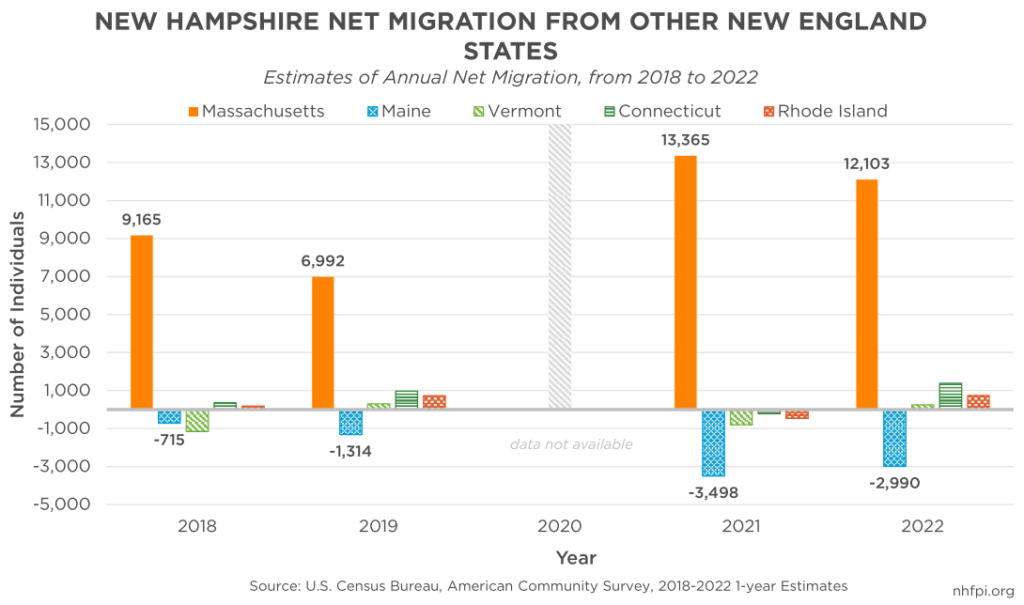
In-migration from other New England states, particularly Massachusetts, has largely driven increases in domestic migration since 2018. In 2021 and 2022 combined, New Hampshire’s population grew by about 25,468 people due to net migration from neighboring Massachusetts, with approximately 48,357 people entering New Hampshire from Massachusetts and about 22,889 leaving the Granite State for its neighbor to the south. Net migration from Massachusetts increased substantially in 2021 and 2022 compared to the net migration of about 16,157 in 2018 and 2019 combined. In 2021 and 2022, New Hampshire also experienced net increases from Connecticut and Rhode Island, by an estimated 1,158 and 278 people, respectively. While net migration numbers fluctuated from 2018 to 2022, Maine was the only New England state that had positive net migration from New Hampshire. In 2021 and 2022 combined, New Hampshire experienced a net loss of about 6,488 people to Maine, an increase from a net loss of about 2,029 people in 2018 and 2019 combined.[12] The increasing number migrating to Maine may be driven largely by lower housing costs and changing preferences due to remote
work.[13]
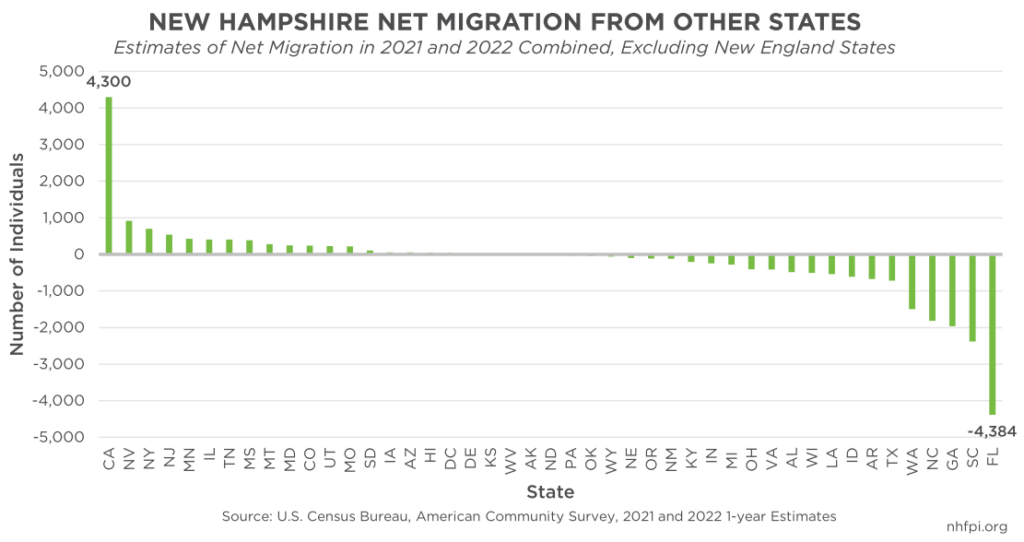
New Hampshire has also experienced net migration from states in other regions of the country. In-migration growth from non-New England states was largely driven by California, the most populous state in the country, which produced a positive net population change in New Hampshire of about 4,300 people in 2021 and 2022 combined.[14] Net growth from the Mid-Atlantic region during these years was also significant, with New Hampshire gaining a combined net increase of about 1,241 people from New York and New Jersey and experiencing a net loss of approximately 34 people to Pennsylvania. While New Hampshire has experienced population growth from other areas of the country, the state has lost a large number of people to the South Atlantic region of the United States. In 2021 and 2022 combined, the state experienced its largest net loss of about 4,384 people to Florida; New Hampshire also lost a net of around 2,386 people to South Carolina, 1,960 to Georgia, and 1,815 to North Carolina.[15] A portion of net losses to the South Atlantic region may be driven by retirees who move south due to lower costs of living, warmer weather, and preferred amenities.[16]
Based on data collected from 2018 to 2022, the largest percentage of people migrating internationally into New Hampshire were from India, comprising about 26.0 percent of international migration during this period. International migration into the state was also high among those migrating from the Dominican Republic (9.9 percent), United Kingdom (7.7 percent), Honduras (5.8 percent), Caribbean and North America (5.6 percent), Nepal (4.9 percent), and Eastern Europe (4.3 percent). While migration from these countries and regions has risen since the 2013 to 2017 period, migration from other countries with historically larger in-migration numbers, such as Canada, has been on a decline. From 2018 to 2022, those migrating from Canada comprised about 2.1 percent of the total number of individuals migrating into the state from other countries, which was a decline from the approximate 7.0 percent during 2013 to 2017.[17]
In-Migration's Impact on Changing Demographics
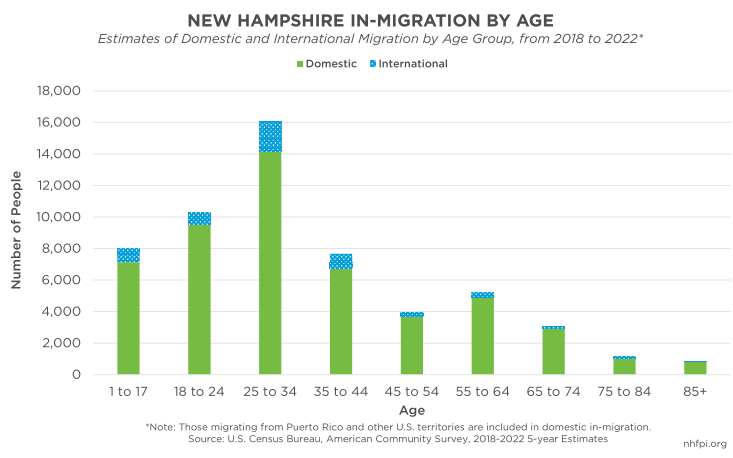
Although New Hampshire’s population is aging overall, a large number of younger people have moved to the state in recent years. From 2018 to 2022, working age adults comprised about 76.8 percent of the combined total number of individuals who migrated into the state, both domestically and internationally. Among the percentage of those migrating into the state, about 23.8 percent were between the ages of 18 and 24, about 37.2 percent between 25 and 34, and about 17.8 percent between 35 and 44. In these data, the number of young people migrating into the state includes college students, which may explain the large percentage among those aged 18 to 24.[18] The number of children aged one to 17 who migrated into the state also outpaced older adults aged 65 and over who migrated, at about 7,986 children compared to about 5,045 older adults. Despite the large numbers of young people moving into the state, these figures only include migration into the state, not net migration.[19]
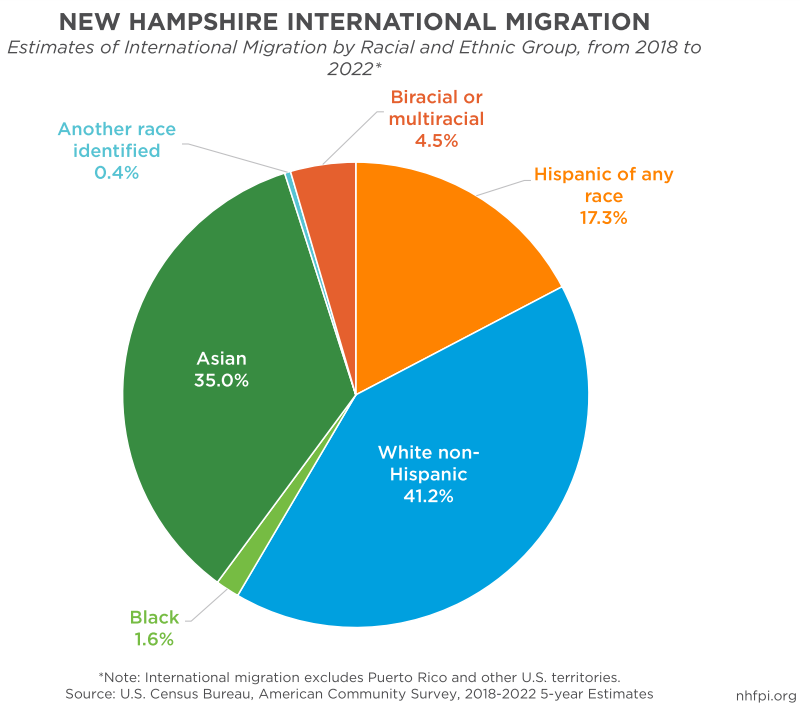
In-migration is also likely contributing to increases in New Hampshire’s ethnically and racially diverse population. While people identifying as non-Hispanic white comprise the largest racial group migrating into the state, there has been an influx of racial and ethnic minority groups in recent years, especially among international migrants. Based on U.S. Census Bureau data collected from 2018 to 2022, approximately 35.0 percent of New Hampshire’s international migrants identified as Asian; this was an increase from the 2013 to 2017 data collection period when those identifying as Asian made up about 24.5 percent of international migrants. Additionally, around 17.3 percent of international migrants identified as Hispanic or Latino of any race, which was an increase from about 12.4 percent during the 2013-2017 period. As in-migration primarily drives population growth, the state will likely continue to become more ethnically and racially diverse in the future.[20]
Implications of an Aging Population for the Workforce
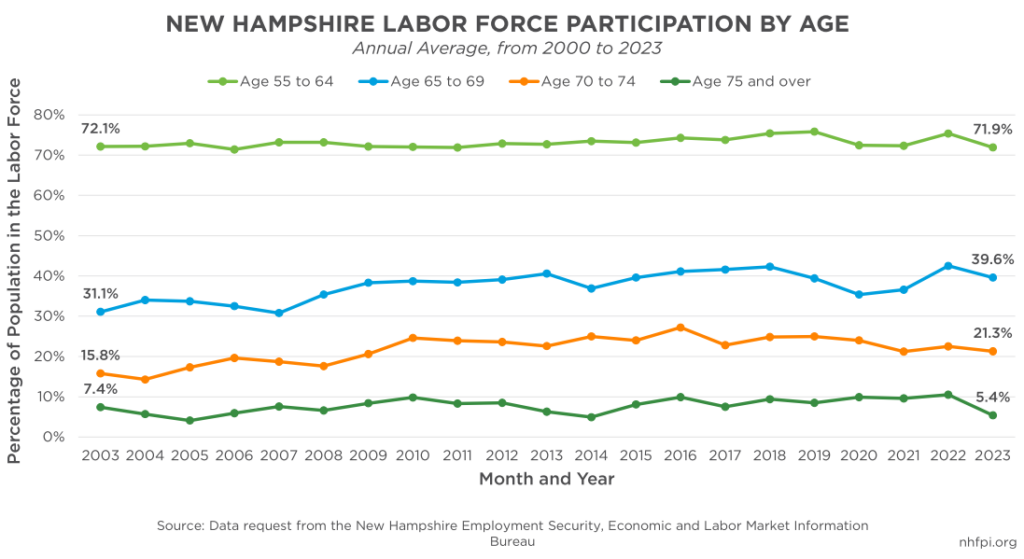
The aging population has significant implications for the state’s workforce and larger economy, as more working-age adults will be reaching retirement age over the next decade. According to the New Hampshire Employment Security, those age 55 and older comprised about 30 percent of the state’s workforce as of April 2024, with about 21 percent falling between the ages of 55 to 64.[21] Although the percentage of those age 55 and older who participated in the labor force has fluctuated each year, a larger percentage of those aged 55 to 64 were in the state’s labor force in 2019, just before the start of the COVID-19 pandemic. All age groups 55 and older experienced increases in labor force participation in 2022, before declining in 2023. Workforce participation declined among all age groups during this time period, except those ages 20 to 34; however, the 2022 rebounds were larger, in percentage terms, for older adults.[22] While the working-age population percentage is similar nationwide and in neighboring New England states, New Hampshire has a larger percentage reaching traditional retirement age in the coming two decades; as of July 2023, residents aged 45 to 64 made up about 24.6 percent of the population nationally, 25.6 percent in Massachusetts, 26.0 percent in Vermont, 26.7 percent in Maine, and 27.4 in New Hampshire.
In addition to the large percentage of the state’s workforce reaching traditional retirement age, New Hampshire’s working-age population, or those falling between the ages of 18 through 64, has been declining in recent years. The working-age population made up about 61.2 percent of the population as of July 1, 2023, a decline of around 0.2 percentage points from April 1, 2020 numbers. Declines in the working-age population may contribute to the recent reduction in the size of the state’s workforce in 2023.[23] According to New Hampshire Employment Security, the total population’s participation in the state’s labor force declined from about 71.5 percent in 2003 to about 64.4 percent in 2023. As the population continues to age, the size of the workforce may continue to decrease.
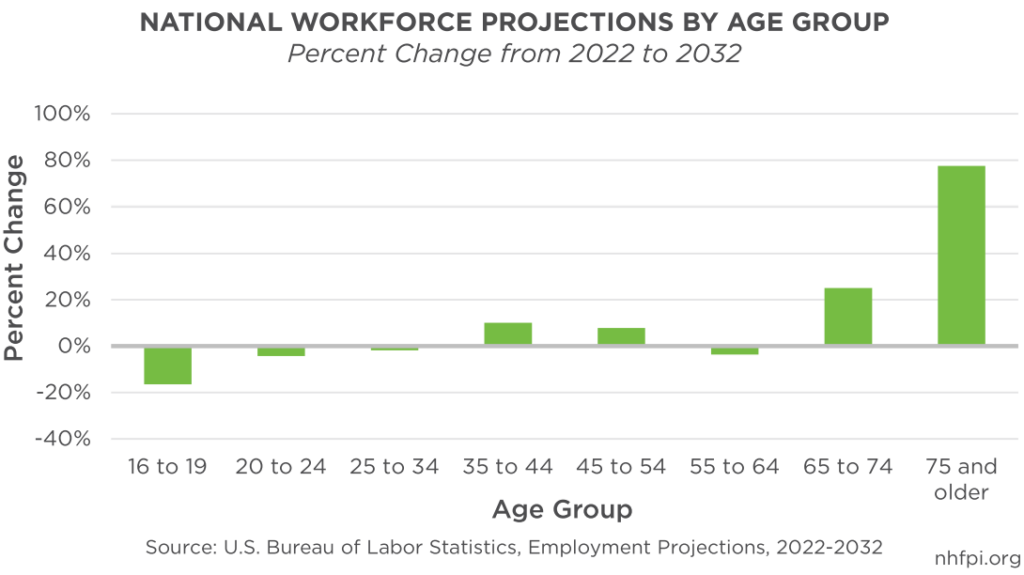
While many older adults may be leaving the workforce, an increasing number have chosen to delay retirement in recent years. According to a nationwide analysis from the Federal Reserve Bank of Minneapolis, the percentage of those who were retired by aged 65 had declined from about 58 percent in 2000 by more than half as of 2022.[24] With more individuals delaying retirement, the number of older adults in the workforce is expected to grow more rapidly compared to other age groups. Based on employment projections from the U.S. Bureau of Labor Statistics, the number of older adults in the workforce across the country is expected to grow rapidly between 2022 and 2032, with those aged 75 and older experiencing the largest percentage increase of about 77.5 percent. Comparatively, those aged 16 to 34, as well as residents aged 55 to 64, will experience workforce participation declines.[25] Projected declines in workforce participation among youth is likely due to more attending higher education full time, as well as increased competition among entry-level jobs commonly held by young adults.[26]
Prolonging retirement, especially among older adults who work physically strenuous jobs, may have further implications for long-term health and wellbeing. According to a 2023 report from the Economic Policy Institute that analyzed 2018 survey data from the RAND Corporation, about 50.3 percent of workers aged 50 to 70 were required to regularly complete physically demanding tasks as part of their job, including transporting heavy loads, lifting people, and working in fatiguing or painful positions.[27] Key research suggests regularly performing physically strenuous activity in one’s job increases the risk of health conditions and early mortality, and workers earning low incomes are more likely to work jobs that require physical labor.[28]
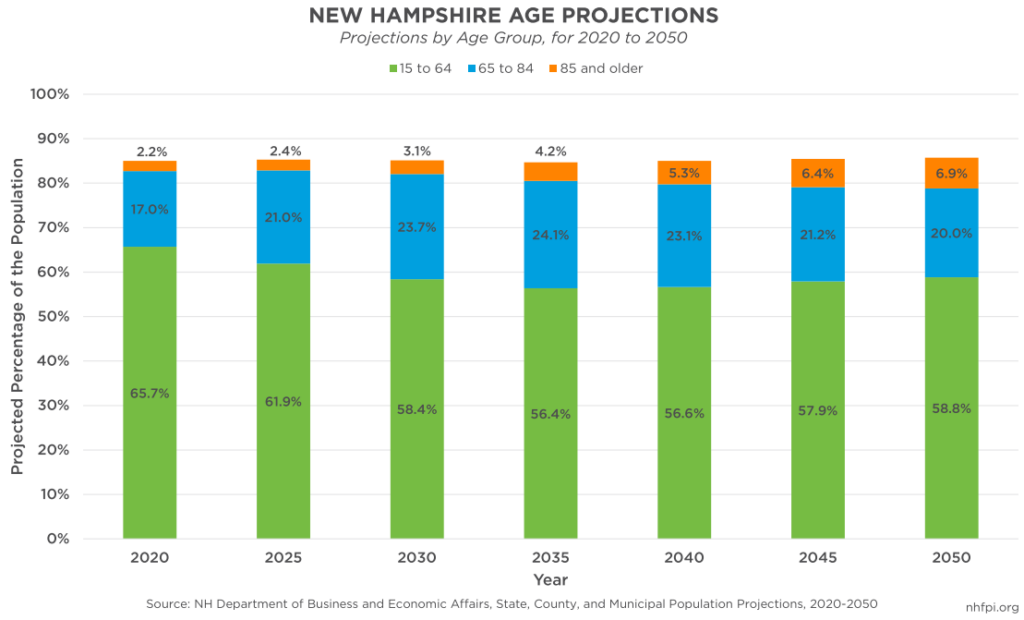
According to projections published by the New Hampshire Department of Business and Economic Affairs, the percentage of the population aged 15 through 64 is expected to continue to steadily decline until 2035; this population will begin to increase as a percent of the total starting in 2040. Moreover, working-age adults are expected to comprise a smaller percentage of the population in 2050 relative to 2020, at about 58.8 percent compared to 65.7 percent. Additionally, while the working-age population is expected to decrease, the percentage of the population over the age of 65 is expected to continue to increase from 2020 to 2050.[29]
The state’s aging population may also impact workforce participation rates among individuals from younger generations who may stay home to care for older family members. Based on data from AARP, about 168,000 adults, or approximately 12.1 percent of New Hampshire’s population, were caring for an older relative in 2021.[30] In addition, according to survey results from the U.S. Census Bureau, an average of about 4,606 individuals (1.3 percent) not in the state’s labor force reported they were caring for an older adult between June 2023 and June 2024.[31] An aging population may also have implications for multigenerational households, especially among those caring for both an older relative and children, as well as households where a grandparent serves as a legal guardian. According to the U.S. Census Bureau, as of 2022, about 2.8 percent of grandparents in the state were living in the same household as their grandchildren; however, slightly less than one in three of the 2.8 percent were responsible for the care of their grandchildren.[32] While the number of multigenerational households in the state has remained similar during the 2018 to 2022 period, this percentage may grow as more of the population ages.
In addition to its impact on the workforce, the state’s aging population will also likely have implications for the health caresystem, as older adults are more likely to experience a disability compared to other age groups. According to 2022 U.S. Census Bureau data, about 21.4 percent of older adults aged 65 to 74, and 42.8 percent of adults aged 75 or older, in the state experienced at least one disability. Those aged 65 and older experiencing a disability during this period were most likely to have an ambulatory or mobility difficulty, followed by a hearing difficulty.[33] Due to needs among older adults, an aging population will likely increase the demand for healthcare services, as well as increase pressure on an already strained health care workforce.
Concluding Discussions
New Hampshire’s population demographic trends provide insights into how the aging population may impact future economic landscapes and reveal how the state’s population growth is primarily driven by in-migration. Through demographic data, state and local officials may advance their understandings of future needs regarding the workforce, infrastructure, and health care system, among other areas.
An aging population will likely have several key impacts on the state’s workforce and larger economy. With more residents reaching traditional retirement ages, the state’s labor force will likely continue to decline. Additionally, if an increasing number of older adults choose to delay retirement, continuing to work may impact their health and wellbeing, particularly among those aged 75 or older who are the most likely to experience a disability.
The aging population will also have implications for younger individuals who may choose to stay out of the workforce or reduce their hours at work to care for older relatives. Changes within multigenerational households also impact infrastructure and housing demands, as more older adults may be seeking to live with their families as they age. According to the U.S. Census Bureau, about 10.1 percent of Granite Staters age 65 and older experienced difficulties with living independently in 2022.[34] As more older adults may choose to remain at home and require care, an increased burden may be placed on family caregivers to fill gaps in the home-health care workforce.[35]
Both international and domestic migration into the state have driven recent population growth. Younger people moving to the state in recent years have the potential to help offset the aging population’s impact on the workforce. In addition, the state’s changing demographics will likely produce a more ethnically and racially diverse workforce, which emphasizes the importance of helping ensure key systems are structurally equitable and meet the needs of a changing population. Despite influxes, people moving into the state may experience difficulty securing housing due to high demand, high costs, and relatively low availability.[36] Moreover, barriers to accessing child care may prevent young people from entering the workforce or deter families from moving to the state entirely.[37] Continued investments may be needed to help ensure a stable population that is able to continue growing, and to help create a thriving economy for all Granite Staters.
Note: Country-by-country international migration figures were updated on September 20, 2024 to exclude data from Puerto Rico, which had been inadvertently included.
Endnotes
[1] See the NH Department of Business and Economic Affairs’ September 2022 report, State, County, and Municipal Population Projections: 2020-2050.
[2] See the U.S. Census Bureau’s Population Estimates Tables, State Population Totals: 2010-2019 and State Population Totals: 2020-2023. Note: The Decennial Census count taken in 2020 created a new April 1, 2020 population baseline for U.S. Census Bureau annual estimates, which may explain part of the faster population increase between the 2019 and 2020 estimates.
[3] See the U.S. Census Bureau’s Population Estimates Tables, County Population Totals: 2020-2023.
[4] See NHFPI’s March 4, 2022 presentation on the economy, The New Hampshire Economy in 2021 and 2022.
[5] See the U.S. Census Bureau’s Population Estimates Tables, State Population by Characteristics: 2020-2023, Median Age and Age by Sex.
[6] See NHFPI’s January 19, 2022 presentation on the state’s economy, New Hampshire Local Economy Indicators.
[7] See the U.S. Census Bureau’s Population Estimates Tables, State Population by Characteristics: 2020-2023, Sex, Race, and Hispanic Origin. Note: The U.S. Census Bureau defines race and ethnicity separately, using 1997 standards from the U.S. Office of Management and Budget. For ethnicity, “Hispanic or Latino” is defined as “a person of Cuban, Mexican, Puerto Rican, South or Central American, or other Spanish culture or origin regardless of race.”
[8] See the University of New Hampshire’s September 1, 2021 report, New Hampshire is Becoming More Diverse, with Children at the Forefront.
[9] See the U.S. Census Bureau’s Population Estimates Tables, State Population Components of Change: 2010-2019 and State Population Components of Change: 2020-2023. Note: In-migration data varies between the U.S. Census Bureau’s Population Estimates Program (PEP) and American Community Survey (ACS), due to different surveying timelines and populations. The Internal Revenue Service (IRS) also provides in-migration data, however, this data can be incomplete as not every Granite Stater files taxes. Based on IRS estimates, New Hampshire experienced a total net migration of 6,368 tax filers from 2021-2022, with a positive domestic net of 6,412 and negative international net of 44 tax filers.
[10] See the NHFPI’s December 21, 2023 data byte, Maine Population Growth Outpaces New Hampshire, Both States Attract Migrants and Have More Deaths Than Births.
[11] See the U.S. Census Bureau’s Population Estimates Tables, County Population Components of Change: 2020-2023.
[12] See the U.S. Census Bureau’s American Community Survey, State-to-State Migration Flows, 2018, 2019, 2021, and 2022.
[13] See NHFPI’s May 17, 2024 blog for a comparison between New Hampshire and Maine’s housing prices, Housing in New Hampshire Continues to Become Less Affordable for Buyers and Renters. See the U.S. Census Bureau’s May 16, 2024 article, More exurban communities now among nation’s fastest growing places.
[14] See the U.S. Census Bureau’s Population Table.
[15] See the U.S. Census Bureau’s American Community Survey, State-to-State Migration Flows, 2021 and 2022. Note: Regions of the U.S. are taken from the Census Bureau’s Regions and Divisions of the United States map.
[16] See the Center on Budget and Policy Priorities’ August 9, 2023 report, State Taxes Have a Minimal Impact on People’s Interstate Moves.
[17] See the U.S. Census Bureau’s Microdata Access Tool, 5-year Estimates for 2017 and 2022. Data was assessed using multiple variables: mobility status and migration. Note: According to the U.S. Census Bureau’s country groupings, “Caribbean and North America” includes Bahamas, Barbados, Dominica, Grenda, St. Vincent and the Grenadines, Trinidad and Tobago, West Indies, Other Caribbean, and Other Northern America. This group also includes the Dominican Republic, Cuba, Haiti, Jamaica, and Canada, but each were displayed as individual countries in the Microdata Access Tool. “Eastern Europe” includes Albania, Belarus, Bosnia and Herzegovina, Bulgaria, Croatia, Czechoslovakia (including Czech Republic and Slovakia), Hungary, Latvia, Lithuania, Moldova, North Macedonia, Poland, Romania, Serbia, and Other Eastern Europe. This group also includes Ukraine and Russia, but both were displayed as individual countries in the Microdata Access Tool. Country-by-country international migration figures were updated on September 20, 2024 to exclude data from Puerto Rico, which had been inadvertently included in the denominator.
[18] See the U.S. Census Bureau’s 2020 pamphlet on college students, Counting College Students.
[19] See the U.S. Census Bureau’s Microdata Access Tool, 5-year Estimates for 2022. Data was assessed using multiple variables: mobility status, migration, and age recode by group.
[20] See the U.S. Census Bureau’s Microdata Access Tool, 5-year Estimates for 2022. Data was assessed using multiple variables: mobility status, migration, race, and Hispanic origin.
[21] See NHFPI’s May 22, 2024 presentation on the state’s workforce, Composition of New Hampshire’s Labor Force by Age.
[22] Data was provided through a data request from the New Hampshire Employment Security’s Economic and Labor Market Information Bureau.
[23] See NHFPI’s August 31, 2023 Issue Brief, Granite State Workers and Employers Face Rising Costs and Significant Economic Constraints. See also NHFPI’s March 28, 2024 DataByte, New Hampshire’s Labor Force Did Not Grow in 2023.
[24] See the Federal Reserve Bank of Minneapolis’s February 27, 2023 article, Who’s not working? Understanding the U.S. aging workforce.
[25] See the U.S. Bureau of Labor Statistics’ Employment Projections for 2002-2032, last modified September 6, 2023.
[26] See the Brooking’s Institute’s 2014 report, Labor Force Participation: Recent Developments and Future Prospects.
[27] See the Economic Policy Institute’s May 17, 2023 report, Many older workers have difficult jobs that put them at risk.
[28] See the U.S. Centers for Disease Control and Prevention’s January 9, 2024 article, Is occupational physical activity harmful to health? See the Brooking’s Institute’s November 2019 report, Meet the Low-Wage Workforce, page 11.
[29] See the New Hampshire Department of Business and Economic Affairs’ September 2022 report, State, County, and Municipal Population Projections: 2020-2050, page 52.
[30] See AARP’s March 2023 report, Valuing the Invaluable: Strengthening Supports for Family Caregivers, page 26.
[31] See the U.S Census Bureau’s Household Pulse Survey Data Tables.
[32] See the U.S. Census Bureau’s American Community Survey, Households with Grandparents Living with Own Children, Table B10063.
[33] See the U.S. Census Bureau’s American Community Survey, Disability Characteristics, Table S1810.
[34] See the U.S. Census Bureau’s American Community Survey, Disability Characteristics, Table S1810.
[35] See NHFPI’s June 10, 2024 interactive, New Hampshire Health Care Employment Projections for 2022 to 2032.
[36] For more data about housing prices and inventory in New Hampshire, see NHFPI’s May 17, 2024 blog, Housing in New Hampshire Continues to Become Less Affordable for Buyers and Renters.
[37] See NHFPI’s May 17, 2024 Issue Brief, The Fragile Economics of the Child Care Sector.