
New Hampshire has experienced a relatively robust economy in recent years. Growth has returned to rates similar to those from before the Great Recession, and the unemployment rate has remained below three percent since late 2015. Incomes appear to have increased for workers, with many middle- and low-income workers finally returning to near pre-Recession levels of income. However, job creation has been strongest in industries with wages below statewide averages and has been uneven in different regions of the state, while both housing and workforce constraints are likely limiting economic growth.
The New Hampshire economy is greatly influenced by the national economy, including federal policy decisions, as well as the operations of businesses within the state and state policy decisions. New Hampshire’s economy has benefited from economic expansion around metropolitan Boston, as indicators of economic health are most favorable in the southeastern part of the state. New Hampshire’s growth has been somewhat slower than the overall growth of the national economy, but has been more favorable than the rest of New England’s economy overall in recent years. Growth in certain industries, including insurance and real estate, has helped push economic growth in New Hampshire higher after several years of underperformance during the economic recovery from the Recession.
Several metrics also indicate income for workers has grown in the last two to three years. This trend is particularly welcome for low- and moderate-income workers, who saw their incomes stagnate during most of the long, slow economic recovery and appear to have only reached pre-Recession income and wage levels again recently. Additionally, while thousands of jobs that were lost in the years since the Recession were in manufacturing, which has relatively high average wages, many of the jobs that have been added during the recovery have been in employment sectors with lower average wages.
Slower hiring due to workforce constraints is likely slowing the state economy, and aging demographics paired with limited housing availability restrict the state’s ability to add to the workforce quickly. Some areas of the state have also lost jobs and labor force participants, and residents have significantly lower median incomes. Additionally, while the most recent data suggest the statewide poverty rate has declined back to pre-Recession levels, approximately a quarter of a million people statewide remained within twice the federal poverty income threshold in New Hampshire, indicating many Granite Staters continue to struggle.
The New Hampshire economy is strong and growing, yet there are challenges to economic growth and to improving livelihoods for all the state’s residents. This Issue Brief explores New Hampshire’s overall economic output, areas of employment growth since the Recession, changes in income for workers and poverty rates, indicators of workforce constraints, and county-level data.
Statewide Economic Growth Since the Recession
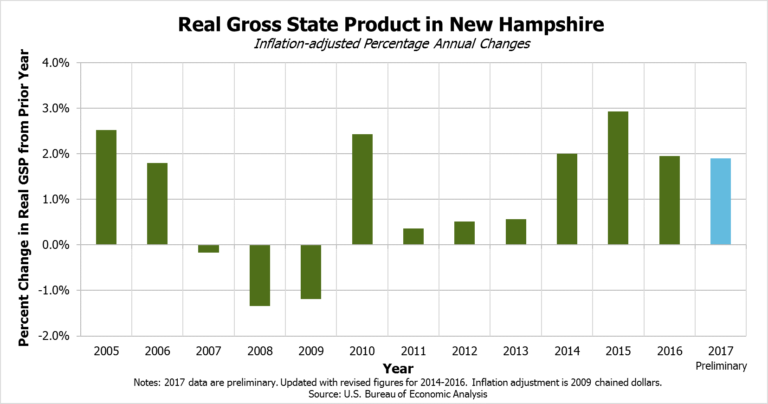
New Hampshire’s economy grew slowly in the years following the Great Recession of 2007 to 2009, but growth resumed at a faster pace starting in 2014. Real gross state product, which is the inflation-adjusted value of goods and services produced by labor and property within New Hampshire, declined during the Recession, which began slightly earlier in New Hampshire than the nation overall.[1] After real gross state product contracted for three years, the economy appeared to pick up some of the slack generated by the Recession during 2010, due in part to federal fiscal stimulus.[2] However, real gross state product grew slowly from 2011 to 2013. Growth increased again in both 2014 and 2015 before falling back to a somewhat slower but healthy pace, based on preliminary estimates for 2017.
The 2017 growth estimates, which are subject to revision, put New Hampshire at about the middle of the pack among the states, with economic growth slightly behind real gross domestic product increases for the United States as a whole. Should the 2017 numbers not be revised significantly, New Hampshire would be about where it was in 2014 relative to the rest of the nation, as the state performed slightly better than overall economic growth nationwide in 2015 and 2016. New Hampshire’s growth slightly outpaced every other New England state in 2014, but was exceeded by Massachusetts in 2015 and 2017 preliminary data, and matched by Maine in 2016.[3]
Long-term trends in the size of the economy relative to 2006 show that New Hampshire lagged behind both the United States and the rest of New England for several years following the Recession, with New England as a whole growing more slowly than the United States. The especially slow growth in New Hampshire from 2011 through 2013 contributed to the state falling behind the rest of New England relative to 2006, but the economic growth from 2014 to 2016 enabled New Hampshire to catch up. Estimates for 2016 and 2017 show New Hampshire growing faster than the rest of New England, but still behind the United States overall relative to 2006.
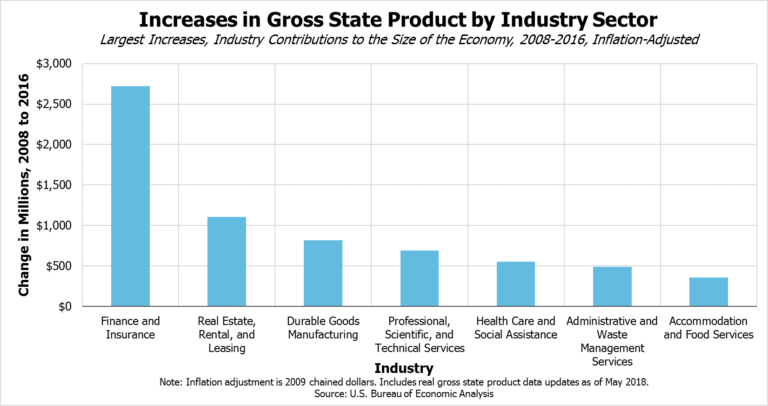
The industry that grew the most between 2008 and 2016, as measured by its dollar-value contribution to real gross state product, was the finance and insurance industry. Driven primarily by growth from insurance carriers and related activities, overall output in this sector increased by approximately 85 percent between 2008 and 2016, or an over $2.7 billion increase out of a total state economy estimated to be $69.2 billion in 2016 (in inflation-adjusted 2009 dollars). Real estate, rental, and leasing was the next largest area of growth, driven mostly by real estate, followed by durable goods manufacturing, whose primary contributor was computer and electronic products manufacturing. Professional, scientific, and technical services, health care and social assistance, administrative and waste management services, and accommodation and food services rounded out the top seven growth sectors by dollar-value increase between 2008 and 2016.[4]
Income for Workers
Overall economic growth does not necessarily translate into additional income for all people, and some measures suggest the overall economy has reached pre-Recession levels of prosperity only recently.
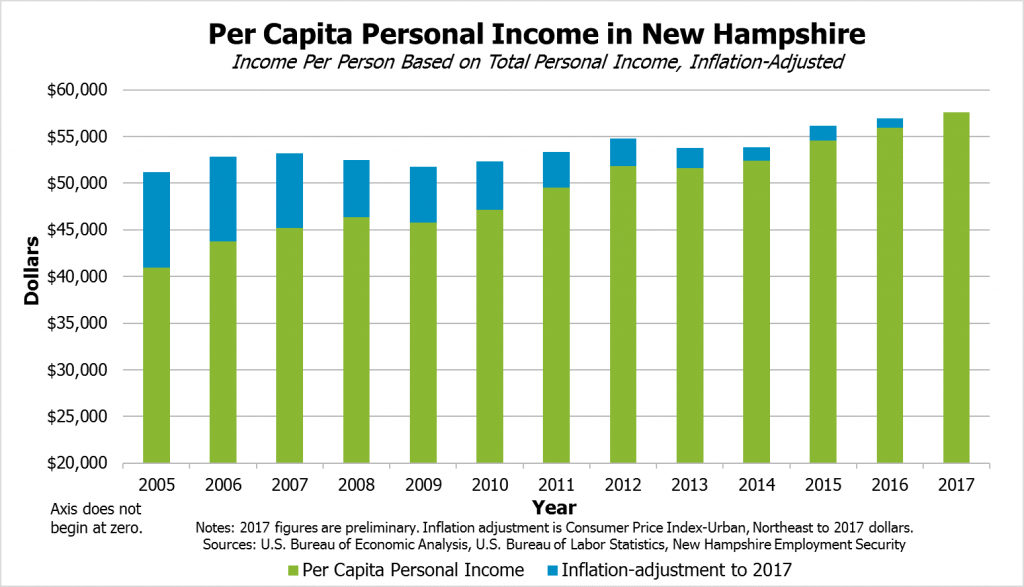
Inflation-adjusted per capita personal income, which is income received by individuals from any source, including both wages and ownership of assets, has been rising in New Hampshire since 2014. However, this rise has followed a period of tepid growth since the Recession began in 2007, including three years of declines relative to the year immediately prior. The recent rise in 2015 and 2016, which preliminary estimates suggest is continuing in 2017, indicate more resources are available per resident. However, this measure is an average, which considers all the personal income collected by New Hampshire residents divided by a population estimate. Unadjusted for inflation, per capita personal income in New Hampshire was $55,945 in 2016, with preliminary 2017 estimates at $57,574 per capita.[5]
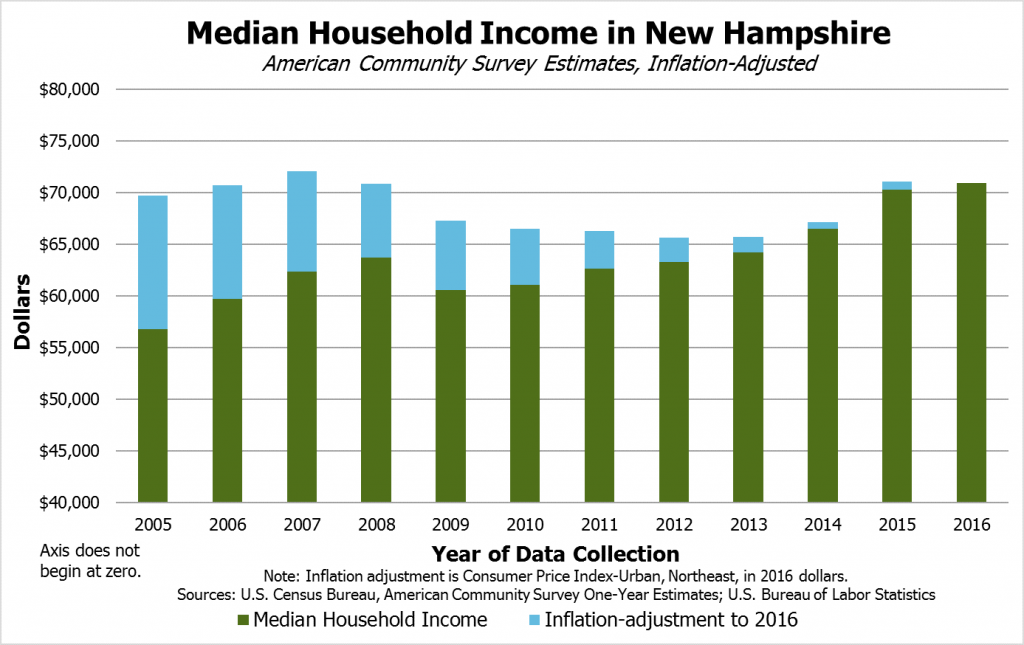
One common metric to understand the prosperity of state residents is median household income. Household size includes the number of people in an occupied housing unit, including related and unrelated individuals. Average household sizes have declined by less than one-tenth of an inhabitant in New Hampshire between 2005 and 2016, holding relatively steady at just below 2.5 individuals since 2010. The median household income shows the amount collected by the middle household in the distribution, meaning half of all households collected more income and half of all households collected less income; this measure is less likely to be affected by outliers or extremes than an average. Median household income in New Hampshire in 2016, the most recent year for which data are available, was measured as $70,936 and was at approximately the same inflation-adjusted levels as it was prior to the Recession. Inflation-adjusted median household income dropped annually between 2007 and 2012, and only substantially rebounded to near pre-Recession levels in 2015. While that is a positive indicator, it shows that the median household did not gain real spending power between 2007 and 2016, and although households may have faced similar or increased costs as they did prior to the Recession, the actual value of household incomes was lower for many years during the economic recovery.[6]
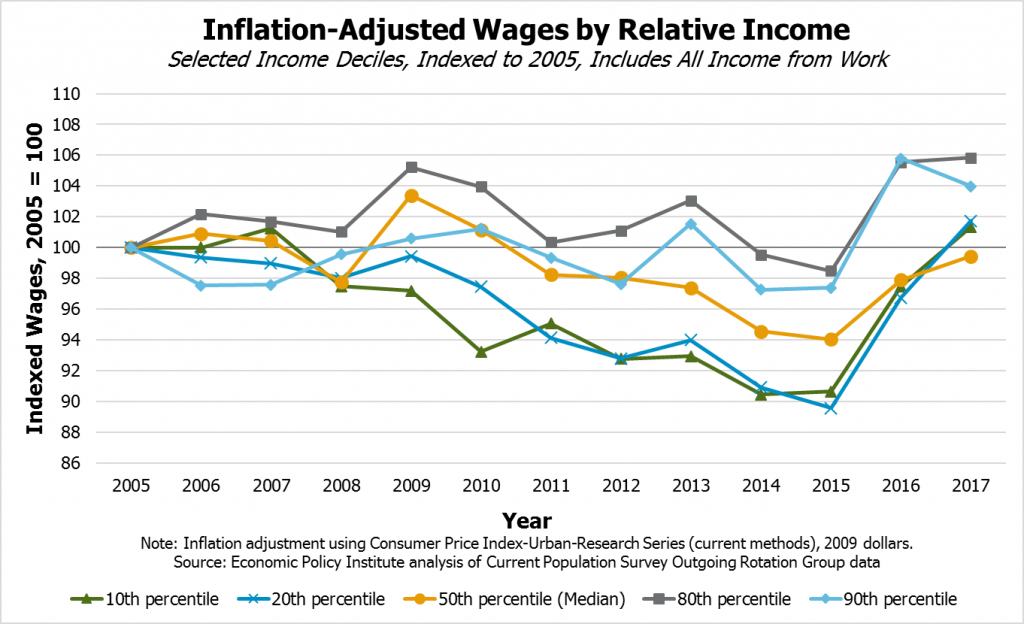
Exploring trends in inflation-adjusted wage estimates during the economic recovery shows that the median wage earner is, after experiencing work income declines in the years since the Recession ended, finally approaching 2005 levels again in 2016 and 2017. Income earners at the tenth and twentieth percentiles, indicating that approximately ninety percent and eighty percent of workers earn more income from employment than they do, appear to have rapidly recovered to pre-Recession levels only in 2016 and 2017, earning the estimated equivalent of $10.51 and $12.88 in hourly wages in 2017. (Workers at the fiftieth percentile earned an estimated $19.90 an hour, while the eightieth and ninetieth percentiles earned an estimated $34.59 and $45.53 per hour, respectively.) A tighter labor market and a low unemployment rate may be pushing up wages for these low-income groups faster than for the median-income worker. However, these low-income workers fell further behind for more years during and after the Recession than middle- and upper-income workers in relative terms, leaving them with more ground to make up. A continued tight labor market may help push up wages for these workers, but they may also be particularly vulnerable in the case of another recession, as low-wage jobs often have inconsistent hours, erratic scheduling, or long periods of reduced or nonexistent work throughout a year even during times of economic growth.[7]
Job Creation Led by Lower Wage Sectors
A potential reason for the long, slow recovery in incomes for some workers may be the types of jobs created in the recovery from the Recession. Job-seekers looking to replace lost employment or find new employment may have faced options that offered lower wages than the jobs they left.
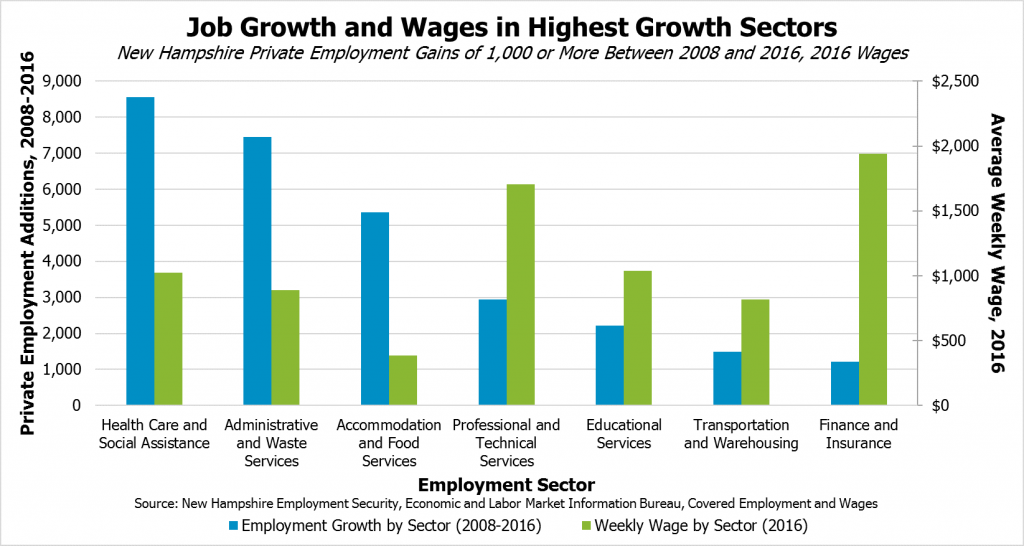
The three private industry sectors with the highest levels of job growth since the Recession have offered wages near or below average. The statewide average private sector weekly wage was $1,043 in 2016, a rise from $871 in 2008, without inflation adjustments. However, the sector contributing to job growth the most during this time was health care and social assistance, which added 8,556 jobs, with an average weekly wage in 2016 of $1,022, which is just under the statewide average. Administrative and waste services, which includes organizations that provide support for the daily operations of other businesses, had the second-highest job growth between 2008 and 2016, adding 7,461 jobs, with an average weekly pay of $888 in 2016. The third-highest job growth was in accommodation and food services, with 5,364 positions added and an average weekly wage well below the statewide average at $387. Of the industries that added more than 1,000 jobs from 2008 to 2016, only professional and technical services (2,942 jobs) and finance and insurance (1,214 jobs) had average weekly wages above the statewide private sector average.[8]
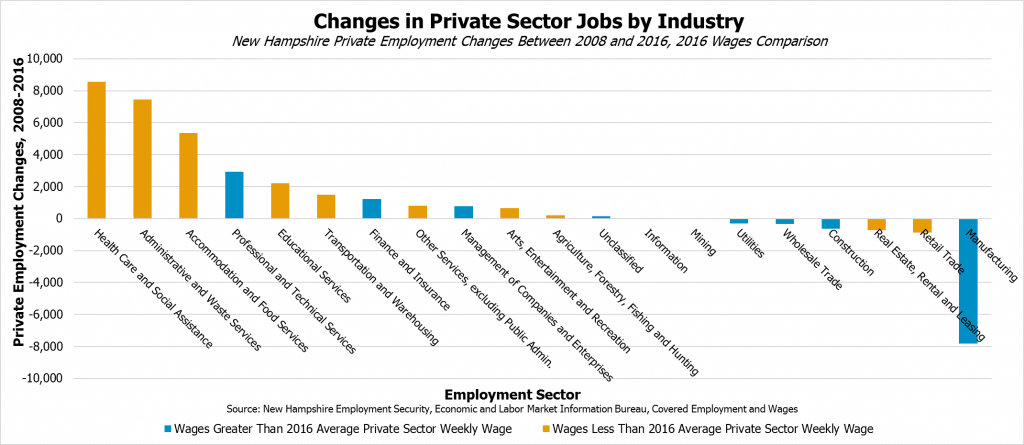
Additionally, while job growth was the highest in sectors that tended to have lower wages, many of the positions that were lost in the state between 2008 and 2016 were in sectors with average wages above the statewide average. The manufacturing sector experienced the largest loss during this time, with 7,814 fewer jobs in 2016 than in 2008 and an average weekly 2016 wage of $1,313, which was above the statewide private sector average. The utilities, wholesale trade, and construction sectors, which also had higher 2016 wages than the statewide average, also saw employment declines during this time period. Retail trade, the state’s largest employment sector with an average of 95,919 employees in 2016, shed many positions during the Recession and has not yet recovered to 2008 levels, with changes in the industry likely putting downward pressure on future employment growth.
Between 2008 and 2016, employment in local government declined by 1,698 positions, while state government lost 661 positions; both local and state government had lower average weekly wages than the private sector average in 2016. Employment by the federal government in New Hampshire dropped by 154 positions, while wages were higher than the average 2016 private sector wage in the state.
Poverty Persists
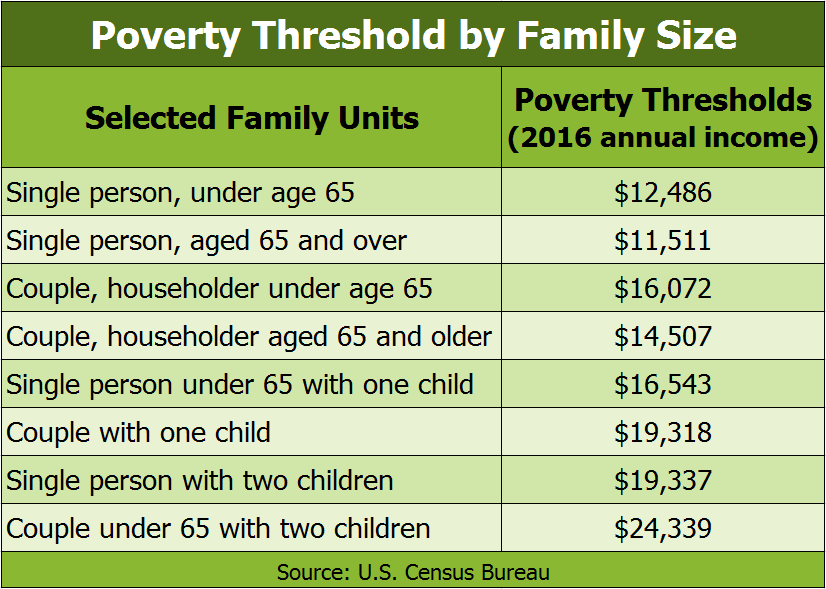
New Hampshire’s poverty rate has declined since 2014, but many Granite Staters face very low incomes. Annual figures from the U.S. Census Bureau provide information on the number of state residents living below the federal poverty threshold, which is updated each year for inflation and adjusted for family sizes. The poverty thresholds in 2016 were about $12,000 in income for a single person and $19,000 for a family of three.[9]
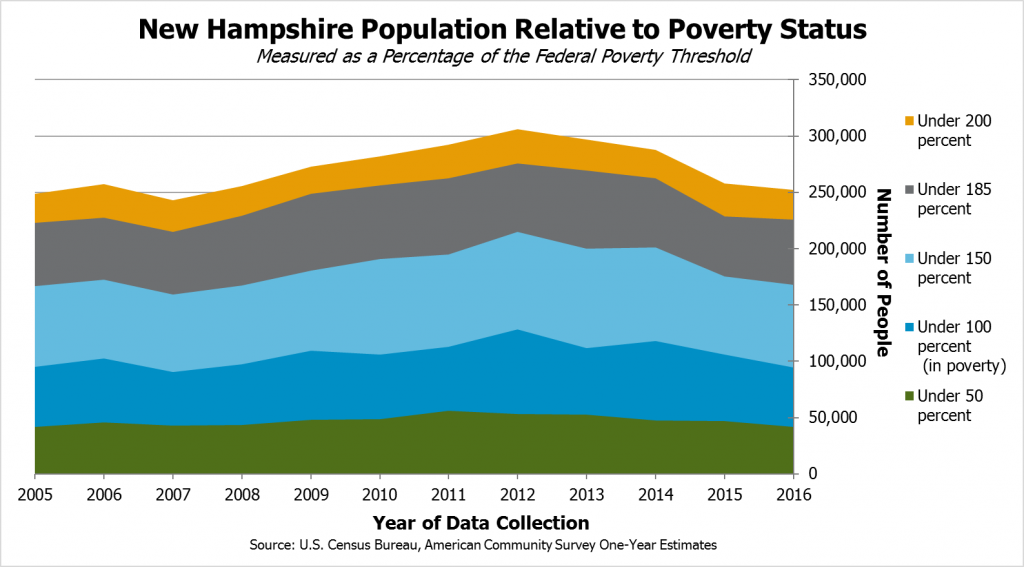
In 2016, the most recent year for which data are available, New Hampshire’s poverty rate was 7.3 percent. This rate was the lowest of any state in the nation and represents the lowest estimated poverty rate in New Hampshire since 2007, when it was estimated to be 7.1 percent. However, about 94,000 people remained in poverty in 2016, which is roughly equivalent to the combined populations of Concord, Laconia, Lebanon, and Portsmouth. About 252,000 people, or 19.5 percent of the state population, lived below twice the poverty threshold, suggesting a significant number of people live relatively near to the poverty threshold. About 42,000 people had incomes of half the poverty threshold or less.
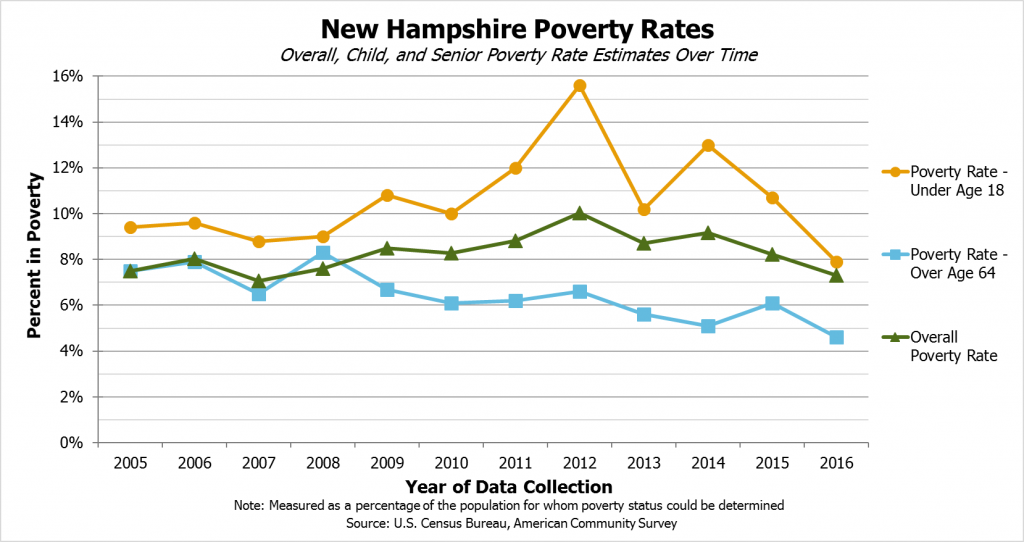
While the overall poverty rate rose during the Recession and has slowly fallen during the long recovery, the poverty rate for those aged 65 and older has declined since 2008, falling from a high of 8.3 percent to 4.6 percent in 2016. However, the child poverty rate was quite elevated during the long, slow recovery, rising to an estimated 15.6 percent in 2012 and only falling below 10 percent in 2016.[10]
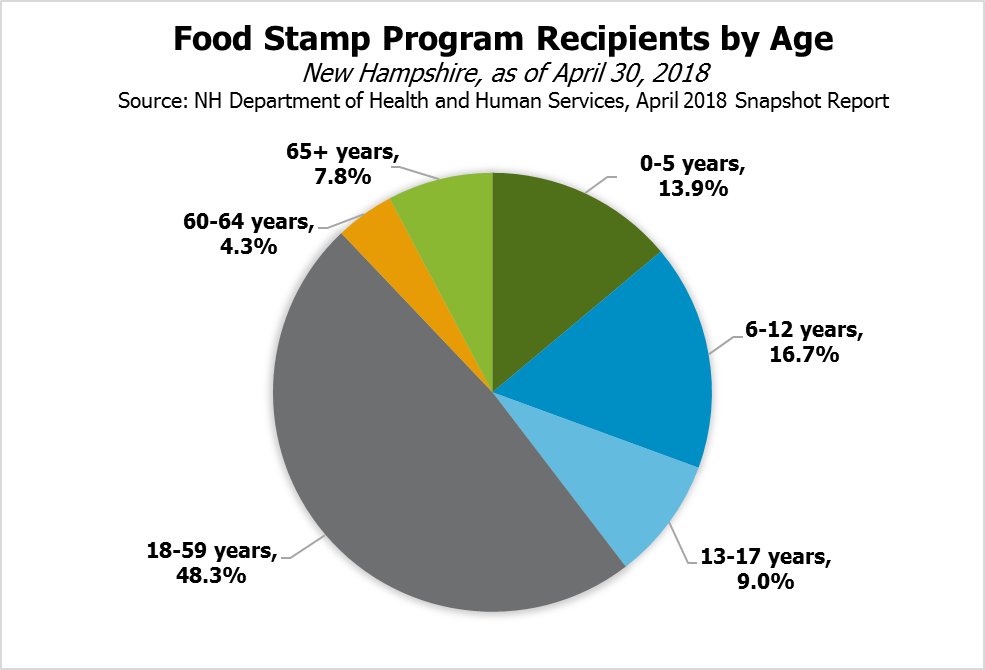
This higher child poverty rate in New Hampshire is also reflected in certain aid programs such as the Food Stamp program, also known as the Supplemental Nutrition Assistance Program or SNAP. SNAP benefits are only provided to those meeting certain low-income thresholds and other qualifications, which may include requiring children in the household in some instances. Nearly four in ten of the 87,090 people receiving SNAP assistance in New Hampshire at the end of April 2018 were under 18 years old, and 30.6 percent were children aged 12 years or younger.[11] Another program, Medicaid, served 184,154 people as of the end of April 2018, and about half of those recipients were 18 years old or younger. New Hampshire’s Medicaid program, which has components targeted at covering children and incorporates the federal Children’s Health Insurance Program (also known as CHIP), provided health coverage for approximately three out of every ten individuals 18 years old or younger in the state.[12]
Workforce Constraints Likely Slow Economic Growth
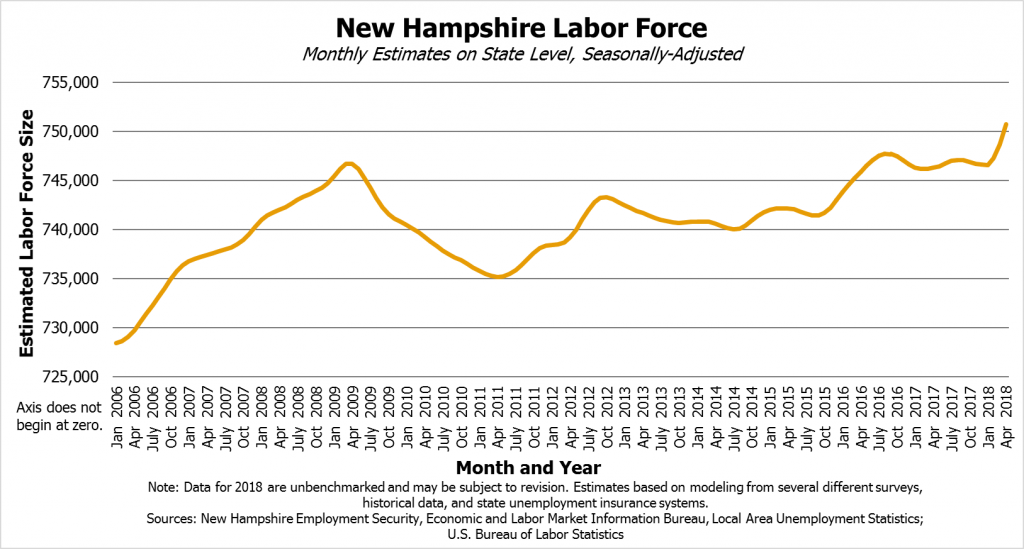
New Hampshire has seen significant job growth since the Recession, but the pace of growth may be slowing. While employment in the public sector decreased between 2008 and 2016, private sector employment increased by 21,068 from the average number of jobs based in New Hampshire in 2008 to the 2016 average. A sharp drop of 24,110 jobs between 2008 and 2009 and a continued decline of 4,272 jobs in 2010 left the economy with significant ground to make up during this period. The year-over-year increase in the number of jobs in the state only picked up dramatically immediately after the Recession and again in 2015, when growth in the economy likely spurred more hiring that lasted into 2016. However, data from 2017 suggests job growth may be slowing relative to the increases of 2016 and 2015. Preliminary survey data from 2018 suggest an uptick in employed New Hampshire residents, but these data are subject to regular revision and do not necessarily indicate increased hiring within New Hampshire.[13]
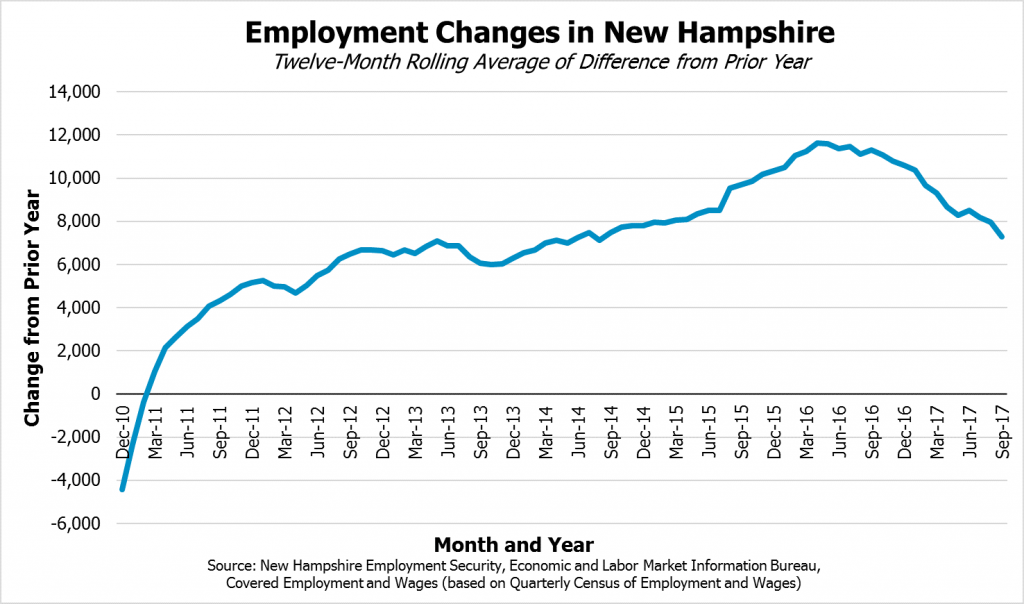
This apparent slowing in job growth may be due to a variety of factors, including slower overall economic growth than in 2015 and the economy approaching its potential after making up lost ground from the Recession. However, the slower hiring is likely due to labor force constraints. Job openings may be available, but employers may not be able to find workers to fill them. New Hampshire’s labor force was growing steadily prior to the Recession, but dropped sharply during 2009 and did not exceed its April 2009 maximum until June 2016, according to estimates from the New Hampshire Department of Employment Security and the U.S. Bureau of Labor Statistics. Labor force growth stalled for much of 2017, but unbenchmarked survey data from 2018, which are preliminary and subject to revision, suggests the labor force may have grown in recent months. This would indicate either more people are entering the state as workers or more people who previously stopped working or looking for work have re-entered the labor force.[14]
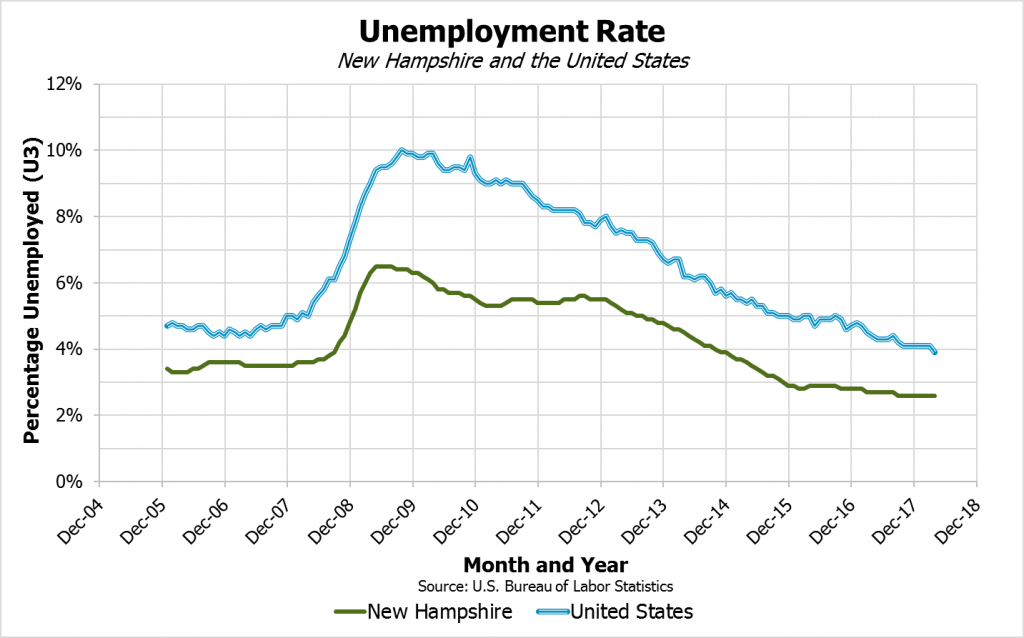
Growing the labor force and finding ways to invest in workers currently in the state would improve economic growth, as a relatively low number of workers who are in the labor force are unemployed. The unemployment rate in New Hampshire has been under 3 percent for nearly two-and-a-half years, and the size of the pool of unemployed workers had been shrinking slowly during that time. Although the unemployment rate in the United States has continued to drop, suggesting more workers may be finding work and that employers may be more willing to invest in and train less qualified workers, New Hampshire’s consistently low unemployment rate suggests the labor pool may be more restricted in the state than in the overall national economy. The preliminary estimate of the April 2018 unemployment rate in New Hampshire was 2.6 percent, tied with North Dakota, and only higher than Hawaii’s 2.0 percent rate among the states.[15]
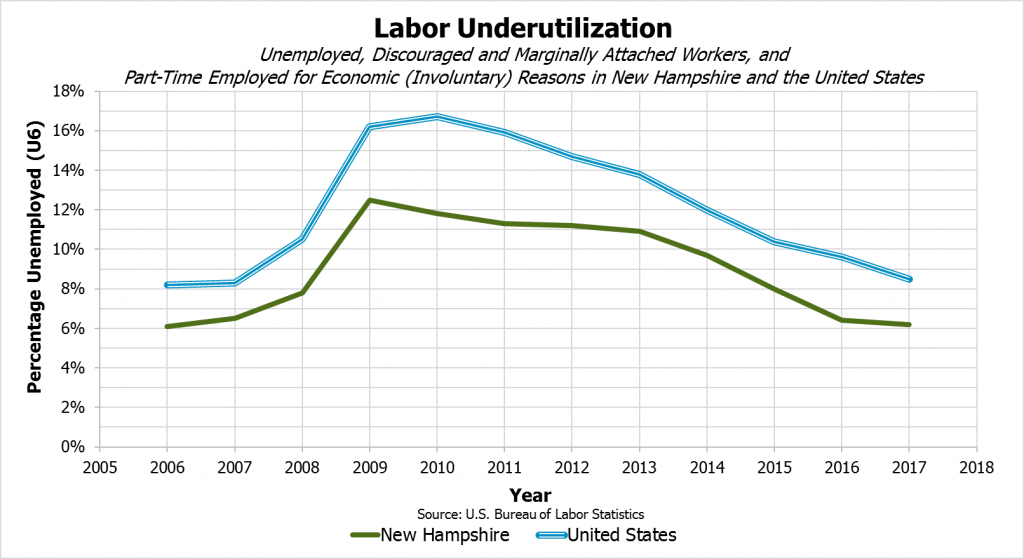
Broader measures of unemployment also indicate there may not be a large pool of potential workers outside of the existing labor force participants. The official unemployment rate measures the number of people who are available for work and have been looking for work in the last four weeks. A common measure of labor underutilization expands on this definition to include those not in the workforce but who want to work, are available for work, and searched for employment at any point in the last twelve months. This measure also includes people who are working part time and would prefer to work full time, but their hours were cut back or they cannot find a full-time job. In New Hampshire, the average labor underutilization rate for 2017 stood at 6.2 percent, which was lower than the U.S. average of 8.5 percent. As with the standard measure of unemployment, this measure of labor underutilization has been continuing to decline in the United States, but New Hampshire’s decline from 2016 to 2017 was only 0.2 percent, and the rate was 6.1 percent in New Hampshire in 2006, prior to the Recession. Additionally, the percentage of workers who have been unemployed for 15 weeks or more in New Hampshire, indicating relatively long-term unemployment, is at 0.9 percent, which is the same as the 2006 estimate.[16]
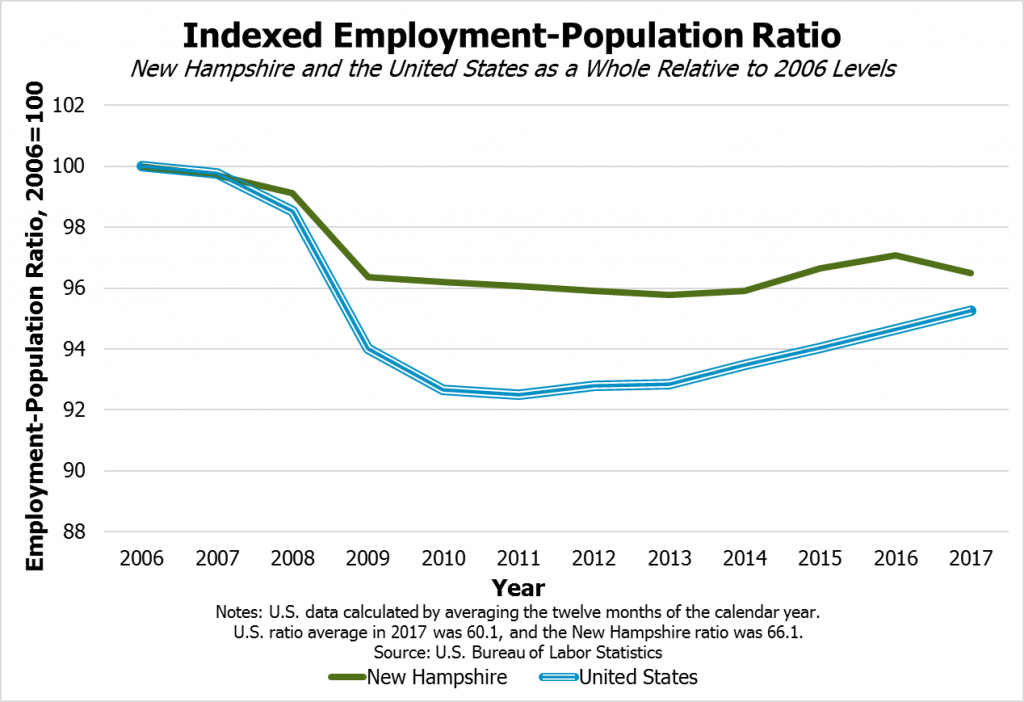
Another measure of resident participation in work is the employment-population ratio. As a percentage of all people aged 16 years and over and not in the active duty military, a correctional facility, or long-term medical care institution, New Hampshire has a relatively high employment-population ratio at 66.1 percent in 2017. The United States as a whole has a ratio of 60.1 percent. However, while both the national and state numbers have dipped relative to their pre-Recession levels and have yet to return to those higher levels, the ratio in the United States has increased at a faster rate than in New Hampshire, which has remained relatively static since it dropped following the Recession.[17]
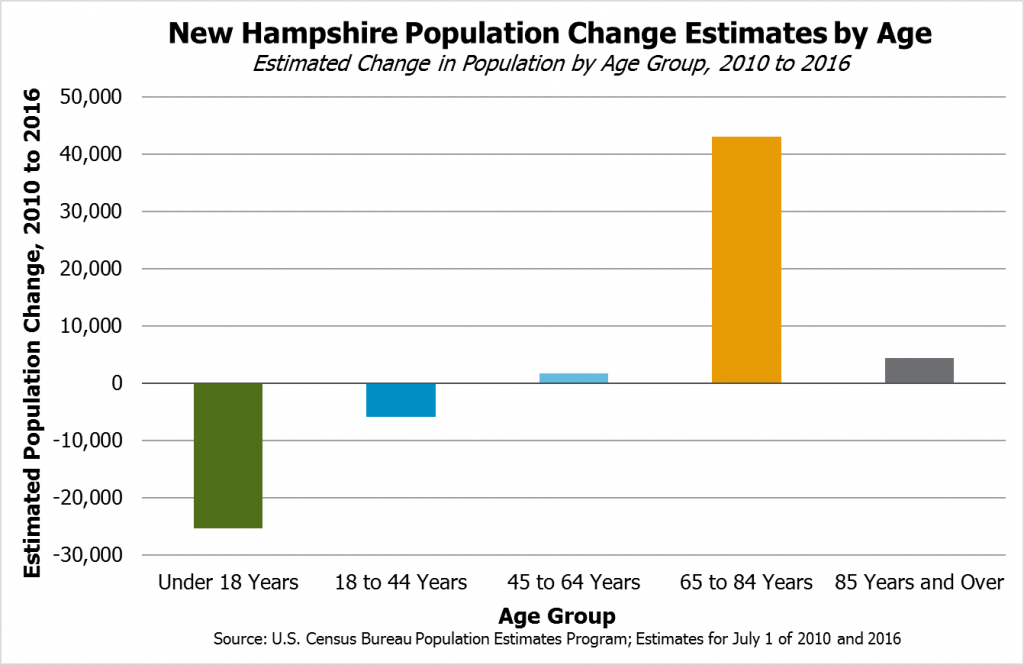
Changing demographics also play a role in New Hampshire’s labor force constraints. An aging state population may lead to a greater percentage of people retiring from work and not participating in the labor force. According to U.S. Census Bureau estimates, New Hampshire’s median age rose from 41.2 years old to 43 years old between 2010 and 2016, an increase of nearly two years in a six-year period. The estimated population changes were largest in the under 18 years old group, which saw a reduction of approximately 25,000 individuals in that age group between 2010 and 2016, and the 65-to-84 years old group, which increased by approximately 43,000 individuals. With such an increase in the number of people at or nearing retirement age and a net decrease in the number of people under age 45, fewer people may be interested in entering the labor force as a percentage of the state’s population. Older individuals may remain in the labor force at higher rates than previous generations, due to economic necessity or generally longer lifespans, but the aging population is likely contributing to labor force constraints in New Hampshire.[18]
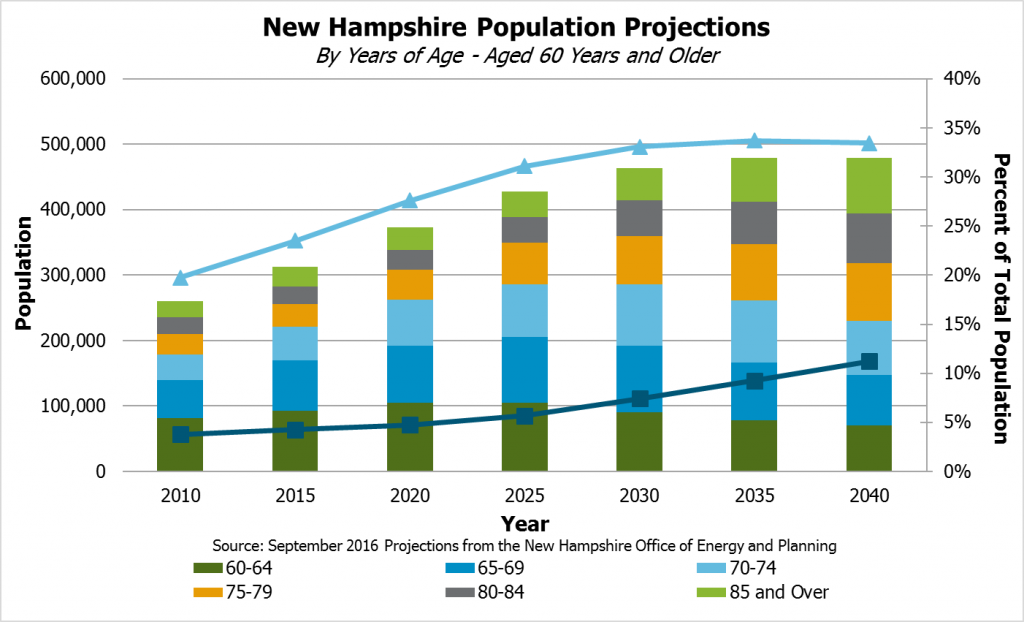
This demographic shift is likely to continue, and may present new challenges to New Hampshire’s economy going forward. Projections published by the New Hampshire Office of Energy and Planning in September 2016 indicate New Hampshire may continue to age significantly in the coming decades. This aging would not only have implications for the workforce from individuals no longer participating, but also may create new workforce demands surrounding caregiving and other activities associated with an older population.[19]
Slower hiring due to workforce constraints is likely slowing the state economy. This tightness in the labor market appears to be putting upward pressure on wages, particularly for relatively unskilled labor, as available workers come at a greater premium for employers. This may be good news for workers who have seen their wages stagnate significantly during the slow recovery and are still, in many cases, making up for lost ground. However, the labor shortage may put downward pressure on overall economic growth, and an economy with more growth would likely be more vibrant for all participants.
Housing Shortages Strain the State’s Residents and Economy
The lack of available housing and the increasing cost of housing overall present significant challenges to continued economic growth. These housing constraints may both decrease the resources available for workers, who must pay more for housing, and limit the number of people moving to the state.
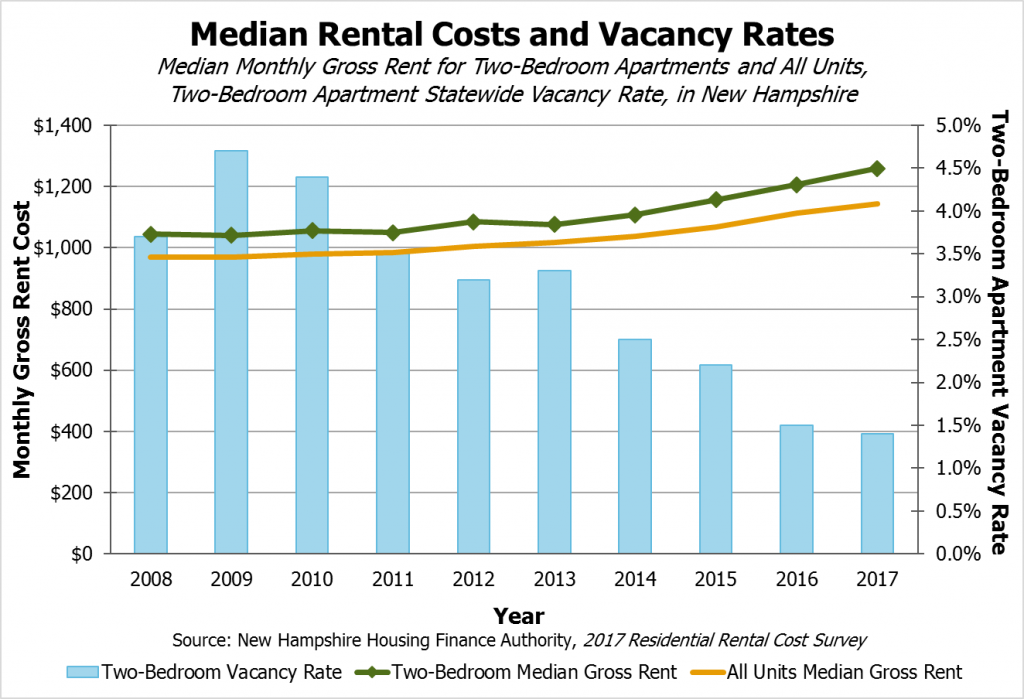
Survey data from the New Hampshire Housing Finance Authority show that rents, including utilities, rose 18.0 percent between 2008 and 2017 for all units. Two-bedroom apartments saw rents increase 20.6 percent during that time period, with a 17.0 percent increase between 2013 and 2017 alone, rising to $1,259 statewide and increasing to higher levels in the southeastern part of the state. Prices are likely increasing due to a lack of supply. The vacancy rate for two-bedroom apartments statewide was 1.4 percent in 2017, while the New Hampshire Housing Finance Authority notes vacancy rates of 4 to 5 percent indicate a balanced market of supply and demand.[20]
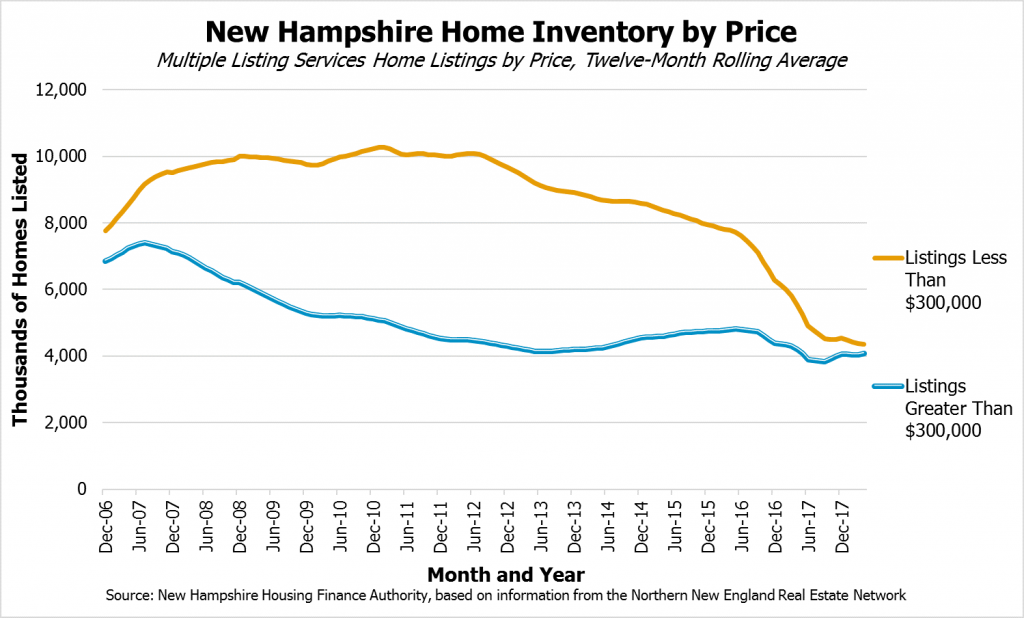
Those seeking to purchase homes also face a limited supply. The inventory of homes has declined overall since the Recession, which was in part spurred by an overheated housing market and a subsequent precipitous decline in home prices. This decline has been particularly acute for homes with lower list prices, which likely represent the part of the market most attractive to both first-time homebuyers and those seeking to downsize. At the end of 2017, the median sale price for a home had risen to $260,000. However, the inventory of homes listed for sale under $300,000 had declined dramatically between 2015 and 2017, with the number of homes listed in these different price categories approaching parity in 2018.[21]
With a lack of inventory and rising prices in both the rental and home purchasing markets, renters may be less likely to afford homes, may face higher rents, or may be prompted to incur more commuting costs to find affordable housing. Moving further away from work could increase costs for transportation and in other areas, including lost time, less accessibility to services, and the need to change school districts for those with children already attending school.
Higher housing costs particularly impact rental households. Using U.S. Census Bureau data collected in 2016, the New Hampshire Housing Finance Authority estimated that approximately 42 percent of rental households were paying 30 percent or more of their income in rent; U.S. Census Bureau survey data also suggest that lower-income households pay considerably more, with survey-based estimates showing nearly one-half of renter households with less than $35,000 in income pay 50 percent or more of their income in rent and utilities.[22]
Housing constraints restrict New Hampshire’s ability to attract new residents and expand the state’s workforce, and place higher costs on workers currently in the state, which is especially challenging for low-income families with children.
Different Counties, Different Recoveries
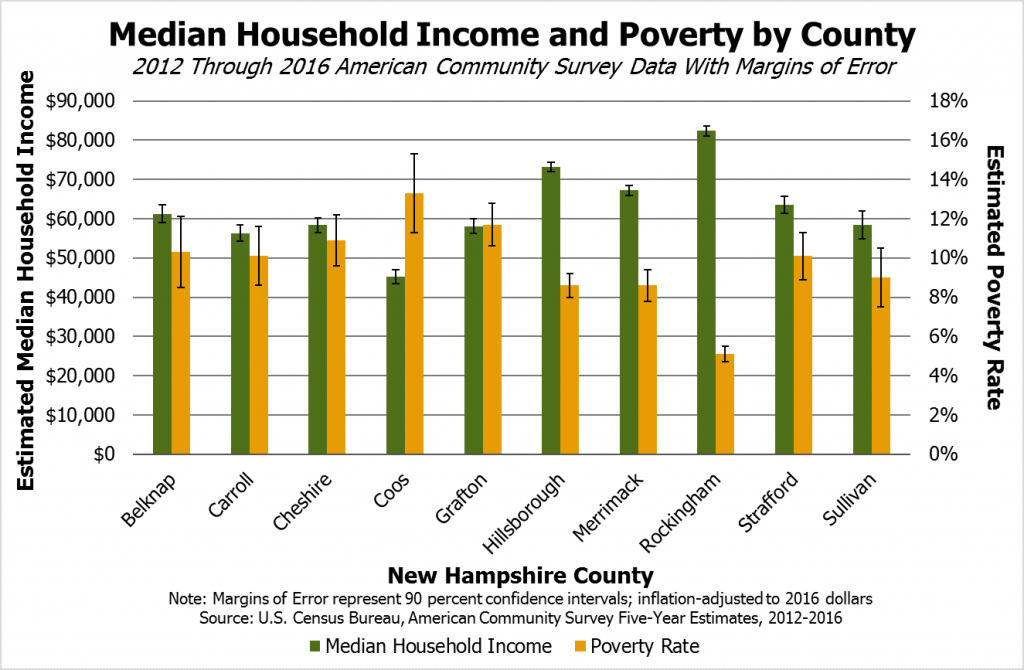
The economic recovery has not reached all New Hampshire counties equally, and regions both entered and emerged from the recovery on unequal footing. Aggregated data from 2012 to 2016 show different median household incomes and poverty rates in these counties, highlighting the inequities between the southeastern part of the state, particularly Rockingham County, and rural northern and western areas. While Rockingham County had an estimated, inflation-adjusted median household income of $82,398 during this time and a poverty rate of 5.1 percent, Coos County had an estimated median household income of $45,154 and a poverty rate estimate of 13.3 percent.[23]
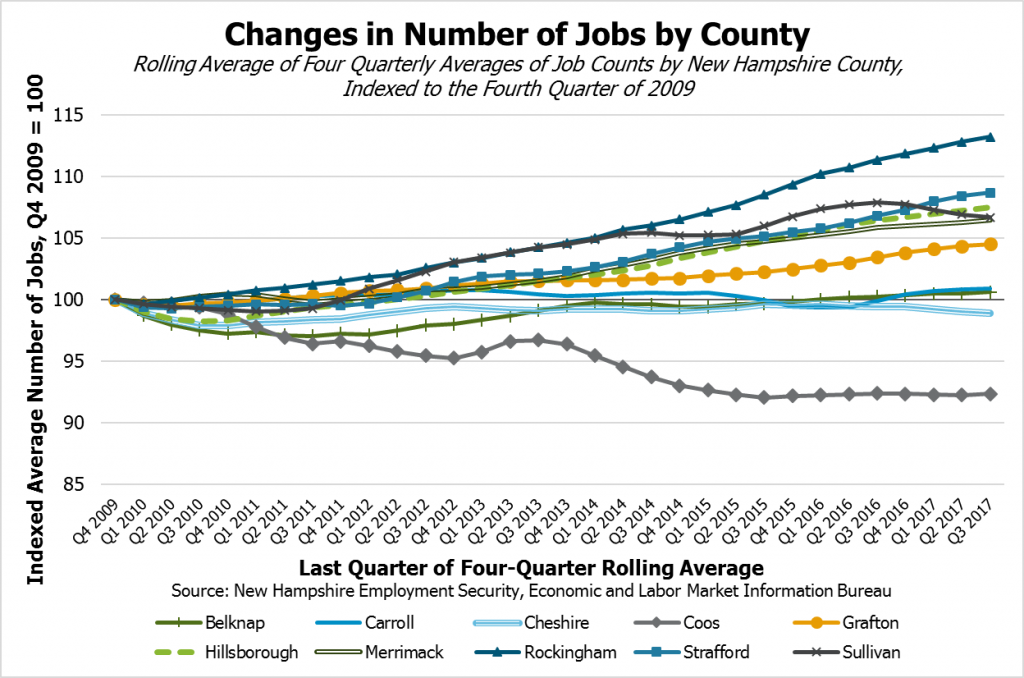
Tracking the number of jobs by county since the Recession provides an indication of the changes in economic opportunities between regions. An indexed value showing relative job growth by county from 2009 to the third quarter of 2017 puts Rockingham County well above all others. Strafford, Hillsborough, Merrimack, and Sullivan counties have fared well, with Grafton County also showing a noteworthy but slightly lower percentage growth. Sullivan County’s increase was large in percentage terms, but the difference in the number of average positions was relatively small, and increases in the raw number of jobs in Rockingham and Hillsborough counties dwarf all the other county-level changes during the recovery. Belknap, Carroll, and Cheshire counties experienced essentially no growth in the number of jobs based in the county, and Coos County had substantially fewer employees working within its borders in 2017 than in 2009.
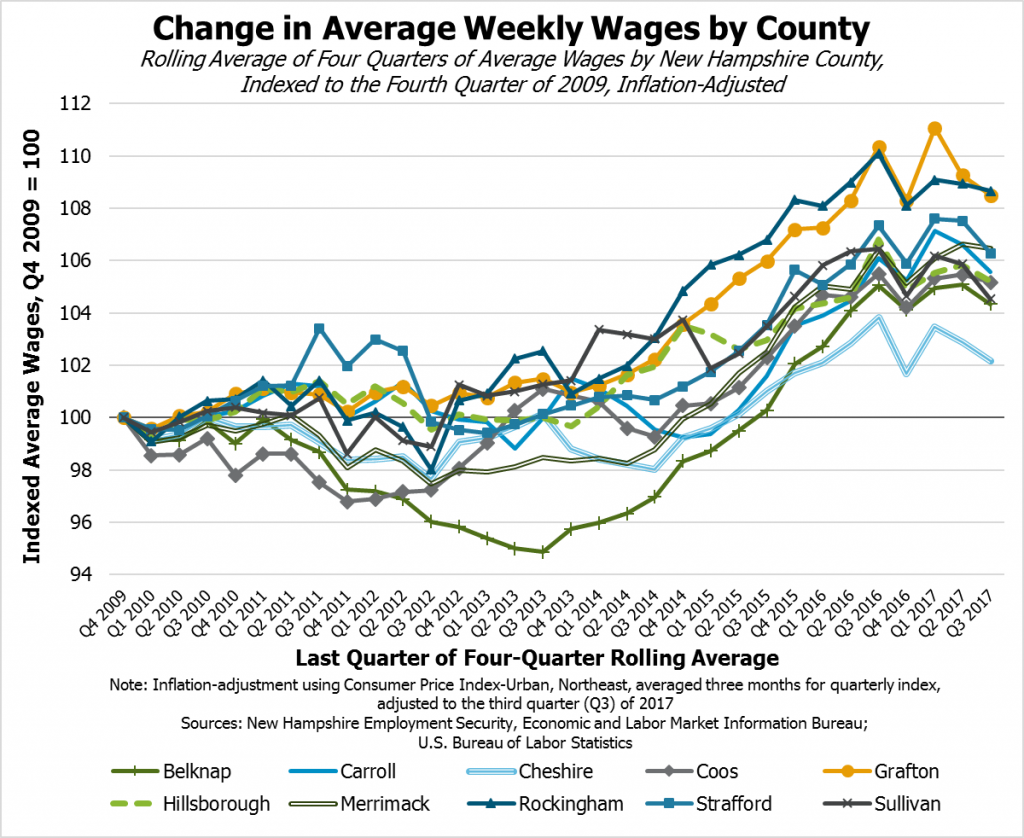
Average weekly wages in all counties increased starting in 2014, coinciding with the growth in real gross state product. Average wages, which can be affected more by outliers than median wages, increased the most from their 2009 averages in Rockingham and Grafton counties, while Cheshire County has seen the least growth by the third quarter of 2017. Belknap County average wages appeared to drop the most in relative terms during the recovery, with Cheshire, Coos, and Merrimack counties also stagnating more consistently than others in the early years of the recovery. Average wages in most counties have clustered together, however, with recent economic growth putting them in relatively similar positions compared to 2009 levels. These relative measures do not show that wage levels remain substantially different between the counties. The most recent four-quarter average shows an average weekly wage of $702 in Carroll County and $726 in Coos County compared to $1,081 in Grafton County and $1,143 in Hillsborough County.[24]
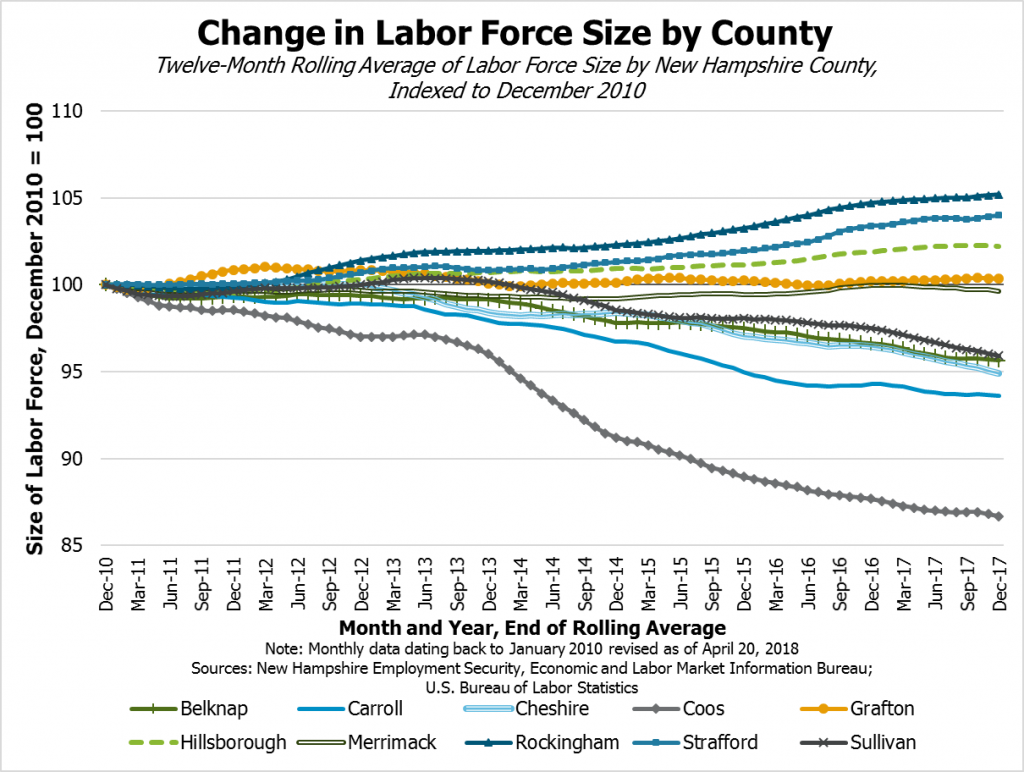
The labor force constraints that have developed in the New Hampshire economy are affecting different areas of the state to differing degrees as well, and demographics likely play a prominent role. Relative to the size of the labor force in each county in 2010, estimates suggest that the seacoast and southeastern regions, represented through Strafford and Rockingham counties, has experienced the largest increase during the economic recovery. Hillsborough County also has a larger workforce in 2017 than it did in 2010, while Grafton and Merrimack counties have workforces of roughly the same size. Other less urban counties in the state, including Belknap, Carroll, Cheshire, Coos, and Sullivan, have faced significant percentage declines in their workforces, particularly since 2014. These workforce declines may exacerbate recruitment difficulties for employers located in those regions or considering moving to those regions.
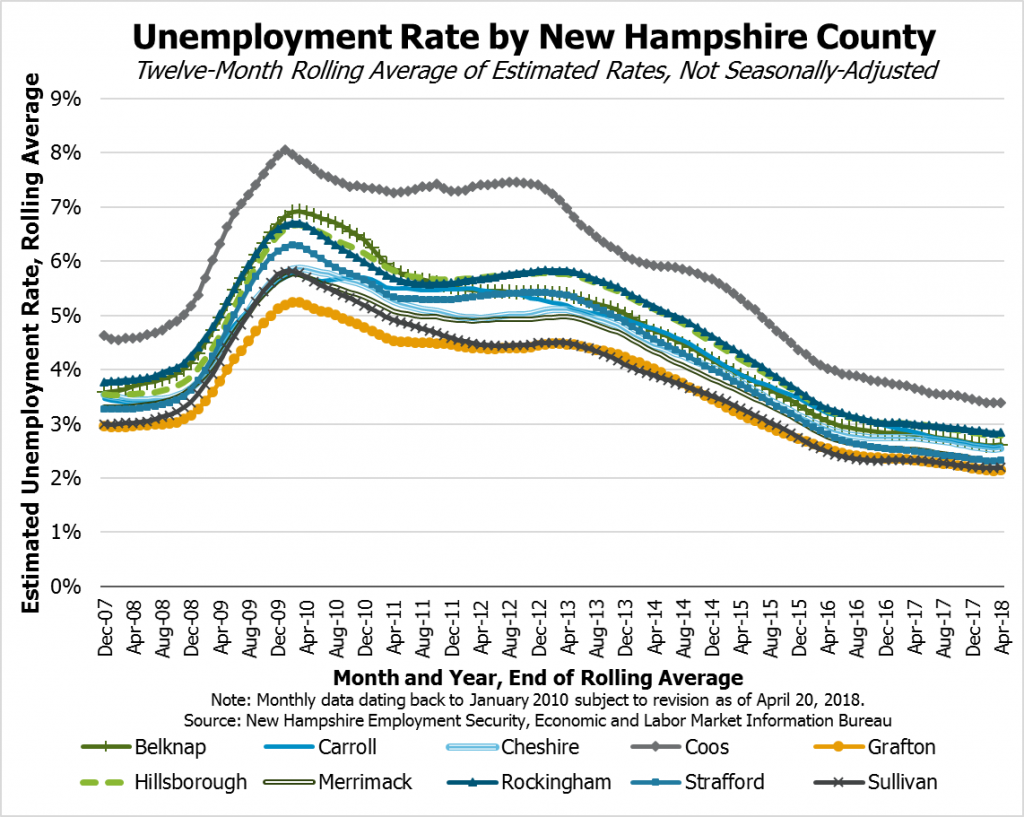
Although certain counties face larger economic challenges than others, all have experienced a drop in their estimated unemployment rates since the Recession. The decline in the unemployment rate has affected most counties in a similar fashion, although Coos County has consistently had a higher estimated unemployment rate than the other counties in the state.[25]
Conclusion
New Hampshire’s economy is performing well and by certain key metrics is finally recovering from the Great Recession. Overall economic growth appears to be relatively healthy, and the state’s unemployment rate is quite low. Wages and incomes appear to be rising back to pre-Recession levels, meaning that workers may be seeing their pay finally catch up to overall inflation since the Recession. However, many of those workers experienced years of declining relative incomes, and the effects of the Recession and the slow recovery have still set many workers back relative to where they would have been if the Recession had not occurred.
Aging demographics and rising housing costs present near- and long-term challenges to the state economy as well, as workforce shortages constrain the economy’s ability to grow. There are also potential future changes to the state’s economy stemming from the rise in the median age of the population, including both retirees leaving the workforce and an increasing need for services related to caring for older residents. A greater share of older adults may stay employed than in the past, and both older adults and people with disabilities can make additional important contributions to the state’s economy. The state, including governments and private sector entities, should invest in education and training that enables all residents to participate in the workforce.
New Hampshire’s poverty rate has declined in recent years, and if economic growth continues and is widespread, more people may be lifted out of poverty. The state should preserve access to key supports that help ensure those who rise out of poverty are less likely to fall back into poverty during an economic downturn. Continuing to invest in these residents, as well as investing in regions of the state with less job growth and greater labor force constraints, will likely help create a larger and more upwardly-mobile workforce and bolster the state’s economy.
A robust economy presents an opportunity for making important investments in the state and its people. The state should find ways to address housing costs and availability while also investing in the workforce through education and training. The uneven economic recovery across regions and the number of residents with very low incomes indicates the continued need for supports such as health care and food assistance. Concurrently, the state should also be prepared for future economic downturns and the provision of supports in times of greater need.
With the economy showing significant strengths, the state can help alleviate the constraints on future expansion and unlock greater potential for more widespread economic security and success. Making long-term, careful investments during times of growth helps sustain economic vitality into New Hampshire’s future and enhance prosperity for all the state’s residents.
Endnotes
[1] For more information on the 2017 preliminary estimates and notification of the 2014 to 2016 revisions, as well as definitions of state and national real gross domestic products, see the U.S. Bureau of Economic Analysis, Gross Domestic Product by State: Fourth Quarter and Annual 2017, May 4, 2018.
[2] The Congressional Budget Office estimates that the effects of the American Recovery and Reinvestment Act (ARRA) on U.S. Gross Domestic Product peaked in the first half of 2010, and the effects on employment began to decrease at the end of 2010. For more information on the effects of ARRA on the national economy, see the Congressional Budget Office, Estimated Impact of the American Recovery and Reinvestment Act on Employment and Economic Output in 2014, February 2015 and the Center on Budget and Policy Priorities, Chart Book: The Legacy of the Great Recession, updated May 8, 2018.
[3] See Release Tables from the U.S. Bureau of Economic Analysis, Gross Domestic Product by State: Fourth Quarter and Annual 2017, May 4, 2018.
[4] For more on the composition of jobs included in these sectors, see the U.S. Bureau of Labor Statistics, Industries at a Glance web page.
[5] For more on personal income as a measure and additional data, see the U.S. Bureau of Economic Analysis, State Personal Income: 2017, March 22, 2018.
[6] For more on definitions associated with median household income, see the U.S. Census Bureau, American Community Survey Code Lists, Definitions, and Accuracy. Data accessible through the U.S. Census Bureau, American FactFinder.
[7] For more on instability in the low-wage labor market, see the Center on Budget and Policy Priorities, Many Working People Could Lose Health Coverage Due to Medicaid Work Requirements, April 11, 2018. Wage data analysis completed by the Economic Policy Institute, based on an analysis of Current Population Survey Outgoing Rotation Group data and updated January 26, 2018.
[8] These figures, as well as other figures citing specific job numbers for certain geographies in this Issue Brief, are from the Quarterly Census of Employment and Wages, which includes about 97 percent of U.S. wage and salary civilian employment. For more on the definitions of each industry sector and which occupations are included, see the U.S. Bureau of Labor Statistics definitions for Health Care and Social Assistance; Administrative and Support and Waste Management and Remediation Services; Accommodation and Food Services; Professional, Scientific, and Technical Services; and other industries.
[9] For more on federal poverty guidelines, thresholds, and levels, see Poverty Guidelines from the U.S. Department of Health and Human Services.
[10] Poverty data collected from the U.S. Census Bureau, American Community Survey One-Year 2016 Estimates using American FactFinder.
[11] For more information on the Supplemental Nutrition Assistance Program in New Hampshire, see NHFPI’s Fact Sheet The New Hampshire Food Stamp Program, March 10, 2017.
[12] Estimates of New Hampshire children on Medicaid created using 2016 population estimate figures from the U.S. Census Bureau’s Population Estimates Program and the New Hampshire Department of Health and Human Services April 2018 Medicaid Enrollment Data. For more on Medicaid in New Hampshire, see NHFPI’s Common Cents post Medicaid Assists More Than 185,000 New Hampshire Residents from July 25, 2017, and NHFPI’s Issue Brief Medicaid Expansion in New Hampshire and the State Senate’s Proposed Changes from March 30, 2018.
[13] The Quarterly Census of Employment and Wages provides a count of the number of jobs within a geography (in this case, New Hampshire) by counting employers reporting to unemployment insurance programs; this covers about 97 percent of all jobs in the country. This measure is used to graph the changes in number of jobs in New Hampshire over time. The Local Area Unemployment Statistics program surveys individuals and establishments and uses unemployment insurance claims at state workforce agencies to estimate the number of people employed within a geography (such as New Hampshire) but requires modeling, is regularly revised, and counts those who are employed and live in a geography but are working elsewhere (such as Massachusetts, Vermont, or Maine).
[14] Economic data from the New Hampshire Department of Employment Security is available through the Economic and Labor Market Information Bureau NHetwork.
[15] For comparisons between seasonally-adjusted unemployment rate estimates among states based on the latest unemployment data, see the U.S. Bureau of Labor Statistics, Unemployment Rates for States, Seasonally Adjusted.
[16] For more on measures of labor underutilization, including “U3” and “U6” unemployment, see the U.S. Bureau of Labor Statistics, Alternative Measures of Labor Underutilization for States.
[17] For more on the employment-population ratio and source data, see the U.S. Bureau of Labor Statistics Glossary, Employment-population ratio, and States: Employment status of the civilian noninstitutional population, annual averages.
[18] See the U.S. Census Bureau’s Population Estimates Program for more data.
[19] The New Hampshire Office of Energy and Planning was renamed the Office of Strategic Initiatives in 2017. Population projections data are available on the Office of Strategic Initiatives website.
[20] See the New Hampshire Housing Finance Authority Annual Residential Rental Cost Survey for more details. Data cited in this Issue Brief are from the 2017 Survey.
[21] For more information on New Hampshire’s housing market, see the New Hampshire Housing Finance Authority Housing Market Reports.
[22] See the New Hampshire Housing Finance Authority, Housing Market Report, February 2018, and NHFPI’s Fact Sheet New Hampshire’s Numbers: 2016 Census Bureau Estimates for Income, Poverty, Housing Costs, and Health Insurance Coverage, September 28, 2017.
[23] Data collected from the U.S. Census Bureau, American Community Survey 2012-2016 Estimates using American FactFinder.
[24] For more county-level job and wage data, see the New Hampshire Department of Employment Security, Economic and Labor Market Information Bureau NHetwork database tool.
[25] Data for county-level labor force and unemployment rate analyses accessed through the New Hampshire Department of Economic Security, Economic and Labor Market Information Bureau archives from the Local Area Unemployment Statistics program. Data were compared to downloaded information from the U.S. Bureau of Labor Statistics Data Finder tool.