Despite a strong economic recovery from the early months of the COVID-19 pandemic, more than two years later, many Granite Staters face challenges that make affording everyday needs difficult.
Job growth in the last two years has been much faster than originally expected, mirroring other rebounding indicators of a strong economy, in large part due to swift federal policy action to provide both relief and financial support for the recovery.[1] In response to the unprecedented health and economic crisis created by the COVID-19 virus, the federal government engaged in a wide variety of significant policy actions to support working families both in New Hampshire and across the country. These initiatives ranged from direct payments to families and individuals to expanded nutrition assistance and enhanced unemployment benefits, and helped households weather the worst of the pandemic.[2]
However, many Granite Staters find themselves struggling with rising housing costs, limited child care options, and significant increases in living costs due to inflation as these key pandemic-related programs wind down or near their expiration. Among families with low- and moderate-incomes, and particularly those in rural areas of the state, these challenges have become even more pronounced. These workers earning middle or lower wages had seen their inflation-adjusted incomes recover from the 2007-2009 Great Recession in the few years before the pandemic, but were hit hardest and fastest by the COVID-19 crisis and are still disproportionally impacted by the consequences.
New Hampshire’s labor force remains thousands of workers below its pre-pandemic peak levels. Several key industries still have significantly fewer filled jobs than they did before the COVID-19 pandemic began, with historically low unemployment rates indicating a shortage of workers in the state. The pandemic-related impact of thousands of Granite Staters leaving the labor force has only heightened New Hampshire’s pre-pandemic workforce shortage challenges.
This Issue Brief examines key aspects of how workers in New Hampshire, as well as the economy as a whole, have fared relative to before the beginning of the COVID-19 pandemic. This report focuses particularly on central challenges facing Granite State individuals and families. This Issue Brief analyzes housing costs and availability, as well as disparities in access to formal child care services for children in New Hampshire. Additionally, this Issue Brief reviews changes in both employment and wages across the state and discusses opportunities to help address challenges facing working families across New Hampshire and uplift all Granite Staters.
New Hampshire's Pre-pandemic Economy
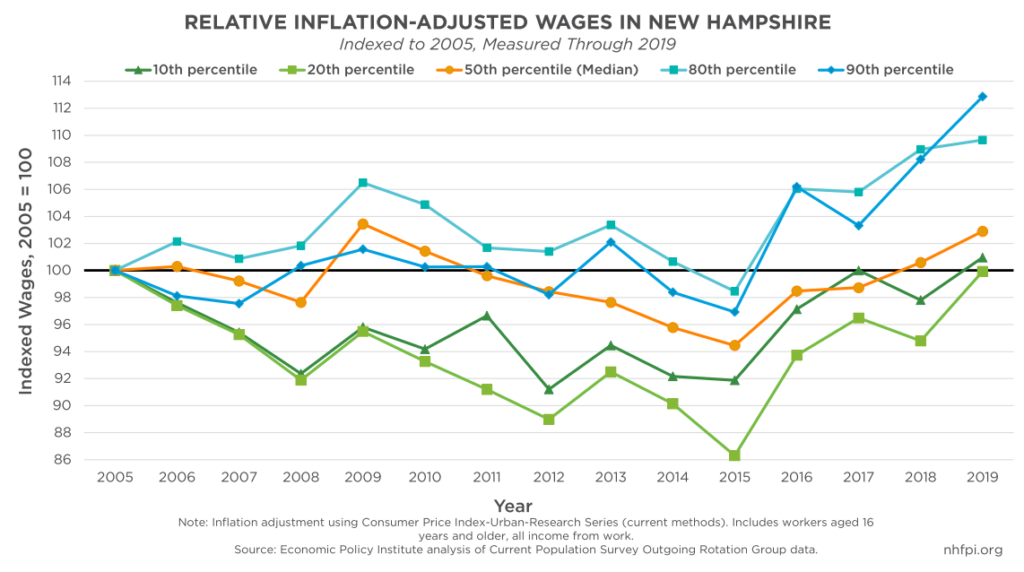
The Great Recession of 2007-2009 had significant and long-lasting impacts on Granite Staters with low- and moderate-incomes. Wages in the middle and lower end of all wages offered to workers dropped at the beginning of the Great Recession, and during the long, slow economic recovery, purchasing power continued to erode for about five years after the end of the Recession itself. Relative inflation-adjusted income from work for wages at the 10th and 20th percentiles, the lowest two measures in this analysis, did not start recovering toward pre-Great Recession levels until 2016. These wages fully recovered to those levels by 2017 and 2019 for workers at the 20thpercentile and 10th percentile, respectively.
Income earners in the 80th and 90th wage percentiles saw higher inflation-adjusted wages throughout most of the recovery period from the Great Recession, and these wages grew particularly rapidly within the last years of the recovery. Workers at the 50th percentile, which were workers earning the median hourly wage, saw a decline in inflation-adjusted hourly income from work in the first half of the recovery, with wage increases starting in 2016, and returning to pre-Great Recession levels in about 2018. However, median income earners still lagged behind those in the upper wage percentiles.
With wage growth falling behind inflation for many workers over the course of the recovery from the Great Recession, lower-income workers likely struggled to build savings even as the economy was growing overall. National survey data from October 2019, before the pandemic began, showed that 37 percent of U.S. adults would not pay for an unexpected $400 expense with cash, savings, or a credit card to be paid off at the next billing cycle. While this percentage had been declining during the recovery from the Great Recession, and has subsequently declined with support from federal pandemic-related policies, the data suggest a significant number of U.S. households may have had substantial difficulty paying, or been unable to pay small unexpected expenses, such as car repairs or medical expenses.[3]
Ability to pay for an unexpected $400 expense varied by formal educational attainment, likely reflecting differences in income. About 43 percent of U.S. adults with a high school degree or less were not able to pay their bills in full that month, or would have been unable to with an unexpected $400 expense, while the same situation was true for only 13 percent of adults with a Bachelor’s degree or higher.[4] Incomes were also likely more volatile for many workers with lower wages; 46 percent of workers in leisure and hospitality reported that income varied from month to month at least occasionally in 2019, while income varied similarly for only 24 percent of professional and business workers nationally.[5]
New Hampshire's Labor Force
As wages for lower-income Granite Staters had begun to recover to pre-Great Recession levels, the COVID-19 pandemic created another economic crisis. New Hampshire’s unemployment rate in February 2020, prior to the beginning of the pandemic, was a seasonally adjusted 2.7 percent. In April 2020, that number skyrocketed to 16.2 percent as the economy and society shifted to combat the spread of the virus.
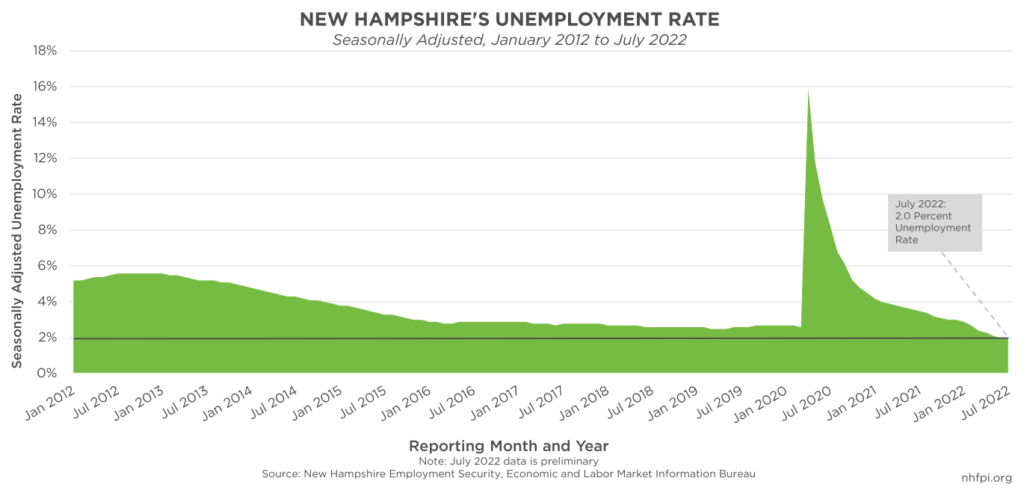
Following the initial shocks of the pandemic, which displaced many workers, the unemployment rate began to consistently decrease to pre-pandemic levels. The estimated, seasonally-adjusted unemployment rate in February 2022 was 2.7 percent, matching the unemployment rate in February 2020, immediately prior to the pandemic. By June 2022, New Hampshire’s unemployment rate had fallen to 2.0 percent, a rate at which it remained in July 2022; these were the lowest monthly unemployment rates recorded in New Hampshire since the tracking of these state-level data began in January 1976.[6]
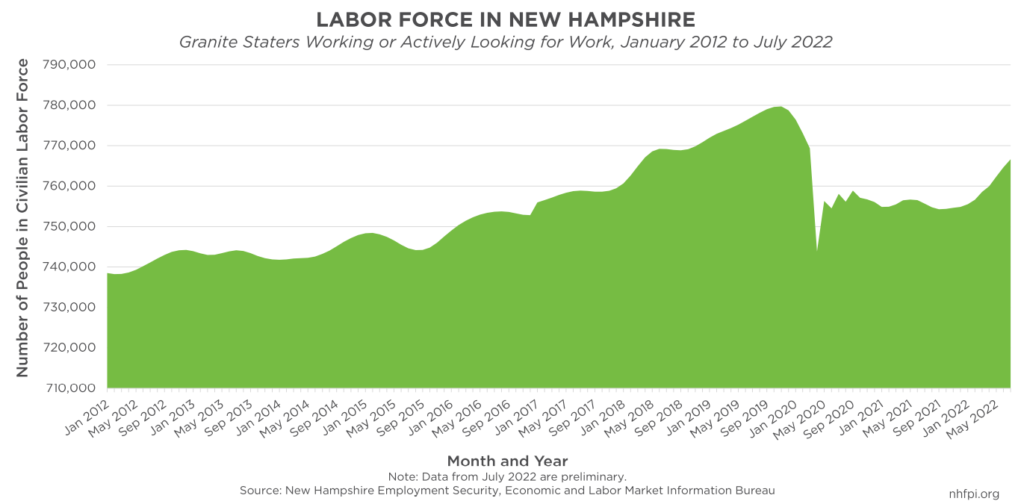
These record-low unemployment rates also coincided with an increase in the civilian labor force in New Hampshire, which includes people who are employed and those who are unemployed and actively looking for work.[7] However, this recent increase followed a substantial drop associated with the first months of the pandemic in New Hampshire. In February 2020, the seasonally adjusted labor force in New Hampshire stood at an estimated 773,101 workers. By April 2020, this number had fallen by more than 29,000 workers to 743,821.[8]
By July 2022, New Hampshire’s labor force recovered to 766,658 workers, but remained about 6,000 workers below the immediate pre-pandemic level.[9] This drop in the size of the labor force, combined with a historically low unemployment rate, suggests that New Hampshire is experiencing a worker shortage, which occurs when there is not a sufficient number of workers to meet the demand for labor in the state. People have left the labor force for a wide variety of reasons during the pandemic, including significant life changes and both short- and long-term illness.[10]
Some of this labor shortage may be attributed to the long-term impacts of the state’s demographic composition, some of which may have been accelerated by the pandemic. New Hampshire’s population overall is older than the national population, with 27.2 percent of all residents aged 60 years and over in 2021. Nationally, the percentage of adults aged 60 years and older was estimated to be just 23.2 percent in 2021.[11] The labor force participation rate among older adults is lower than adults aged 25 to 54 years in New Hampshire and nationwide.[12] Therefore, New Hampshire, with a higher percentage of older adults than the nation as a whole, will be more constrained in its labor force in the long run; 2022 State projections for New Hampshire’s population estimated the percentage of adults aged 60 years and older would exceed 30 percent of the state’s population by 2030.[13]
The pandemic also disproportionately impacted women in the workforce in New Hampshire. Between April and June 2020, women represented 58.6 percent of those applying for unemployment compensation, which was a significantly higher percentage of all people receiving benefits than in the two previous recessions or the period immediately before the pandemic.[14] Over the course of the pandemic, many women, particularly younger women, left the labor force in large numbers. In the first quarter of 2020, women aged 20 to 24 years participated in the labor force at a rate of 78.1 percent. By the first quarter of 2022, that rate dropped to just 64.6 percent. For women aged 25 to 34 years, the labor force participation rate was 85.5 percent in the first quarter of 2020. By the first quarter of 2022, that rate had declined to just 75.8 percent.[15]
For all women aged 16 years and over, the total labor force participation rate dropped from 63.1 percent in the first quarter of 2020, to 59.3 percent in the second quarter of 2022. The labor force participation rate for men in this same time period dropped from 73.0 percent to 71.2 percent.[16] This discrepancy is likely a result of many factors, including both women being employed as relatively high percentages of all workers in some of the industries most impacted by the pandemic and the greater child care burden placed on women as New Hampshire’s formal child care facilities struggled to remain open and reduced their capacity.
Employment Trends Across Industries
The pandemic had significant impacts throughout the economy. As these impacts became widespread, some industries experienced greater difficulties than others. In March and April 2020, large numbers of workers were permanently or temporarily displaced from work. Between February and April 2020, the seasonally adjusted estimated number of workers reported by New Hampshire employers decreased by 111,400, representing 16.3 percent of the jobs in the state. Every sector in New Hampshire except for federal employment lost jobs during this period. The Leisure and Hospitality sector was hit particularly hard, with 39,900 jobs lost, which was more than half of the jobs in that sector.[17]
Since the initial shocks of the pandemic, New Hampshire’s economy has made a relatively swift, although uneven, recovery. Using seasonally-adjusted figures, the total estimated number of nonfarm jobs filled by employees at New Hampshire companies in June 2022 remained 8,100 jobs (1.2 percent) lower than estimated levels in February 2020, immediately prior to the impacts of the pandemic.
Industry employment trends since immediately prior to the pandemic, adjusting for seasonal impacts, vary considerably. Two sectors have seen substantial growth between February 2020 and June 2022. Professional and Business Services sector employment, counting the number of filled jobs at New Hampshire employers, increased by approximately 8,900 jobs, or 10.5 percent. Mining, Logging, and Construction added 2,700 jobs, constituting 9.1 percent growth, which was estimated to be entirely in construction.
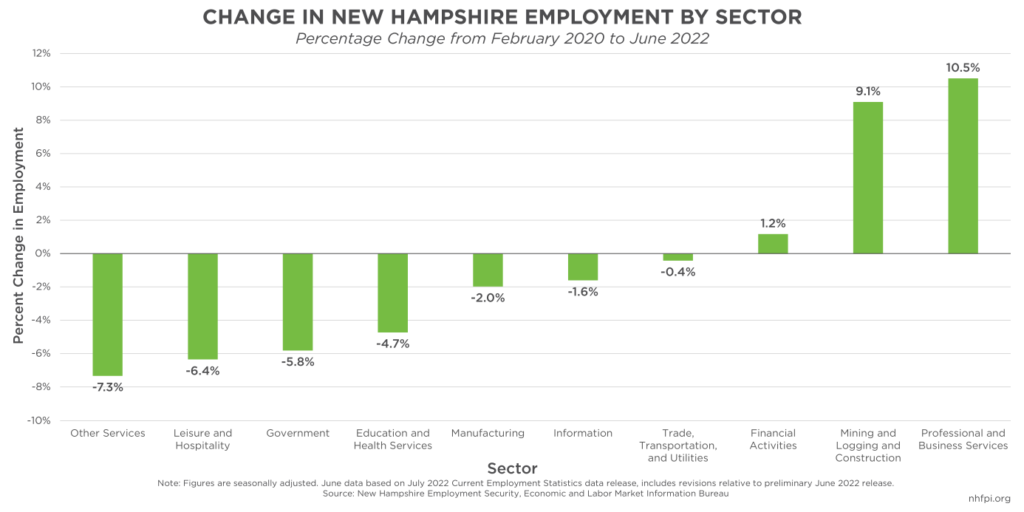
Other sectors have had relatively little change in the number of filled jobs. Financial Activities, which includes finance, insurance, and real estate and rental activities, increased the number of filled jobs by 400, or 1.2 percent, over this time period. The number of jobs in Trade, Transportation and Utilities dropped by 600, a 0.4 percent drop across the sector, which is the largest by total employment and includes jobs in retail sales. The Information sector, which includes publishing, software, broadcasting and telecommunications, data processing, and certain other industries, lost 200 jobs (1.6 percent) during this period.[18]
As some industries have a larger number of filled jobs and others have had little change, certain sectors, including key employment industries in the state, had fewer jobs in June 2022 than in February 2020. The Manufacturing sector had 1,400 (2.0 percent) fewer workers in June 2022 than in February 2020. The Education and Health Services sector, the state’s second-largest employment sector, was 6,000 (4.7 percent) filled jobs smaller in June 2022 than in February 2020. The Government sector had 5,300 (5.8 percent) fewer workers in June 2022 than before the pandemic. The Leisure and Hospitality sector was 4,700 (6.4 percent) filled jobs below February 2020 levels, and Other Services had 1,900 (7.3 percent) fewer employees.
As New Hampshire’s unemployment rate remains at record low levels, workers are likely able to be more selective about the industries or positions in which they chose to work. Workers earning lower incomes may look for higher paying jobs, given the limited labor supply and wide selection of available jobs, causing employers to offer higher wages in industries that have seen larger declines in workers. Nationally, approximately 60 percent of workers who quit their jobs between April 2021 and March 2022 saw increases in their inflation-adjusted earnings relative to the same month in the previous year.[19]
Inflation Increases Financial Strain
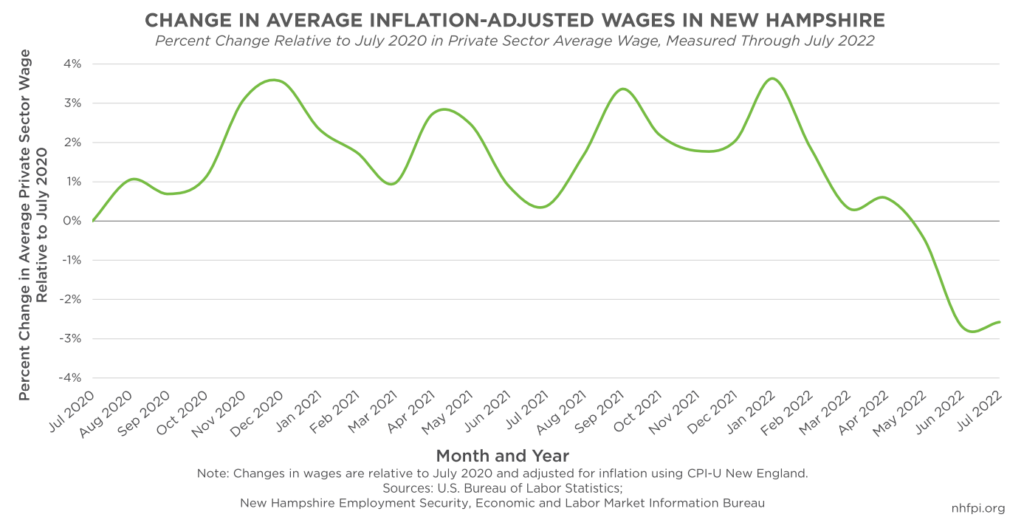
Rising inflation has made making ends meet and paying for usual household expenses more difficult for individuals and families in New Hampshire. Consumer prices increased nationally by 9.1 percent between June 2021 and June 2022, the largest 12-month increase in inflation since December 1981, with energy prices increasing 41.6 percent from the prior year.[20] While nominal wages did increase during the same time period, the average inflation-adjusted private-sector hourly wage in New Hampshire was 2.6 percent lower in July 2022 compared to July 2020. When price increases outpace wage growth, the purchasing power of consumers falls and financial pressures increase.
The minimum wage in New Hampshire has remained unchanged since July 2009, when it was increased to $7.25 per hour.[21] Adjusting for inflation, the minimum wage in July 2022 has the same purchasing power as $5.45 in July 2009, representing a $1.80 decrease in real hourly wages relative to costs in the Northeastern United States.[22] A full-time worker earning the federal minimum wage in July 2009 earned $15,080, but the purchasing power in July 2022 dollars has declined to the July 2009 equivalent of $11,336, as goods and services have become more expensive while the wage has remained the same dollar value.[23]
Policies that provided income support to families during the pandemic, including direct income supports and assistance for key expenses, improved the financial well-being of many families. The most recent pandemic-related aid with direct income supports, passed through the American Rescue Plan Act (ARPA), likely substantially helped increase the savings and ability to pay for unexpected expenses for many households.[24] ARPA included provisions to support unemployed workers, increased nutritional assistance, and aid to renters and homeowners impacted by the pandemic and needing to cover housing costs. The direct general cash assistance in ARPA also included the Economic Impact Payments, which were cash transfers of $1,400 per individual, and the Advance Child Tax Credit (ACTC). The ACTC, an expansion of the existing Child Tax Credit, delivered up to half of the expanded amount owed to parents under the 2021 Child Tax Credit in monthly payments. This delivery was substantially different from past years, as previously, the Child Tax Credit was only provided when taxes for a prior year were filed.[25]
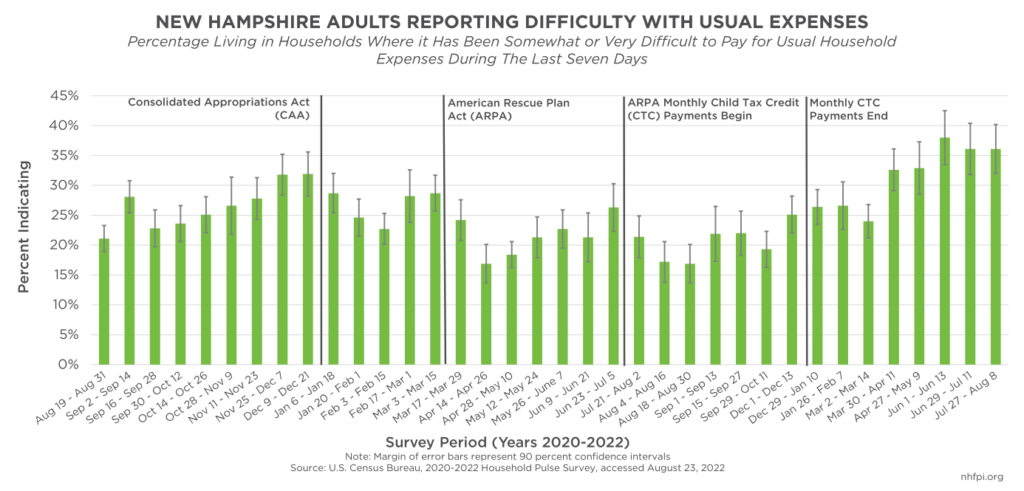
The percentage of New Hampshire adults living in households reporting to the U.S. Census Bureau that it had been “somewhat” or “very” difficult to pay for usual household expenses in the past seven days increased following the conclusion of the monthly ACTC payments in December 2021. The average percentage of Granite Staters who reported that it was somewhat or very difficult to pay for usual household expenses in the past seven days was 21.3 percent when monthly ACTC payments were being delivered. Comparatively, between December 29, 2021, and August 8, 2022, in survey data collected since the end of the monthly ACTC payments, the average percentage of Granite Staters reporting difficulties paying for usual household expenses increased to 31.6 percent of respondents, an approximately 10 percentage point increase.[26]
High Housing Cost a Barrier
The combination of severely constrained housing supply and high housing cost is a significant barrier to both workers and businesses. People who face difficulty finding adequate and affordable housing for themselves or their families may be more likely to be constrained in seeking employment within regions that have available housing if they have limited transportation options or cannot reliably or affordably commute long distances. Places with available affordable housing, however, may not be near the best employment for those workers. This limits workers’ flexibility to move into New Hampshire to take opportunities to work in needed jobs, and the ability of those within the Granite State to relocate to new employment openings outside of their current area.
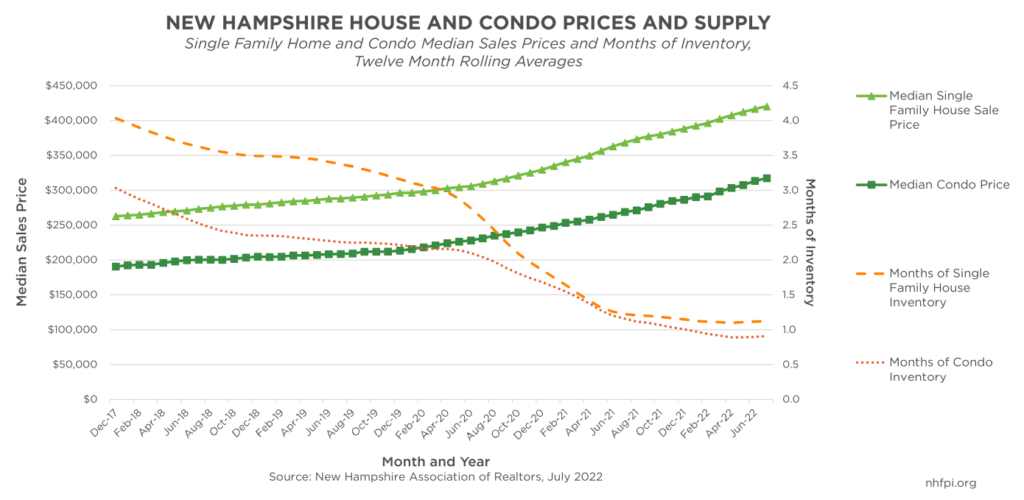
New Hampshire continues to experience a surge in housing prices, fueled partially by record high demand with near record low housing supply. In February 2020, prior to the pandemic’s impacts reaching New Hampshire, the median sales price of a single-family house was $289,450; this was a small decline relative to the July 2019 median home sale price of $300,000, showing both the seasonal variation in housing prices and the limited supply of houses statewide prior to the pandemic.[27] In July 2022, the median sales price for a single-family house was $450,000, a 55.0 percent increase from February 2020. The July 2022 median sales price was also about 11.1 percent above the July 2021 sale price of $405,000 and 32.4 percent more than the July 2020 median sale price of $340,000, indicating the consistent and significant increases in the cost of single-family houses in two years following the onset of the pandemic.[28]
Condo prices increased similarly to single family home prices, with the median condo sale price in July 2022 at $340,000. That median price was $45,000 more than that of the same month a year earlier, and 54.6 percent higher than the median February 2020 sales price of $219,950. However, the July 2022 median sales prices for both single-family houses and condos dropped from the prior month’s figures. The June 2022 median sales price for a single-family house was $460,000, which is $10,000 more than in July 2022. Condo prices in July 2022 decreased by a larger amount, down $12,500 from the June 2022 median sales price of $352,500.[29]
The increases in housing prices, exacerbated by the pandemic and the strong demand for housing, coincided with a significant drop off in housing inventory. In July 2022, there was just 1.7 months of housing inventory available on the market, and just 1.3 months of condo housing inventory. However, these figures are higher than the January 2022 low points in supply, when the market held just 0.6 months of inventory for both single-family houses and condos, suggesting an increase in housing availability relative to the winter of 2021-2022.[30]
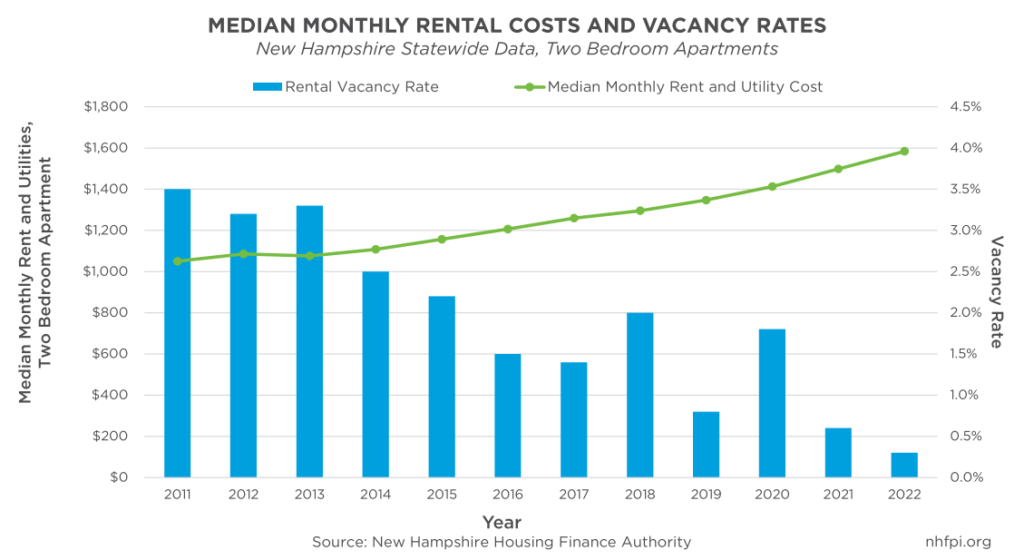
The housing shortage has significant impacts on renters in the Granite State as well. The two-bedroom rental vacancy rate, according to the New Hampshire Housing Finance Authority (NHHFA), was only 0.3 percent, based on data collected between March and May 2022. The vacancy rate for all New Hampshire rental units was estimated to be 0.5 percent, which was less than one tenth of the national average of 5.8 percent in the first quarter of 2022.[31] Monthly median rents for a two-bedroom unit also increased notably from 2021, up 5.7 percent over the previous year to $1,584.[32]
The 5.7 percent increase in median monthly rent for two-bedroom units is not as high as the 7.0 percent year-over-year inflation rate in the New England in April 2022, which is within the time period the NHHFA collected rental cost data. However, the year-over-year increase in median rent for two-bedroom units still outpaced the growth in average private-sector wages in New Hampshire between April 2021 and April 2022, which increased just 4.8 percent.[33] This disparity suggests a larger portion of the average worker’s paycheck has gone to pay for housing costs, particularly when that worker is in rental housing.
According to 2022 data from the NHHFA, which produces estimates by adjusting U.S. Census Bureau survey data collected from 2016-2020, median renter household income in New Hampshire was about $48,237 in 2022. Using a simple but reliable measure, the U.S. Department of Housing and Urban Development has historically defined families paying more than 30 percent of their income for housing as “cost-burdened.”[34] Based on this median household income for renters and using 30 percent of income as a benchmark for affordability, affordable monthly gross rent would be $1,206, and only an estimated 11 percent of two-bedroom units were listed below affordable market rent for the median-income renter, according to the NHHFA.[35] This calculation indicates that 89 percent of two-bedroom units were listed either at or above the affordable market rent for the median-income Granite State renter, putting affordable housing out of reach for many individuals and families in New Hampshire.
These issues particularly impact the economic mobility of families with low incomes. Access to affordable housing in high opportunity areas can help enhance the intergenerational economic mobility of children.[36]
Access to Childcare Remains a Challenge
Another significant barrier that workers in New Hampshire face is the high cost and lack of accessibility to caregiving services. The cost of child care in New Hampshire represents a significant portion of many families’ budgets.
According to Child Care Aware of America, which conducts surveys of the price of child care by state, the annual average price of center-based child care for a toddler in New Hampshire was $12,597 in 2020. This price was the equivalent of 10 percent of median income for a married couple with children under 18 in their households in New Hampshire. A two-parent household with both parents working full-time and earning wages at the 25th percentile in May 2020 without any other sources of income would face prices equal to approximately 21 percent of their combined annual income of about $60,900 to pay for a toddler in a child care center. For a single female-headed household with a child, the average price was the equivalent of 33 percent of that family’s median income.[37]
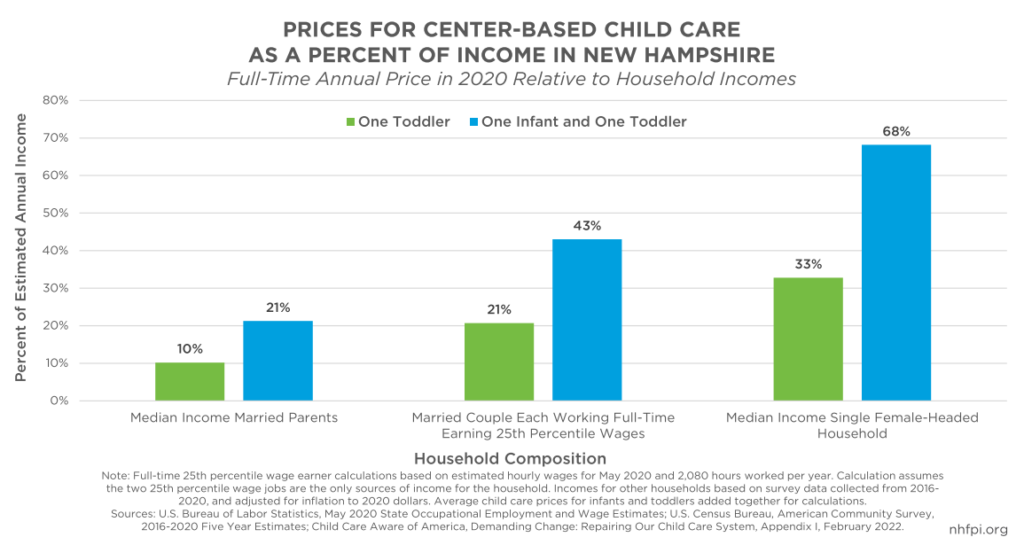
The price of child care for a median-income married couple with children in their household was the equivalent of 21 percent of the family’s income for center-based child care for both an infant and a toddler, with the price estimated for center-based infant care in 2020 averaging $13,609 for the year. For two full-time workers earning 25th percentile wages, the price for an infant and a toddler combined would be about 43 percent of their income. A median-income single female-headed household with two children faced an enormous burden of child care in 2020, with prices for center-based care for an infant and a toddler totaling the equivalent of 68 percent of the family’s household income.[38]
In addition to the cost burden that many low and moderate-income families in New Hampshire face, the availability of child care remains a hurdle for many families. A 2021 report examining constraints on the workforce’s recovery from the pandemic, commissioned by the New Hampshire Department of Health and Human Services, estimated that of the approximately 75,500 children under the age of six in New Hampshire during 2019, about 54,000 were in households with two working parents or in which there was only one parent who was also working.[39]
There were approximately 33,000 licensed child care slots for children under age six, which excludes school age children, as well as children in summer camps and parks and recreation programs, according to the Department’s commissioned analysis. These figures suggest a gap of approximately 21,000 children, or about 39 percent of those under age six in need of child care services, whose needs were addressed without formal child care. For those without formal, licensed child care services, families rely on other informal options of care, such as through family, friends, or neighbors.[40]
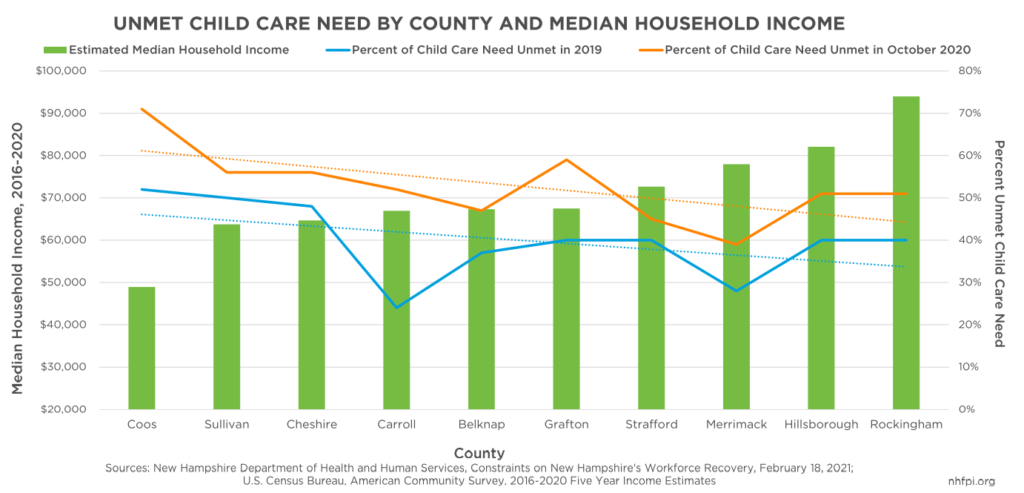
In 2019, the highest county-level rates of unmet childcare needs for children under six years of age were in Coos (52 percent), Sullivan (50 percent), and Cheshire (48 percent) counties.[41] These three counties also had the lowest estimated median household incomes in New Hampshire during the 2016-2020 time period.[42]
In 2020, following the onset of the COVID-19 pandemic, the unmet need for child care jumped significantly throughout the Granite State. Every county had a higher rate of unmet child care need in October 2020, with seven out of ten counties having an estimated unmet child care need above 50 percent.[43] Between 2019 and October 2020, the estimated percentage of child care needs that were unmet increased from 39 percent to 50 percent statewide. This analysis suggests that, in October 2020, New Hampshire only had half the formal capacity needed to provide licensed child care to children under the age of six in need of care.
Opportunities for Investment
The pandemic has exacerbated many of the challenges that Granite Staters face and has disproportionately impacted certain groups. Access to affordable housing remains a significant issue throughout the state, with few available housing units on the market, and even fewer at affordable prices for Granite Staters with low- and moderate-incomes. Nearly nine in ten two-bedroom apartments were not affordable to renters with median incomes, based on a key benchmark. Formal child care services remain out of reach for many Granite Staters, particularly those with low-incomes. In addition to these problems, inflation has eroded the purchasing power of workers’ earnings, and inflation-adjusted wages were lower in July 2022 than in July 2020. While these issues represent significant challenges to Granite Staters, there are policy options to help address these critical areas of need.
ARPA provided significant targeted assistance, policy changes, and key flexible aid to provide needed support and make strategic, long-term investments in Granite Staters and the economy.[44] The ACTC payments enacted by ARPA, which ceased providing monthly payments after December 2021, likely contributed to lower numbers of Granite Staters reporting difficulties paying for usual household expenses during that time. Reinstating the ACTC or other targeted relief may provide assistance to those Granite Staters struggling with higher costs of living resulting from inflationary pressures.
State, county, and municipal policymakers have significant latitude to make important investments with the flexible Coronavirus State and Local Fiscal Recovery Funds provided by ARPA. These strategic investments will not only help support Granite Staters in the long term, but also strengthen the overall economy as the recovery continues.
As of August 12, 2022, the State of New Hampshire has approximately $219.8 million in these flexible ARPA funds remaining of the original total allocated to the State government. Further investments in the workforce and affordable housing may help alleviate limited housing supply and high housing costs in the Granite State. As funding continues to be approved, policymakers may also consider allocating additional funds to support expanding formal child care offerings, particularly in regions with the lowest rates of accessible formal child care.
Although the economic landscape has improved since the beginning of the COVID-19 pandemic, workers throughout the Granite State still face many barriers to accessing high-quality employment.
New Hampshire has the continuing opportunity to allocate remaining federal funds to assist communities and working families to address these issues. Targeted investments can make an important contribution to helping Granite Staters secure affordable housing, high-quality employment opportunities, and accessible, reasonably-priced child care services. Key investments can also help create a more resilient, equitable, and inclusive economy that uplifts all Granite Staters.
Endnotes
[1] For more information on the COVID-19 crisis and the impacts of the policy response, see Recession Remedies, published by The Brookings Institution in April 2022.
[2] For the original legislation, see the Families First Coronavirus Response Act, the Coronavirus Aid, Relief, and Economic Security Act, and the American Rescue Plan Act of 2021. For summary analyses and additional resources, see NHFPI’s resource page The American Rescue Plan Act and New Hampshire: Recent and Updated Resources, as well as NHFPI’s March 27, 2020 blog Federal CARES Act to Provide Relief to Residents, $1.25 Billion to New Hampshire State Government.
[3] Data for October 2019 sourced from the Board of Governors of the U.S. Federal Reserve System’s May 2020 publication Report on the Economic Well-Being of U.S. Households in 2019, Featuring Supplemental Data from April 2020, page 21. Data from subsequent 2020 and 2021 surveys available in the Board of Governors of the U.S. Federal Serve System May 2022 report Economic Well-Being of U.S. Households in 2021, page 35.
[4] For more details, including crosstabulations for more levels of education and by race or ethnic identity, see the Board of Governors of the U.S. Federal Reserve System’s May 2020 publication Report on the Economic Well-Being of U.S. Households in 2019, Featuring Supplemental Data from April 2020, page 21. Survey data collected in late 2021, published in the Board of Governors May 2022 report Economic Well-Being of U.S. Households in 2021, show adults with family incomes below $25,000 were much less likely to be able to cover bills in that month than adults with family incomes above $100,000.
[5] For more information, see the Board of Governors of the U.S. Federal Reserve System’s May 2020 publication Report on the Economic Well-Being of U.S. Households in 2019, Featuring Supplemental Data from April 2020, page 22. For more information on income volatility, see NHFPI’s May 2019 Issue Brief Medicaid Work Requirements and Coverage Losses.
[6] New Hampshire unemployment rates based on preliminary data for July 2022 and revised data for prior months. These data are accessible through New Hampshire Employment Security’s GraniteStats portal. National data are available from the U.S. Bureau of Labor Statistics, including historical state-level data from January 1976 to the present, which is when the state-level unemployment data series began.
[7] The U.S. Census Bureau defines the labor force as “The civilian labor force consists of people classified as employed or unemployed.” The U.S. Bureau of Labor Statistics notes “The labor force includes all people age 16 and older who are classified as either employed and unemployed […]. Conceptually, the labor force level is the number of people who are either working or actively looking for work.” The Bureau states that “…people are classified as not in the labor force if they were not employed during the survey reference week and they had not actively looked for work (or been on temporary layoff) in the last 4 weeks.”
[8] Labor force estimates data retrieved on August 29, 2022 through New Hampshire Employment Security’s GraniteStats portal.
[9] Labor force estimates data retrieved on August 29, 2022 through New Hampshire Employment Security’s GraniteStats portal.
[10] For a synthesis of U.S. Census Bureau Household Pulse Survey data collected from New Hampshire residents between the summer of 2021 and early 2022, see NHFPI’s March 4, 2022 presentation The New Hampshire Economy in 2021 and 2022, slide 18. For estimates on the impacts of long-term COVID-19 illness on the labor force, see the Brookings Institution’s August 2022 report New Data Shows Long Covid is Keeping as Many as 4 million People Out of Work.
[11] Estimated population counts for July 1, 2021 by age for the nation and each state calculated by the U.S. Census Bureau’s Population Estimates Program.
[12] For New Hampshire data, see NHFPI’s August 2019 Issue Brief New Hampshire’s Workforce, Wages, and Economic Opportunity and NHFPI’s March 4, 2022 presentation The New Hampshire Economy in 2021 and 2022. For national data, see both the U.S. Bureau of Labor Statistics employment projections for the civilian labor force participation rate, last modified September 8, 2021, and Table A-8b from the Current Population Survey, last modified August 5, 2022.
[13] To access these data, see the New Hampshire Department of Business and Economic Affairs, Office of Planning and Development September 2022 report State, County, and Municipal Population Projections: 2020-2050, accessible on the Office of Strategic Initiatives website.
[14] For the original analysis, see the August 20, 2020 COVID-19 Unemployment Update from New Hampshire Employment Security.
[15] See the June 2022 New Hampshire Employment Security report The Great Resignation: Assessing Changing Labor Markets.
[16] See the June 2022 New Hampshire Employment Security report The Great Resignation: Assessing Changing Labor Markets.
[17] Analysis of job changes by industry comparing individual months based on Current Employment Statistics program data published by New Hampshire Employment Security and retrieved on August 29, 2022.
[18] For more information on this sector, see the U.S. Bureau of Labor Statistics, Information: NAICS 51, accessed August 19, 2022.
[19] For additional analysis, see the July 28, 2022 Pew Research Center report Majority of U.S. Workers Changing Jobs Are Seeing Real Wage Gains.
[20] See the publication titled Consumer Prices Up 9.1 Percent Over the Year Ended June 2022, Largest Increase in 40 Years, released by the U.S. Bureau of Labor Statistics on July 18, 2022 and based on the June 2022 Consumer Price Index for All Urban Consumers.
[21] The U.S. Department of Labor provides a history of the minimum wage, including the July 24, 2009 increase.
[22] Minimum wage calculations completed using the Consumer Price Index-Urban, Northeast, which includes Connecticut, Maine, Massachusetts, New Hampshire, New Jersey, New York, Pennsylvania, Rhode Island, and Vermont.
[23] Calculations completed assuming a full-time minimum wage worker is paid for each hour, works 40 hours per week, and works a full week for 52 weeks per year.
[24] For more analysis of household financial well-being in 2021 relative to prior years, see Board of Governors of the U.S. Federal Reserve System May 2022 report Economic Well-Being of U.S. Households in 2021.
[25] For more information on ARPA programs, see NHFPI’s March 26, 2021 blog Federal American Rescue Plan Act Directs Aid to Lower-Income Children, Unemployed Workers, and Public Services, as well as NHFPI’s February 2022 Issue Brief Public Benefit Navigators Can Help Granite Staters Access Federal Assistance and Support the Economy. For additional analysis of the Child Tax Credit, see NHFPI’s March 2022 Issue BriefExpansions of the Earned Income Tax Credit and Child Tax Credit in New Hampshire.
[26] See NHFPI’s July 26, 2022 blog Ability to Afford Household Expenses Falls After Key Aid Expires. These data have since been updated to reflect the most recent data from the Household Pulse Survey, collected between July 27 and August 8, 2022.
[27] Monthly single-family home and condo sales data are available from the New Hampshire Association of Realtors in NH Monthly Indicatorspublications.
[28] See the New Hampshire Association of Realtors NH Monthly Indicators reports for July 2022 and July 2021.
[29] See the New Hampshire Association of Realtors NH Monthly Indicators reports, including for July 2022.
[30] See the New Hampshire Association of Realtors NH Monthly Indicators reports, including for July 2022. Condo inventory was 0.6 months in February 2022 as well as January 2022.
[31] These U.S. Census Bureau data were accessed through the Federal Reserve Bank of St. Louis in August 2022.
[32] The New Hampshire Housing Finance Authority’s 2022 Residential Rental Cost Survey Report provides additional information regarding recent and historical costs for rental housing in New Hampshire.
[33] Average private sector monthly wage data calculated based on the Current Employment Statistics survey data published by New Hampshire Employment Security, accessed during August 2022, and adjusted for inflation using the U.S. Bureau of Labor Statistics Consumer Price Index-Urban, New England using April 2021 and April 2022 figures, accessed August 2022.
[34] For more information on the 30 percent benchmark and additional sources describing its use, see NHFPI’s May 4, 2022 blog Worsening Housing Shortage Reduces Access to Affordable Homes in New Hampshire.
[35] Reference data from NHHFA’s 2022 Residential Rental Cost Survey Report, page 12.
[36] Director of Opportunity Insights and Harvard University economics professor Raj Chetty provided informational testimony to the U.S. House of Representatives Financial Services Committee on October 21, 2021 that outlined research regarding intergenerational upward mobility as a result of children living in neighborhoods with more opportunity.
[37] Full-time 25th percentile wage earner calculations based on estimated hourly wages for May 2020 and 2,080 hours worked per year. This calculation assumes the two 25th percentile wage jobs are the only sources of income for the household. The 25th percentile wages were hourly wages for all occupations from the U.S. Bureau of Labor Statistics, May 2020 State Occupational Employment and Wage Estimates for New Hampshire, accessed August 30, 2022. Median income for households with a married couple and at least one of their own children under 18 years old in the household, as well as for households headed by a single woman with her own child or children under 18 years old present, from the U.S. Census Bureau, American Community Survey, Table B19126, 2016-2020 estimates for New Hampshire. Average center-based child care prices for infants and toddlers in New Hampshire published by Child Care Aware of America based on that organization’s state-level survey data. The most recent data were published in February 2022 in the publication Demanding Change: Repairing Our Child Care System, with state-by-state data provided in Appendix I. This analysis adds together prices for one infant and one toddler for the income-relative calculations.
[38] See endnote 37 for the methodology of these calculations.
[39] The report that included this analysis, Constraints on New Hampshire’s Workforce Recovery, was the result of a contract with the State of New Hampshire, including a collaborative effort between New Hampshire Employment Security and the Department of Health and Human Services and published in February 2021. The analysis was conducted by Econsult Solutions Inc. and the National Center for Children in Poverty at the Bank Street Graduate School of Education. Estimates for the number of children under age 6 in New Hampshire and the number that were in need of child care are on page 63.
[40] See page 63 of the Constraints on New Hampshire’s Workforce Recovery report referenced in endnote 39.
[41] See page 65 of the Constraints on New Hampshire’s Workforce Recovery report referenced in endnote 39.
[42] Median household income data by county is from the U.S. Census Bureau’s American Community Survey 2016-2020 Five Year Estimates, Table DP03. The point estimates used to rank county median household incomes are the center point of a range of estimates within the margin of error calculated by the U.S. Census Bureau. As a result, some counties are statistically indistinguishable from one another at the 90 percent confidence level. Margins of error are reported by the American Community Survey.
[43] See page 84 of the Constraints on New Hampshire’s Workforce Recovery report referenced in endnote 39.
[44] For more information about ARPA and New Hampshire, see NHFPI’s March 26, 2021 blog post Federal American Rescue Plan Act Directs Aid to Lower-Income Children, Unemployed Workers, and Public Services and NHFPI’s resource page The American Rescue Plan Act and New Hampshire: Recent and Updated Resources.