KEY POINTS
-
- The New Hampshire economy entered 2025 with key strengths, but both the state and national economies may be reaching an inflection point this year
- Job growth generated by employers in the state appears to have stalled in 2025, and a smaller number of residents report being employed
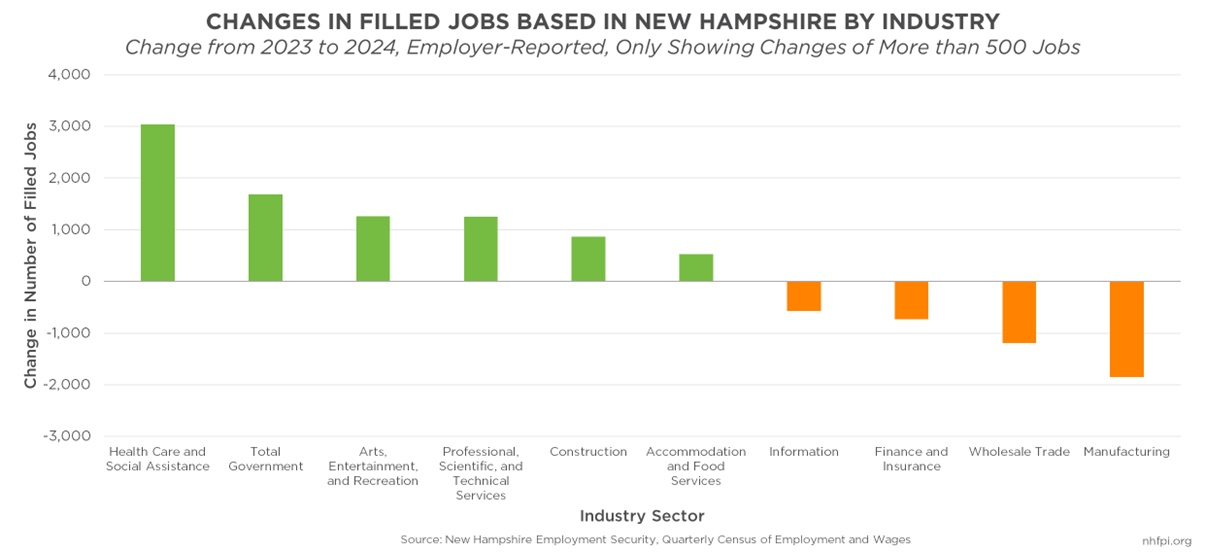
- Recent job growth has been strongest in health care and social assistance, while manufacturing and trade-related employment has declined
- The state’s labor force continued to grow, easing the workforce shortage and trending with higher unemployment and underemployment rates in New Hampshire
- The largest recent changes in the national economy appear to be associated with federal trade policy changes, potentially impacting the imports to New Hampshire, which were valued at $10.2 billion in 2024
- International migration accounted for slightly more than half of the state’s population growth from 2010 to 2024, while deaths outnumbered births during this period
The economy, both nationally and in New Hampshire, entered 2025 with significant strengths and key challenges, and now faces new uncertainties at a potential inflection point.
The long-term challenges that have been particularly acute in the New Hampshire economy, including housing affordability, child care accessibility, and the state’s demographic profile, continue to hold back further growth. Despite these challenges, both the state and national economies had a relatively favorable 2024. New Hampshire’s labor force grew faster than it had in any year since 2018, and while the cost of housing continued to climb, labor market data suggested employers were having an easier time finding workers than they had in 2023 or 2022.
However, in the first half of 2025, job growth in New Hampshire appeared to stall. While subject to future revision, available data for 2025 suggest employers in New Hampshire are not laying off employees at a particularly fast pace, indicating that many businesses are likely holding off on hiring more people due to economic uncertainty. Recent job growth has been primarily driven by hiring in health care and social assistance jobs, while manufacturing employment and retail and wholesale trade jobs have been disappearing. National economic indicators also show relatively tepid economic and job growth thus far in 2025.
The biggest shifts in the national economy appear to be in response to changing federal policies related to trade, particularly tariffs. These taxes on businesses that import goods into the United States from other countries have likely changed business purchasing behavior, and may be putting upward pressure on consumer inflation. While different economic indicators do not show exactly the same trends, incomes in New Hampshire appear to be outpacing inflation to only a limited extent at best, with average wages falling behind the cost of living in the less favorable data during the past year and a half.
With slower rates of hiring and more people actively looking for work, the state’s unemployment rate has increased to the highest levels since 2015, outside of the relatively brief spike associated with the COVID-19 pandemic. A broader measure of underemployment has also increased substantially during the last year.
The long-term challenges facing New Hampshire’s economy persist, particularly the high housing and early care and education prices that restrict workforce growth. The state continues to rely on in-migration, including international migration, for population growth as deaths in the state substantially outnumber births. But with the national economy potentially changing course, New Hampshire’s workers and businesses may have new challenges to face in the coming year. This Issue Brief explores available data for New Hampshire that may provide some indication as to the recent and future course of the state’s economy.
National Economic Context: An Inflection Point?
New Hampshire’s economy, relative to the national and regional economies around it, is relatively small, and is impacted substantially by the broader trends influencing the economies of those larger geographies. New Hampshire’s Gross State Product, a measure of the size of the economy, was an estimated $121.2 billion in 2024, which was the equivalent of 0.42 percent of the U.S. Gross Domestic Product of $29.18 trillion. While New Hampshire has the third-largest economy among the New England states, New Hampshire’s Gross State Product was an estimated 8.1 percent of the six-state region’s economy by this measure in 2024; the Massachusetts economy was about 6.4 times the size of New Hampshire’s and Connecticut’s was about three times larger.[1] The success of New Hampshire’s economy is greatly dependent on the decisions and financial well-being of people beyond the state’s borders.

Early data suggest the national economy weakened in the first half of 2025. U.S. Gross Domestic Product during the first two quarters of 2025 was substantially affected by swings in imports, likely reflecting U.S. businesses responding to potential and actual changes in tariffs. Gross Domestic Product, as a measure, treats exports as a positive for the size of the U.S. economy, and imports as a negative. U.S. companies imported more goods and built up inventories in the first quarter of the year, which was followed by imports returning to normal levels, a reduction in inventories, and little change in exports in the second quarter.[2]

Tariffs are taxes on U.S. companies based on their imports, and the cost may be passed on to consumers. Cost increases for consumers are most likely to have larger impacts on households with lower incomes. The federal government has increased the effective overall tariff tax rate to about 18 percent as of August 7, 2025, from a comparable rate of 2.4 percent in January, according to The Budget Lab at Yale University. The Tax Policy Center estimates that the average taxpayer will have about $2,700 more in costs in 2026 due to tariffs based on policies in place on August 18, 2025.[3]
Businesses likely imported more goods in the first quarter of 2025 to avoid tariffs that took effect in early April. As those inventories are depleted, some companies may reduce profit margins to keep prices lower, but many costs will likely be passed on to people buying products within the United States in the coming months. Recent indicators of consumer inflation have suggested moderate but somewhat elevated inflation, and recent jumps in costs to businesses producing consumer goods suggest more price increases may be coming.[4]
According to New Hampshire Employment Security, businesses in New Hampshire imported about $10.2 billion worth of goods from other countries in 2024, which was the equivalent of about 8.4 percent of Gross State Product that year. Some of the largest sources of those goods were Canada ($1.9 billion), Japan ($1.0 billion), Poland ($990 million), Germany ($880 million), Mexico ($600 million), and China ($530 million). Aerospace products accounted for about $3.3 billion in imported goods value, while non-electrical machinery ($1.2 billion) and computer and electronic products ($1.0 billion) also comprised high-value import categories in 2024. Nearly all of the approximately $500 million of petroleum and coal products imported were from Canada, according to New Hampshire Employment Security.[5]
National job growth appears to have slowed considerably since April 2025. Preliminary data suggest employers nationally added 35,000 jobs per month, on average, over the last three months. That compares to 127,000 per month during the three months (February, March, and April) immediately preceding this period, and 123,000 monthly during the same period in 2024. This slower job growth may be the result of businesses hiring fewer workers due to economic uncertainty, fewer available workers from reduced immigration to the United States, or a combination of these and other factors. For example, businesses may be responding to a slowdown in consumer spending thus far in 2025 by deferring previous hiring plans.[6]

These indicators are not conclusive, but suggest the economy may be at an inflection point. The economy likely avoided a contraction in late 2022 and 2023, despite forecasts, in part because of immigration bringing more workers and consumers into the economy. Consumer spending also remained strong, fueled partly by savings from changes due to the COVID-19 pandemic and wage growth for lower-wage workers.[7] If weak job growth persists or worsens while inflation remains elevated, the demographic and cost-of-living headwinds that threatened an economic recession in 2022, alongside contemporary challenges, could overwhelm the national economy’s momentum.[8]
Job Growth in New Hampshire Stalls
While job growth has weakened nationally, New Hampshire may already be experiencing job losses during 2025. All official monthly employment data undergo a revision and benchmarking process to make them more accurate, but seasonally-adjusted data available for 2025 thus far show a decline in the number of employed New Hampshire residents relative to the end of 2024 and the beginning of 2025.[9] The average number of employed residents during the first six months of 2025 was about 753,500 residents, slightly above the July through December 2024 average of approximately 735,200 employed residents, based on survey data collected from people in New Hampshire. The granular, month-by-month figures suggest seasonally-adjusted employment peaked at about 754,700 Granite Staters in January 2025, and preliminary July 2025 employment was about 870 jobs fewer than July 2024’s estimate.[10]
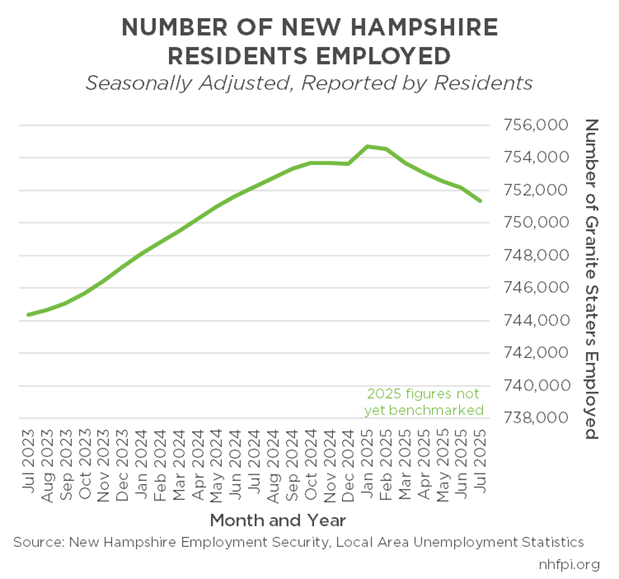
The seasonal adjustment accounts for variations in employment patterns throughout the year; for example, the number of employed Granite Staters typically peaks in July of each year, and seasonal adjustments seek to smooth out the cyclical variations to understand underlying economic trends. The July 2025 preliminary estimate of 757,500 employed residents without the seasonal adjustment was about 4,200 higher than July 2023, but 3,200 lower than July 2024.
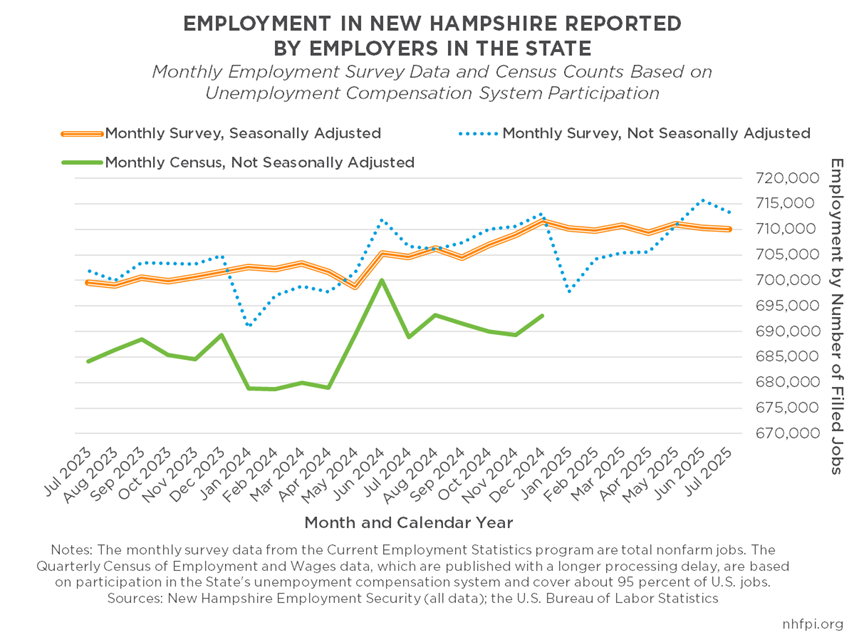
Data reported from employers in New Hampshire, rather than residents, do not show a clear decline in jobs in the state, but do show a pause in job growth after the seasonal adjustment. While monthly surveys of businesses suggest that employment has risen to a slightly higher level this year than it did last summer, the seasonally-adjusted data indicate employment growth in New Hampshire jobs has stalled since December 2024. From January to July 2025, businesses reported a seasonally-adjusted average employment of about 710,200. January’s reported figure was also 710,200, while June’s was 710,300 and July’s was 710,100, suggesting steady employment but not the growth observed during 2024, when seasonally-adjusted employment rose about 2,000 between the January and July estimates. While delayed relative to the monthly survey data due to longer processing times, the more precise quarterly employment counts based on unemployment compensation program participation show growth in 2024 relative to 2023, but do not provide insights yet into 2025.[11]
Unemployment compensation claims data provide some insight into the lack of job growth in recent months. If many individuals were being laid off, and those job losses were offset by job growth at other businesses, initial claims for unemployment compensation might be elevated as individuals who lost their jobs would apply for unemployment compensation. Initial monthly unemployment claims averaged about 158 claims, or 7.8 percent, higher in the first seven months of 2025 than the same period in 2024, but that increase was smaller than the 9.6 percent increase for comparable periods between 2022 and 2023. Continued weeks of unemployment benefits claimed by New Hampshire workers rose from an average of 14,087 per month in the first seven months of 2024 to 16,304 in the same period of 2025, a 15.7 percent increase. However, that increase was also smaller than the annual increases in comparable periods across the two previous years.[12] These data suggest that, in the absence of a large increase in the number of people losing jobs, employers may be keeping existing workers but not hiring many new ones or expanding their capacity, indicating potential economic uncertainty.
Economic and Job Growth in Neighboring States
If job growth did reach an inflection point in New Hampshire in early 2025, data from neighboring states also suggest job growth may be slowing in 2025. New Hampshire, Vermont, and Maine all saw job growth during the year ending in June 2025 relative to the prior year, with New Hampshire’s job growth ranking the fastest at 1.1 percent (representing 7,400 jobs), based on survey data collected from employers operating in the state. Massachusetts employers reported a slight aggregate decline in employment (0.1 percent, 3,100 jobs) across these two periods.
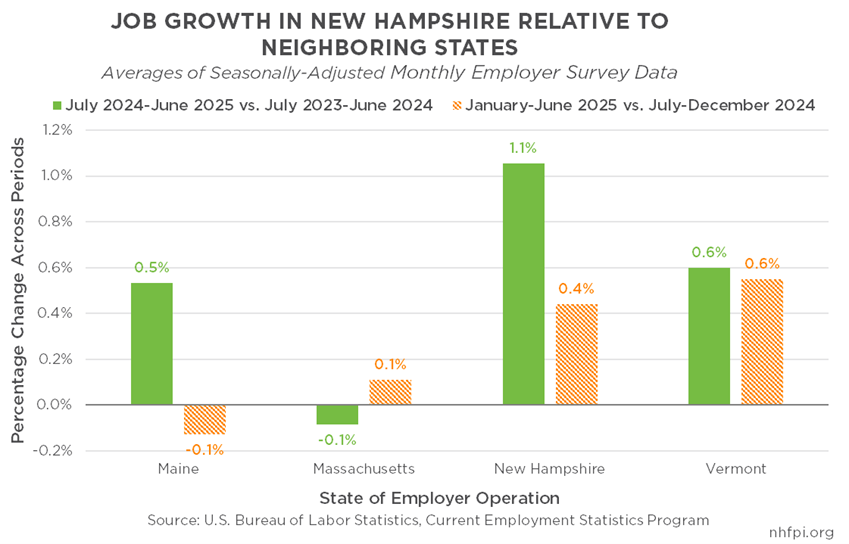
Using only the early 2025 data, job growth slowed across all four states relative to the whole year, except in Massachusetts. Massachusetts had 0.1 percent growth (about 4,100 jobs) between the last six months of 2024 and the first six months of 2025, using seasonally-adjusted averages. Job growth slowed in New Hampshire and its other neighbors, with Vermont having the fastest rate growth (0.6 percent, 1,700 jobs) outpacing New Hampshire’s 0.4 percent (3,100 jobs). Maine lost about 830 jobs (-0.1 percent) from the last half of 2024 to the first half of 2025. These 2025 data are all subject to revisions in the benchmarking process, but indicate that job growth may be slowing throughout northern New England in 2025.[13]
A longer view of overall economic growth indicates that New Hampshire has had substantial Gross State Product growth relative to some neighbors, but not all. Between 2019 and 2024, U.S. Gross Domestic Product increased by 12.5 percent after adjusting for inflation. Inflation-adjusted Gross State Product grew 14.3 percent in New Hampshire during this period, outpacing the U.S. as a whole and neighboring Massachusetts (11.9 percent) and Vermont (8.1 percent). Maine’s economic growth during this period, at 16.1 percent, was the fastest in New England.[14]
Job Changes by Sector Show Health and Social Assistance Leading Job Creation
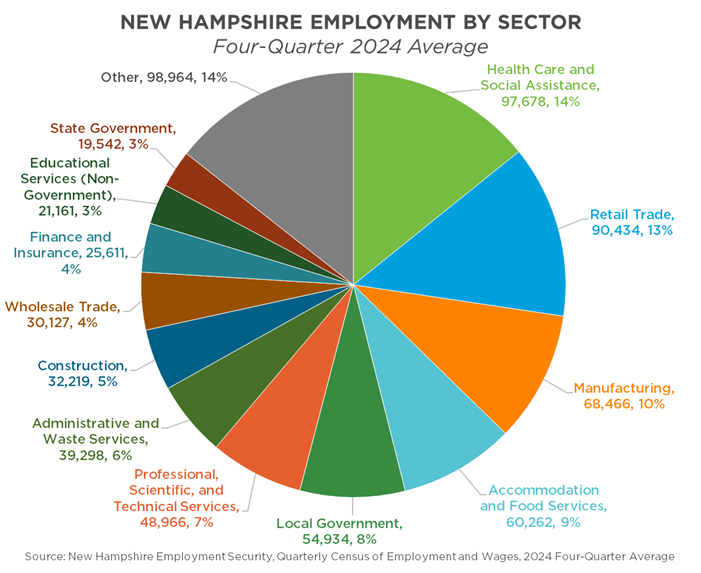
The largest employment sector in New Hampshire in 2024 was Health Care and Social Assistance. This sector grew past Retail Trade to become the largest employment sector in the state in 2019, and has maintained that position since that year.[15] However, no single industry is dominant in New Hampshire’s employment, with only Health Care and Social Assistance, Retail Trade, and Manufacturing accounting for more than 10 percent of filled jobs based in the state. However, those three industries with Accommodation and Food Services and Local Government totaled more than half of employment based in New Hampshire during 2024. Economies can be more resilient to economic downturns and the consequences of failure in a single industry with substantial employment in a variety of sectors, and New Hampshire’s diverse array of major employment sectors suggest the state may be better positions to withstand a sector-based economic contraction.
Recent job growth has been fueled by the continuing increase in Health Care and Social Assistance employment. Data based on unemployment compensation program participation showed an average of 682,265 jobs based in New Hampshire across all sectors in 2023, and 687,661 in 2024. That increase of 5,396 jobs was not distributed evenly across industries. Health Care and Social Assistance alone added 3,039 filled positions, followed by an increase in combined New Hampshire-based employment in Federal, State, and Local Governments (1,682); Arts, Entertainment, and Recreation (1,262); and Professional, Scientific, and Technical Services (1,254). Industry-level job losses were largest in Manufacturing (-1,846) and Wholesale Trade (-1,188).
Seasonally-adjusted, unbenchmarked data solely from early and mid-2025, however, suggests some changes in these industry-level trends in New Hampshire. Between January 2025 and July 2025, total nonfarm payroll employment in New Hampshire declined by a net of 100 jobs. The largest sector-level declines were in Accommodation and Food Services (-2,500), both Wholesale (-800) and Retail (-900) Trade, and Arts, Entertainment, and Recreation (-500). The largest increases were in Health Care and Social Assistance (1,600) and Private Educational Services (1,300). If these data hold through the revision and benchmarking processes, they will suggest that Health Care and Social Assistance continues to be vital for overall employment growth, while Manufacturing (+200 jobs) may have stabilized even as Construction (-300 jobs) weakens, and former growth sectors tied to discretionary expenditures and tourism may be atrophying. Industries related to the movement and sale of goods may also be contracting, potentially related to increased international trade costs and limited consumer spending growth.[16]
Labor Force Constraint Easing Relative to Prior Years, and Unemployment Rises
For most of the last ten years, the primary constraint on New Hampshire’s economic growth has been a lack of labor force relative to the number of job opportunities in the state.[17] However, as there are other signs the economy may be weakening, this labor force constraint may be entering a short-term period of easing, even as long-term demographics continue to suggest the need for workers will be larger than the available workforce.[18]
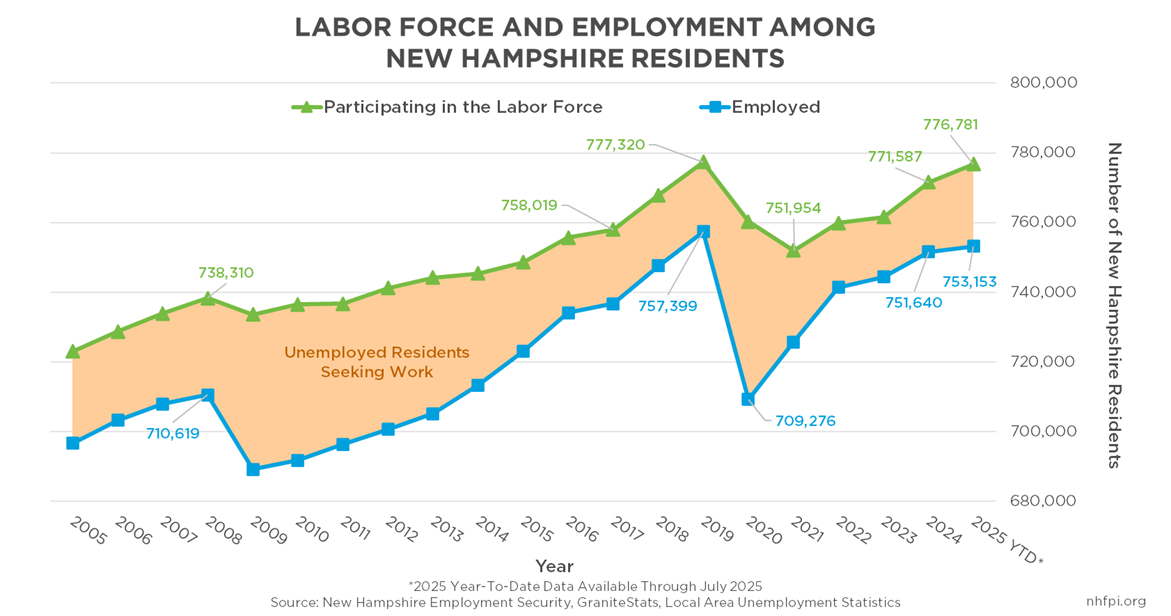
New Hampshire’s labor force includes people who are working, either full time or part time, and those who are unemployed but who are actively seeking work. The labor force grew in 2024 by approximately 1.3 percent to about 771,600, which was significant growth relative to the 0.2 percent in the prior year and was the fastest growth rate since at least 2018. The 2010-2019 annual average labor force growth rate was 0.6 percent, suggesting the faster rate in 2024 was an indicator that the labor force was continuing to rebound from the COVID-19 pandemic. However, data suggest the labor force has not yet substantially surpassed its 2019 peak even as the overall economy has continued to grow and the pre-pandemic trajectory showed labor force growth.
Labor force growth has continued into 2025, according to preliminary and unbenchmarked data. The average size of the labor force in the first seven months of 2025 was about 776,800 people, or about 0.7 percent higher than the 2025 average. However, the growth in the number of people employed was only 0.2 percent, leaving more workers who are engaged in the labor force in the unemployed category and actively seeking work. In 2025, the unemployment rate in New Hampshire rose above three percent for the first time in almost ten years, outside of the fast-moving impacts of the COVID-19 pandemic.
The number of people unemployed in New Hampshire, defined as those without a job but who were available to work and had looked for employment in the last four weeks, has increased. The average number of people unemployed during 2024 was about 19,800 people, but the average in the first seven months of 2025 has been an estimated 23,600. Among other significant impacts on individuals and families, the estimated poverty rate is much higher for unemployed working-age Granite Staters (23.6 percent) than for those with part-time (11.1 percent) or full-time (1.0 percent) work during 2023.[19]
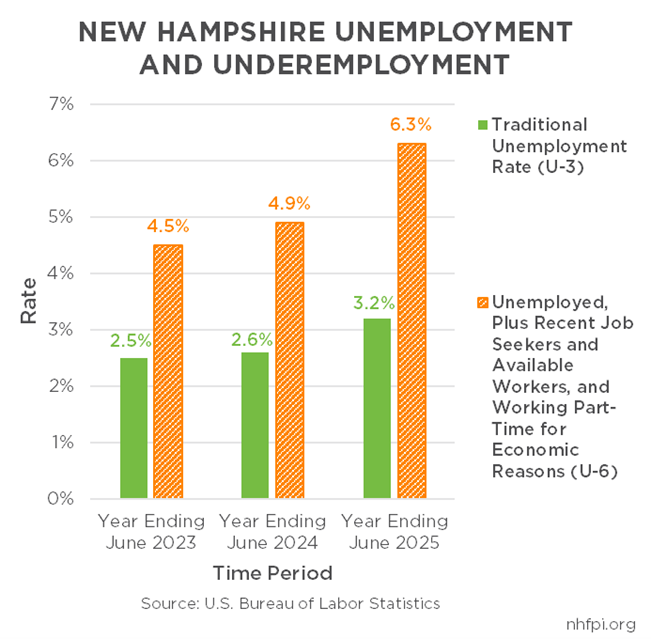
Another sign of a potential decrease in demand for labor and weakening employment prospects for Granite Staters is an increase in a broader measure of underemployment calculated by New Hampshire Employment Security and the U.S. Bureau of Labor Statistics. This measure includes workers traditionally considered unemployed as well as those who have been discouraged by job opportunities and have not looked for work recently, but have either worked or sought work in the last year, and people who are working part time for economic reasons but would prefer to work full time. Based on this broader measure, the number of workers who have not had success finding the employment they are seeking has increased substantially in the last year. For the year ending in June 2024, this broader rate of underemployment was 4.9 percent, but rose to 6.3 percent for the year ending in June 2025. That increase suggests greater numbers of Granite Staters are not finding suitable work in recent months relative to one or two years prior to 2025.[20]
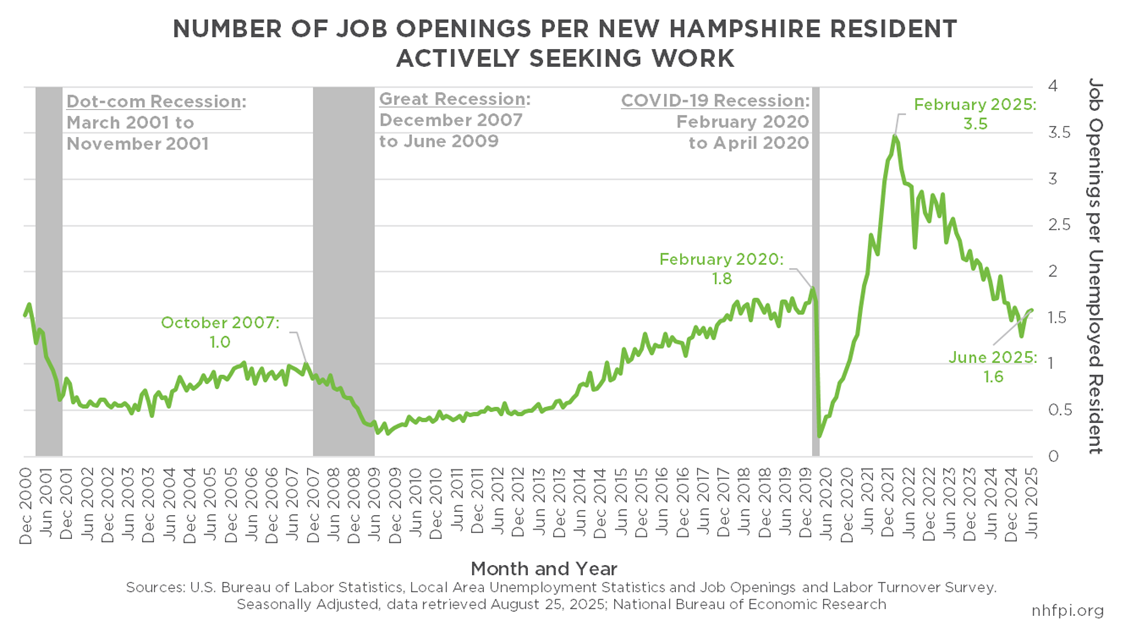
Rising unemployment suggests less demand for labor in the New Hampshire economy and slowing economic growth. While many datasets are helpful for understanding the dynamics of the workforce and the economy, one indicator that points specifically to the acuity of labor force constraints is the ratio of job openings to unemployed workers in the economy. These data suggest employers can more easily find workers now compared to three years ago, and even potentially relative to just before the COVID-19 pandemic.[21]
In February 2020, there were 1.8 job openings in New Hampshire for every unemployed worker. That number dropped to 0.2 job openings for every unemployed worker just two months later due to the impacts of the pandemic, but rebounded quickly to peak at 3.5 job openings per unemployed worker in February 2022. Those high levels reflected a profound lack of available workers to fill needed jobs. Since that time, the imbalance between unemployed workers and open jobs has declined; in March 2025, there were an estimated 1.3 open jobs for every unemployed Granite Stater. The most recent data estimates 1.6 job openings per unemployed worker in June 2025, which indicates a labor market that is much closer to being balanced than three years prior, but still facing a shortage of workers.
The size of the labor force has increased, but not uniformly by age group. Between the year ending June 2024 and the year ending June 2025, the number of Granite Staters participating in the labor force increased by about 4,900 people. The labor force participation rate, which reflects the percentage of the population over age 15 years that is working or actively seeking work, also increased by 0.1 percentage points to 65.0 percent. However, many Granite Staters age 16 to 19 left the labor force, in large part because fewer of these teenagers lived in the Granite State in the more recent period than in the one before, according to data provided by New Hampshire Employment Security. However, the labor force participation rate declined for all age groups age 16 to 44, while it rose for individuals age 45 to 64. The number of workers age 25 to 34 and 35 to 44 increased, potentially because of more Granite Staters aging into these groups or moving into the state, allowing the population to grow even while the participation rates dropped slightly. About 22.2 percent of Granite Staters age 65 and older participated in the labor force and comprised 8.8 percent of all workers in the year ending June 2025, according to these data.

Using a different dataset allows measuring the change in the labor force by county between two earlier periods. The labor force expanded in every county between 2023 and 2024, according to survey data from households. However, that expansion varied among the counties, with the lowest growth in Hillsborough and Cheshire counties, incorporating the south-central and southwestern parts of the state. The data suggest the labor force expanded the fastest in Grafton and Sullivan counties in northwestern and west-central New Hampshire. Inflation-adjusted median wages, however, grew fastest in rural northern and western New Hampshire and in southeastern New Hampshire, which does not necessarily reflect the changes in relative labor force constraints. However, these wage changes could be in response to changes in costs of living, particularly housing cost increases in certain rural areas, as well as more robust economic activity in southeastern New Hampshire.[22]

Average Wages and Incomes Struggling to Keep Up With Inflation
While inflation is more limited than it was in 2022, it has remained elevated relative to before the COVID-19 pandemic. When the cost of goods and services increases faster than income growth for households, the real spending power of individuals and families decreases. The decline in purchasing power may be happening for many New Hampshire families in 2025.
While average private sector wage data do not reflect wages for all workers and may be disproportionately affected by changes for higher-income workers relative to median wages, their timely availability on a monthly basis allow for comparisons with recent inflation rates. The average private-sector wage in New Hampshire fell behind inflation, as measured for consumers in the Northeastern United States, in both 2022 and 2024. In the first seven months of 2025, growth in the average wage fell behind inflation again, reducing purchasing power by an estimated 2.0 percent relative to 2024.[23]

Personal income, a broader measure of the resources flowing to individuals and households that accounts for both employment and other income, grew faster than inflation in the last year, but only slightly in New Hampshire.[24] For the year ending March 2025, inflation-adjusted personal income per person in New Hampshire increased by $359, or 0.4 percent, compared to the year ending March 2024. That growth suggests, even as income from work may not be outpacing inflation, overall average income is keeping up, although it may be disproportionately impacted by individuals with significant passive income from capital or other non-employment sources. In other words, personal income growth may be disproportionately impacted by higher-income households benefitting from capital gain, business, or dividend income, rather than hourly wages or salaries.
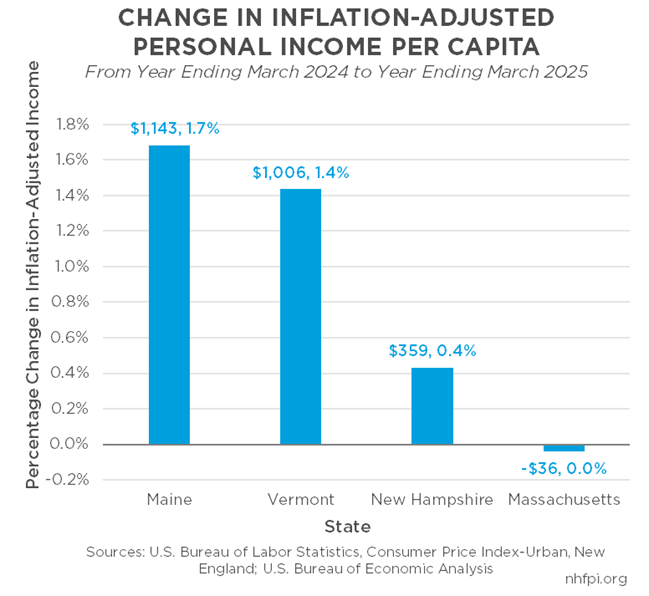
Personal income growth in New Hampshire kept ahead of both inflation and personal income per capita in Massachusetts, where there was essentially no change in this income relative to inflation. However, personal income per capita grew substantially faster in Vermont (1.4 percent, $1,006) and Maine (1.7 percent, $1,143) than in New Hampshire (0.4 percent, $359) between these two years.
Long-Run Constraints: Housing, Child Care, and Demographics
New Hampshire continues to face the economic constraints that have been impacting the economy for years: a lack of affordable housing, costly child care, and a demographic profile that has already been contributing to a workforce constraint as more Granite Staters reach traditional retirement ages.[25] With the broader economy at a potential inflection point, some of these challenges may ease while others could become more severe.
The lack of access to affordable, high-quality child care has impacted the ability of families to engage in the workforce and to meet their expenses. The average cost of tuition for an infant and a four-year-old in center-based care in New Hampshire was about $29,800.[26] An average of 17,300 Granite State adults reported they were not in the labor force because they were caring for a child not in school or a child care setting during 2024, which was almost as many as reported being unemployed in the state that year. NHFPI analysis from February 2025 indicated the shortage of available child care slots relative to estimated need cost the New Hampshire economy between $158.5 million and $247.5 million in wages, business income, and government tax revenues during 2023.[27]
Housing costs in the state continue to increase. Even as national indicators suggest the housing market elsewhere may be easing, data describing New Hampshire continue to show very limited inventory and uneven but continuing price growth.[28] Buying a median priced house in New Hampshire during the first seven months of 2025 meant facing a $535,000 expense.[29] Interest on mortgage loans exacerbated the costs of buying a home. Assuming a five percent downpayment, the average municipal property tax rate in the state, and the average 30-year mortgage interest rate, the monthly payment associated with buying the median-priced New Hampshire house was $4,063 for the first seven months of 2025, which was more than double the cost in 2019 and 171 percent higher than the equivalent costs in 2015.[30]

The rental market provides little relief from high prices, especially for renters with lower incomes. About half of renters paid more than 30 percent of their incomes to rent and utilities in 2023. Data from 2019-2023 showed more than half of the 31 percent of renter households in New Hampshire with less than $35,000 in income paid more than half of their incomes in rent and utility payments.[31] These high housing costs limit the ability of households to afford other goods and services in the economy, save for future costs, or even move to New Hampshire if they are considering relocating to the state.

The movement of people to New Hampshire from other places is critical for the state’s economy and workforce. Between 2010 and 2024, about 2,600 more people passed away in New Hampshire than were born in the state. In 2022, 2023, and 2024 each individually, New Hampshire had more than 2,200 fewer births than deaths, and no year has had more births than deaths since 2016. As a result, New Hampshire relies on in-migration to support population growth in the state.
International migration has provided more than half of the state’s population growth from 2010 to 2024, and has been the most consistent source of population growth during this period. Over 42,200 more people moved to New Hampshire from other countries during this period than moved from the state to other countries. Domestic migration, or people moving from other U.S. states to New Hampshire, produced a net increase of about 41,000 people, with substantial growth in the years following the COVID-19 pandemic.[32]
New Hampshire is tied with Vermont for the second-highest median age among the states in the country, and had the fourth-largest increase in its median age of any state last decade. More than 200,000 Granite Staters are within ten years of the traditional retirement age of 65 years.[33] Without migration to New Hampshire, the state’s economy will face both short- and long-term challenges to the economy, and both housing and child care remain key constraints on growth in the labor force.
Looking Back and Ahead from a Potential Turning Point
New Hampshire’s economy has some of the key strengths and constraints that it has experienced for most of the past decade. Employers can face difficulty finding workers in a tight labor market, the high costs for housing and early care and education hold back workforce growth and dramatically impact family budgets, and the state relies on in-migration to avoid population declines. These factors compound to make living in the New Hampshire economy challenging for many businesses, workers, and other Granite Staters, particularly the nearly 100,000 living with incomes below the poverty level and the one-in-four New Hampshire households that had less than $50,000 in income during 2023.[34] These challenges to financial security continue, and may become more severe as the state’s demographics constrain the workforce and if housing construction continues to be outpaced by growing demand.
However, the state and national economies may be at a turning point in 2025. Employment growth in New Hampshire appears to have at least stalled, and national employment growth has slowed significantly. Economic uncertainty, particularly associated with trade and immigration policies, could be giving businesses reason to pause expansion in the face of higher costs, and consumers may see more price increases for imported goods. The combination of higher prices and a job market that offers fewer opportunities, particularly for increases in compensation that outpace overall inflation, could leave many Granite State families in more difficult economic circumstances.
Some of these early 2025 employment data may be revised substantially, and no definitive evidence of an ongoing or imminent recession exists. However, inflation remains elevated, employment appears to have weakened substantially in New Hampshire and nationally, and Granite Staters still face higher costs for living essentials, such as housing and caregiving needs. New Hampshire’s economy appears to have been hit with substantial headwinds.
Endnotes
[1] Comparisons based on the U.S. Bureau of Economic Analysis’s Regional Economic Accounts data, accessed August 2025.
[2] Analysis based on data from the U.S. Bureau of Economic Analysis News Release Gross Domestic Product, 2nd Quarter 2025 (Advance Estimate). See also Econbrowser, Economy Back to Growing, July 30, 2025 and the Federal Reserve Bank of Richmond’s May 13, 2025 analysis What’s the “G” in GDP?, and Moody’s Analytics, Inside Economics, On An Economic Tight Rope, August 1, 2025.
[3] For more information on tariffs, see the Encyclopedia Britannica entry for “Tariff” updated August 23, 2025, the Tax Foundation’s Glossary entry for Tariff, the Tax Policy Center’s August 18, 2025 iteration of its feature Tracking the Trump Tariffs, The Federal Reserve Bank of Boston’s February 6, 2025 analysis The Impact of Tariffs on Inflation, and The Overshoot, How to Think About the Tariffs, April 4, 2025.
[4] See Deloitte’s Weekly Global Economic Update for the Week of August 18, 2025, Econbrowser’s August 17, 2025 entry PPI => CPI?, Moody’s Analytics Inside Economics Inflation Rundown from August 15, 2025, The Overshoot’s August 14, 2025 entry Inflation Is Moving the Wrong Way, and the Federal Reserve Bank of Richmond’s August 5, 2025 analysis The Importance of Import Prices.
[5] See New Hampshire Employment Security’s New Hampshire Economic Conditions Report for June 2025 How Tariffs Could Affect New Hampshire’s Economy.
[6] Employment change data and inflation data from the U.S. Bureau of Labor Statistics. See also Deloitte’s Global Economic Outlook for the Week of August 4, 2025, Moody’s Analytics Inside Economics, On An Economic Tight Rope, August 1, 2025, J.P. Morgan Asset Management’s Economic Update for the Week of August 18, 2025, and the Federal Reserve Bank of Richmond’s August 19, 2025 analysis Spending Growing at a Snail’s Pace.
[7] See the U.S. Congressional Budget Office’s February 2023 publication The Economic Outlook for 2023 to 2033 for 2023 projections of an economic contraction, and the Office’s February 2024 report The Budget and Economic Outlook: 2024 to 2034 and July 2024 analysis Effects of the Immigration Surge on the Federal Budget and the Economy. See also the Federal Reserve Bank of Boston, Why Has Consumer Spending Remained So Resilient? Evidence from Credit Card Data, August 13, 2025.
[8] For more analysis of the current state of the U.S. economy, see the Board of Governors of the Federal Reserve System, Monetary Policy and the Fed’s Framework Review, August 22, 2025; Moody’s Analytics, Inside Economics, In Defense of the BLS, August 7, 2025; and Econbrowser, State of the Macroeconomy: GDP, Key Indicators as of 7/31 from July 31, 2025.
[9] Learn more about the benchmarking process on New Hampshire Employment Security’s webpage on Labor Force and Unemployment.
[10] Changes in the number of New Hampshire residents employed drawn from the Local Area Unemployment Statistics program, which surveys households, and published by New Hampshire Employment Security. See also New Hampshire Employment Security’s August 12, 2025 Unemployment News Release for July 2025.
[11] Data from New Hampshire Employment Security, and program descriptions for the Current Employment Statistics and Quarterly Census of Employment and Wages programs available from the U.S. Bureau of Labor Statistics.
[12] To access these data, see New Hampshire Employment Security’s webpage Unemployment Insurance Claims Data.
[13] Data retrieved from the U.S. Bureau of Labor Statistics, and are seasonally-adjusted data from the State and Area Employment, Hours, and Earnings survey within the Current Employment Statistics program.
[14] Based on data downloaded from the U.S. Bureau of Economic Analysis in August 2025.
[15] Data discussed in this section comparing industries is data from New Hampshire Employment Security’s reporting of the Quarterly Census of Employment and Wages data. For 2024, averages of the four individually-reported quarters are used to represent the whole year. See also New Hampshire Employment Security’s July 2025 New Hampshire Economic Conditions report Health Care and Social Assistance: Employment and Occupational Trends in the 21st Century.
[16] This analysis of early 2025 data is based on New Hampshire Employment Security’s seasonally-adjusted year-to-date Current Employment Statistics data, published August 2025.
[17] For historical context, see NHFPI’s June 4, 2018 Issue Brief New Hampshire’s Economy: Strengths and Constraints.
[18] For more insight into recent labor force trends, see NHFPI’s April 21, 2025 analysis New Hampshire’s Labor Force Grew in 2024, but Growth Might Not Continue.
[19] Data reflect individuals age 16 to 64 years, and can be accessed in the U.S. Census Bureau’s American Community Survey Table S1703.
[20] See New Hampshire Employment Security’s webpage Alternative Measures of Labor Underutilization.
[21] For more information about this dataset, see the U.S. Bureau of Labor Statistics webpage New Hampshire Job Openings and Labor Turnover — April 2025.
[22] Read more about housing cost increases in NHFPI’s August 18, 2025 analysis Housing Prices Level Off in Much of New Hampshire, While Surge Continues in Grafton, Belknap, Carroll, and Cheshire Counties.
[23] For inflation data, see the U.S. Bureau of Labor Statistics webpage Consumer Price Index Overview Table – Northeast. Average wage data available from New Hampshire Employment Security’s GraniteStats portal.
[24] Read more about personal income, and access the data used in this analysis, via the U.S. Bureau of Economic Analysis’s webpage Personal Income.
[25] For examples of prior analyses of these constraints, see NHFPI’s August 31, 2023 Issue Brief Granite State Workers and Employers Face Rising Costs and Significant Economic Constraints, NHFPI’s August 16, 2024 Issue Brief New Hampshire’s Growing Population and Changing Demographics Before and Since the COVID-19 Pandemic, and NHFPI’s August 30, 2019 Issue Brief New Hampshire’s Workforce, Wages, and Economic Opportunity.
[26] See NHFPI’s May 26, 2025 Issue Brief Workforce for Early Childhood Care and Education Declined 8 Percent in 2024, Child Care Tuition Rates Remain High.
[27] See NHFPI’s February 16, 2025 Report The Economic Impact of the Granite State’s Child Care Shortage.
[28] For more information on the national housing market, see the National Association of Home Builders/Wells Fargo Housing Market Index and the Zillow analysis July 2025: Existing Home Sales Increased in July. For the latest New Hampshire data, see NHFPI’s August 18, 2025 analysis Housing Prices Level Off in Much of New Hampshire, While Surge Continues in Grafton, Belknap, Carroll, and Cheshire Counties.
[29] See the New Hampshire Association of Realtor’s NH Monthly Indicators report for July 2025.
[30] For more details on these calculations, see NHFPI’s August 18, 2025 analysis Housing Prices Level Off in Much of New Hampshire, While Surge Continues in Grafton, Belknap, Carroll, and Cheshire Counties.
[31] For more information, see NHFPI’s December 16, 2024 analysis Seven N.H. Takeaways from Recent U.S. Census Data: Income Gains, Poverty Gaps, and Housing Challenges.
[32] To access these population data, see the U.S. Census Bureau’s Population Estimates Program, State Population Totals and Components of Change: 2020-2024.
[33] See NHFPI’s August 16, 2024 Issue Brief New Hampshire’s Growing Population and Changing Demographics Before and Since the COVID-19 Pandemic.
[34] See NHFPI’s March 3, 2025 Issue Brief Who is Experiencing Poverty in the Granite State? and NHFPI’s September 12, 2024 analysis New Hampshire’s Median Household Income Increased in 2023, Poverty Remained Steady.