During the last three months, hundreds of thousands of Granite Staters filed federal income taxes for Tax Year 2025. These individual tax returns are private, but the U.S. government publishes aggregated data about tax returns at the state, county, and zip code levels. These data provide insights into how New Hampshire residents made money across varying income brackets.
The most recent aggregated data available are from Tax Year 2022. These data may be updated, but the U.S. Internal Revenue Service lost about 27% of its staff during 2025, and other efforts may have taken priority over updating these data.
How Much Was Paid, and Where It Came From
The federal government publishes income data for individual income tax returns by percentile, which breaks all tax returns up into income categories. These data are for the federal income tax only, and do to include data for the payroll taxes that help fund Social Security, Medicare, and federal unemployment compensation, or tariffs and taxes on corporate profits, gasoline, or estates.
In total, Granite Staters owed about $11.8 billion in federal income tax based on incomes for Tax Year 2022, which was about 15% of the $76.8 billion total Adjusted Gross Income (AGI), or income after deductions, and 19% of the total taxable AGI reported on federal income tax returns from New Hampshire for that year. The 3,640 tax returns with over $1 million in AGI, which accounted for about 19% of taxable AGI reported across all incomes in 0.5% of returns, paid about 28% of federal income taxes from New Hampshire, reflecting the higher tax rates for households with greater incomes. However, other key federal taxes, such as payroll taxes, excise taxes on products like gasoline, and tariffs generally do not have reduced rates for households with lower incomes.
Excluding filers with net negative incomes after the adjustments accounted for in the AGI calculation and counting all AGI whether it is taxable or not, a broader picture emerges as to how Granite Staters earn income.

About 64% of all income reported was in salaries and wages from work. The next largest category, net capital gains that result from money earned from selling an asset (often stocks or other shares in a business) at a higher value than it was purchased, comprised 10% of all income reported. Taxable individual retirement account distributions, pensions, and annuities taken together totaled a little over 9% of all income collected. Combined net business, profession, partnership, or S-corporation income reported as “pass-through” business income on individual tax returns totaled just under 9% of all personal income. Additionally, interest and dividends paid comprised slightly more than 3% of all income reported.
Across the Income Spectrum
The relative importance of different types of income vary considerably across the income spectrum. The percentile breakdown by income group shows that salaries and wages are significant in every income group, but other sources are a larger share of income for some groups than others.
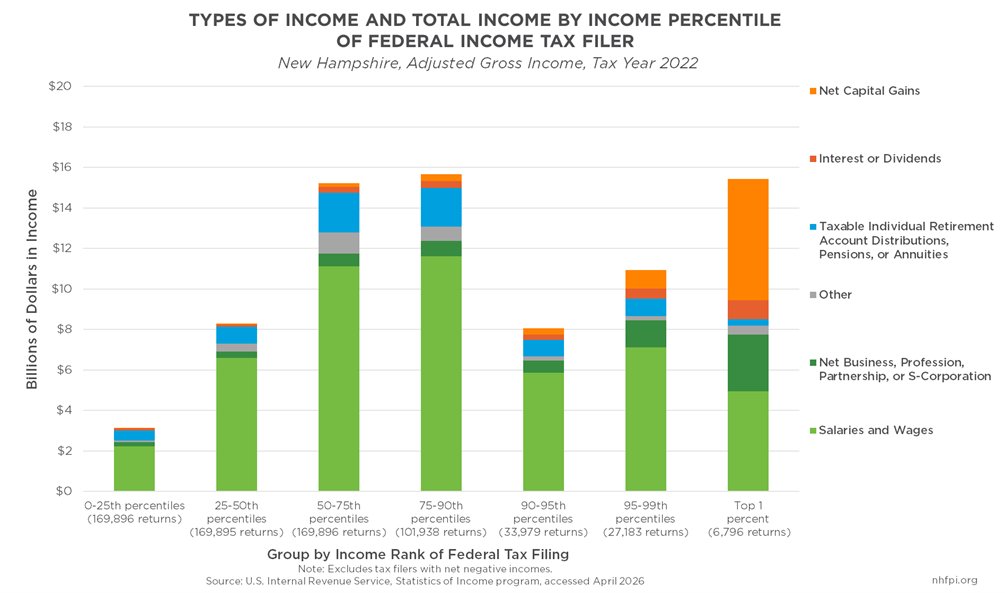
For example, among incomes earned by the 50th to the 90th percentile of filers, or those in the middle ranging to just below those in the top 10% by income, payments from retirement accounts, pensions, and annuities accounted for about 13% of income. That percentage was lower for most other income groups except for the bottom 25% of filers, where those types of income accounted for 16% of the total collected. That may reflect a larger number of retirees falling in the bottom 25% of filers by income. However, salaries and wages were still the most dominant form of income for this group, accounting for 71% of all AGI, and average AGI per filer was about $18,400 in Tax Year 2022.

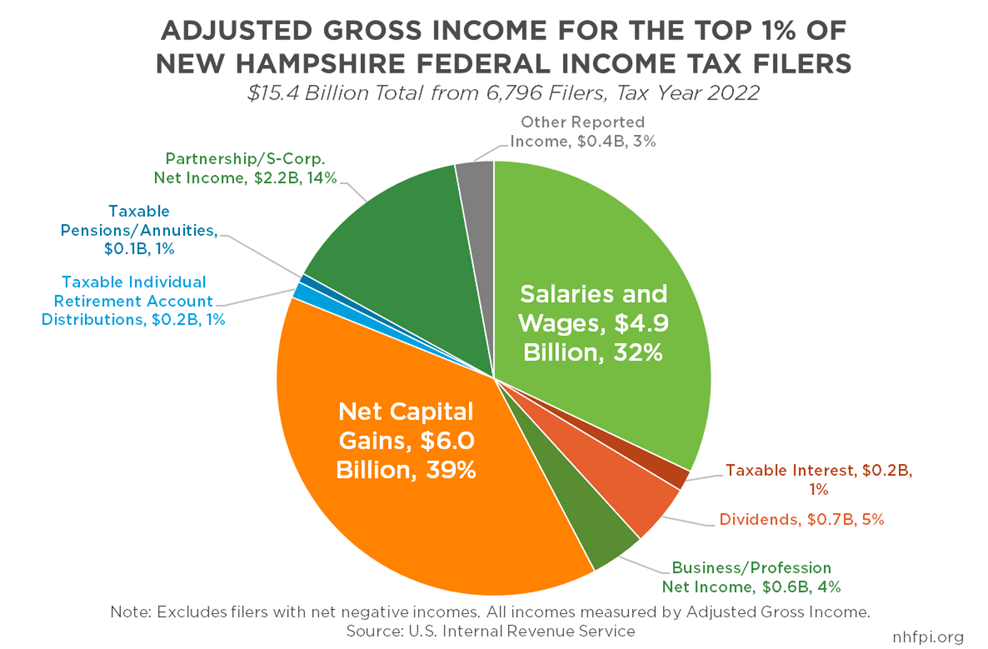
On the other end of the income scale, the federal data provide insights into the highest earning filers as well, which shows a rather different array of income sources rising in importance. For the top 1% of filers, with an average income of nearly $2.3 million among the 6,796 filers for Tax Year 2022, salaries and wages accounted for about 32% of income. Capital gains was the plurality of earnings, accounting for about 39% of all income. Combined business, partnership, and pass-through income accounted for about 18% of all income earned. Both of those shares, as well as dividend and interest income, were larger for the top 1% than for income earners overall. About 76% of all capital gains income, and 36% of all dividend income, accrued to the top 1% of filers.
Rich Data
Federal tax return data can provide key insights into the well-being of Granite Staters and the sources of their financial security. These data, however, may be more limited in the future, depending on both federal policy choices and the extent to which federal taxpayers comply with reporting requirements. The key insights provided by Tax Year 2022 and prior years can offer some insights, but all useful, reliable information requires time and resources to collect. Devoting resources to that purpose is a policy choice itself and can provide insights into future public policy decisions.