This second edition of New Hampshire Policy Points provides an overview of the Granite State and the people who call New Hampshire home. It focuses in on some of the issues that are most important to supporting thriving lives and livelihoods for New Hampshire’s residents. Moreover, the book addresses areas of key policy investments that will help ensure greater well-being for all Granite Staters and a more equitable, inclusive, and prosperous New Hampshire.
New Hampshire Policy Points is intended to provide an informative and accessible resource to policymakers and the general public alike, highlighting areas of key concerns. Touching on some important points but by no means comprehensive, each section within New Hampshire Policy Points includes the most up-to-date information available on each topic area. The facts and figures included within this book provide useful information and references for anyone interested in learning about New Hampshire and contributing to making the Granite State a better place for everyone to call home.
To purchase a print copy or download a free digital PDF of New Hampshire Policy Points, visit nhfpi.org/nhpp

Food security, which is consistent access to enough food for an active and healthy lifestyle for all members of a household, is associated with better health outcomes for those who have it than for people who are food insecure. Data indicate food insecurity has increased since 2021. While anyone can experience temporary or long-standing food insecurity, households with low incomes are more likely to be food insecure, indicating a strong association between lack of access to food and poverty.[1] Key assistance programs can help improve access to nutritious and healthy food for families across the state.
Prevalence in New Hampshire
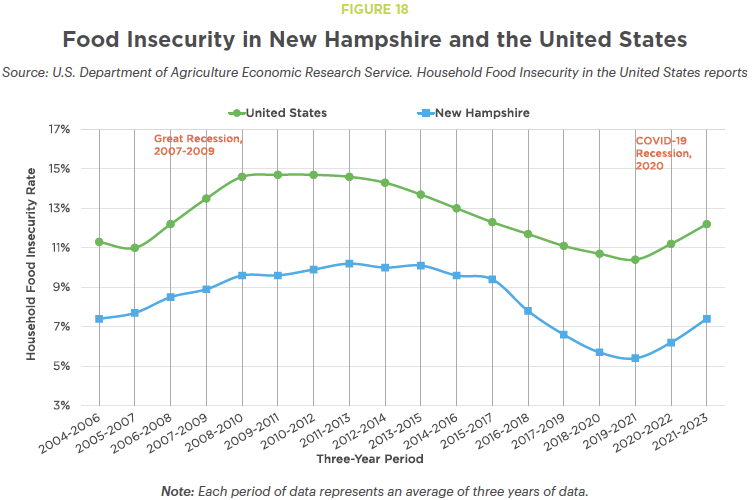
In New Hampshire, an estimated 42,300 households were food insecure during the 2021 to 2023 period. These data show an increase from the 2019 to 2021 period, when about 30,000 households were food insecure, the lowest estimated amount in the past two decades. The decrease in food insecurity during the first years of the COVID-19 pandemic followed a national trend, which may have been caused, in part, by COVID-19-related federal aid intended to assist with the economic impacts of the pandemic. Since the expiration of this temporary aid, food insecurity has rebounded to pre-pandemic levels.[2] Throughout these changes, the percentage of Granite State households experiencing food insecurity has remained lower than the national percentage.
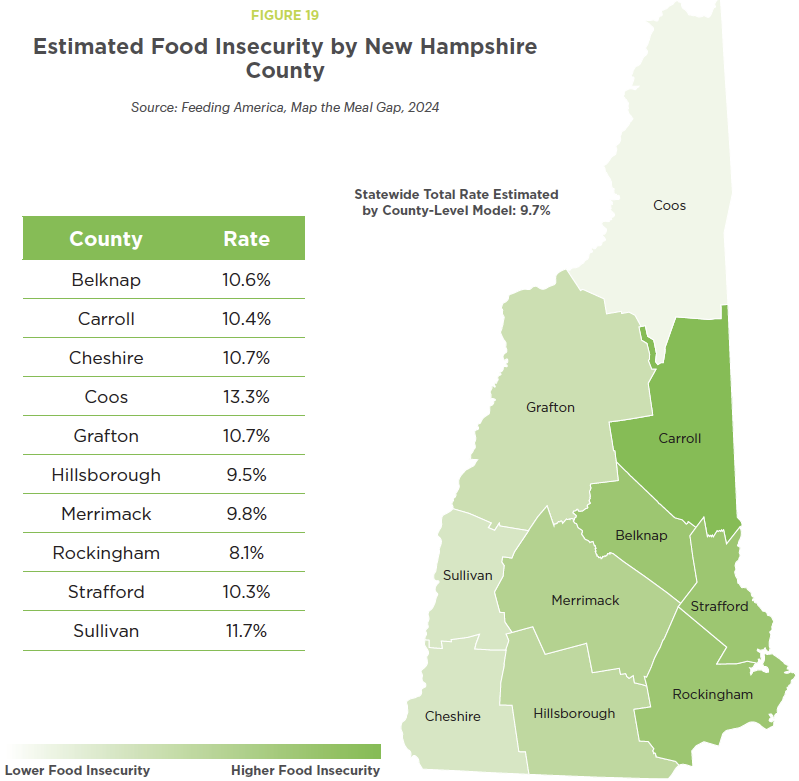
Food insecurity rates differ among communities across the Granite State. According to 2022 data from Feeding America’s Map the Meal gap model, the estimated county-level food insecurity rate in New Hampshire ranged from 13.3 percent in Coos County to 8.1 percent in Rockingham County, both of which increased from their 2021 estimated rates of 10.2 percent and 5.4 percent, respectively. Rockingham, Hillsborough, and Merrimack counties were the only counties with estimated rates lower than 10 percent in 2022. However, these counties with the lowest rates also had the largest numbers of people experiencing food insecurity due to their larger population sizes.[3]
Health Impacts
Adults who are food insecure are more likely to develop chronic health conditions and experience worsened mental health.[4] Because adequate nutrition is critical to healthy development, food insecurity has a disproportionate effect on children’s health. Children from food insecure households are more likely than their food secure peers to experience developmental challenges, perform poorly in school, and face other adverse health outcomes that could negatively impact life as adults.[5] Food insecurity is more prevalent among adults and children identifying as Black or Hispanic, which could also have implications for health disparities among these groups.[6]
Residents of areas with few supermarkets and limited access to transportation are at a greater risk of being food insecure.[7] Proximity to a grocery store may impact how often families can obtain fresh food, which could be a challenge in rural parts of the state, especially for Granite Staters without reliable access to transportation. Using 2019 data, the federal government’s Food Access Research Atlas identified several rural communities in Carroll, Cheshire, Coos, and Grafton counties that had a majority of households with low incomes and in which a majority were more than ten miles from the closest grocery store.[8] A separate 2019 analysis from the University of New Hampshire found significant geographies within Coos County and central Grafton County relied on convenience stores, rather than grocery stores, for local access to food.[9] Nationally, convenience stores and supercenters, with higher prices and less variety of fresh food, are also becoming more common in rural communities compared to other full-service supermarkets in populated areas.[10]
Programs Providing Food Assistance
Key federal and state aid programs are designed to help improve access to healthy food and reduce the risks facing individuals in times of economic hardship. The Supplemental Nutrition Assistance Program (SNAP), previously known as “Food Stamps” nationally, provides resources specifically for purchasing food.[11] National data show food insecurity is typically more prevalent among households with children, particularly those with young children, and among households headed by an individual identifying as Black or Hispanic.[12] SNAP disproportionately serves children in New Hampshire; at the end of July 2023, 36.3 percent of the 76,713 Granite Staters enrolled in SNAP were children, while children comprised only about 18 percent of New Hampshire’s residents in July 2023. Separately, the Special Supplemental Nutrition Program for Women, Infants, and Children, also known as WIC, served over 13,000 individuals in 2023, most of whom were children and infants.[13] While these programs assist families across the state, 2023 SNAP enrollment was highest in Stratford, Berlin, and Claremont, with 19.1, 15.9, and 15.9 percent of the municipalities’ populations enrolled, respectively.[14]
While SNAP can help improve access to nutritious food, data suggests that the program has been underutilized. According to the U.S. Department of Agriculture, the Granite State ranked 32nd in the nation for SNAP enrollment in 2020, relative to the potentially eligible population, which was below the national average.[15] Further, according to New Hampshire Hunger Solutions, program utilization is low among those age 60 or older, with only about 40 percent of eligible older adults enrolled in SNAP.[16] In addition to being underutilized, SNAP’s impact on families with low incomes may be limited. SNAP benefits equated to a maximum of about $2.83 per meal based on data from October through December 2023, which was not enough to cover a meal in any county across the state.[17]
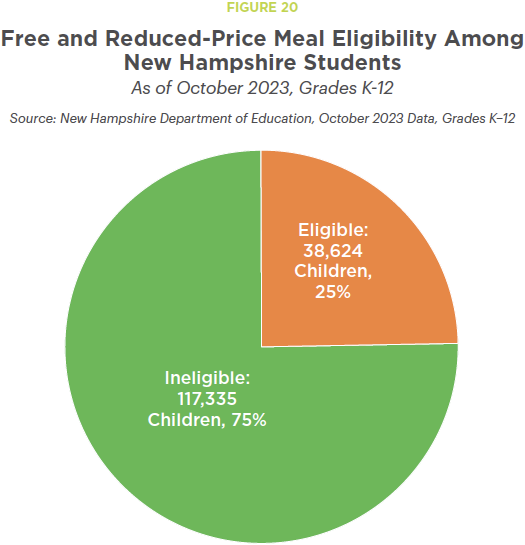
Food assistance is also provided to children from households with low incomes who are attending school. In October 2023, nearly one in four New Hampshire students were eligible for free and reduced-price school meals. Similar to other food assistance programs, enrollment varied by community in the state. Relatively high percentages of students were eligible for free or reduced price school meals in Stewartstown (73.6 percent of students), Stratford (60.7 percent), Newport (56.5 percent), Warren (54.9 percent), and Franklin (54.0 percent).[18] Students of color, who account for a growing percentage of all children, are more likely to be eligible for free and reduced-price meals, indicating fewer financial resources in their homes.[19] Key research suggests food assistance programs help enhance food security, boosting the resources available for food and other needs among families with low incomes. This food assistance likely helps improve the health and well-being of individuals and families both immediately and in the future.[20]
• • •
This publication and its conclusions are based on independent research and analysis conducted by NHFPI. Please email us at info@nhfpi.org with any inquiries or when using or citing New Hampshire Policy Points in any forthcoming publications.
© New Hampshire Fiscal Policy Institute, 2024.
Endnotes
[1] See NHFPI’s February 29, 2024 issue brief Poverty and Food Insecurity in New Hampshire During and Following the COVID-19 Crisis.
[2] See the U.S. Department of Agriculture Economic Research Service, Household Food Insecurity in the United States in 2023.
[3] See Feeding America, Map the Meal Gap.
[4] See the U.S. Department of Agriculture Economic Research Service’s October 2, 2017 article, Adults in Households with More Severe Food Insecurity Are More Likely to Have a Chronic Disease and the American Journal of Health Promotion’s 2022 article, Food Insecurity and Mental Well-Being Among Low-Income Families During COVID-19 Pandemic.
[5] See the U.S. Department of Health and Human Services, Healthy People 2030: Food Insecurity and NHFPI’s February 29, 2024 issue brief Poverty and Food Insecurity in New Hampshire During and Following the COVID-19 Crisis.
[6] See the U.S. Department of Health and Human Services, Healthy People 2030: Food Insecurity.
[7] See the U.S. Department of Agriculture Economic Research Service’s June 2009 report, Access to Affordable and Nutritious Food-Measuring and Understanding Food Deserts and their Consequences.
[8] See the U.S. Department of Agriculture Economic Research Service, Food Access Research Atlas.
[9] See the University of New Hampshire Carsey School of Public Policy’s June 2019 issue brief Mapping the Food Landscape in New Hampshire.
[10] See the U.S. Department of Agriculture Economic Research Service’s December 7, 2021 article, Rural Counties Losing Share Grocery Stores, Gaining Other Types of Food Retailers.
[11] See the NH Department of Health and Human Services, Supplemental Nutrition Assistance Program.
[12] See the U.S. Department of Agriculture Economic Research Service, Household Food Insecurity in the United States in 2023.
[13] See the U.S. Department of Agriculture’s WIC Data Tables.
[14] Data provided through data request from the NH Department of Health and Human Services.
[15] See the U.S. Department of Agriculture’s interactive, SNAP Participation Rates by State.
[16] See the New Hampshire Hunger Solutions website.
[17] See the Urban Institute’s data tool, Does SNAP Cover the Cost of a Meal in Your County?
[18] See the NH Department of Education, Free Reduced School Lunch Eligibility Rates by District.
[19] See the U.S. Centers for Disease Control and Prevention, QuickStats and NHFPI’s June 2022 issue brief Advancing Equity Through Changes to State Public Education Aid.
[20] See the Frontiers in Nutrition’s 2022 article Food Insecurity and the Role of Food Assistance Programs in Supporting Diet Quality During the COVID-19 Pandemic in Massachusetts; the Center on Budget and Policy Priorities’ January 2018 report SNAP Is Linked with Improved Nutritional Outcomes and Lower Health Care Costs; and the Journal of Nutritional Science’s 2023 article Food Security Among SNAP Participants 2019 to 2021: A Cross-Sectional Analysis of Current Population Survey Food Security Supplement Data.