New Hampshire maintained the lowest official state-level poverty rate in the nation in 2023, but other poverty-related data show that the Granite State does not have the least economic hardship by all measures. Adjusting for regional variations in housing costs, certain tax credit programs, and updated data on household expenses indicates that New Hampshire’s poverty rate is relatively low, but whether it is the lowest among the states depends on the measure and survey used for the comparisons. Even using the typical measure, which has key limitations, about 98,000 Granite Staters were in poverty in 2023.
Lowest Poverty Rate by Official Measure and Largest Survey
According to the U.S. Census Bureau’s American Community Survey, for which 2023 data was released in September 2024, New Hampshire has the lowest poverty rate among the 50 states. The Granite State’s poverty rate, using the Official Poverty Measure (OPM), was estimated to be 7.2 percent, with a margin of error of 0.6 percentage points in either direction. That margin of error indicates that the data can only provide 90 percent certainty that the actual population’s poverty rate is between 6.6 percent and 7.8 percent. For example, the poverty rate of 7.7 percent in another state with a margin of error of 0.5 percentage points would not be statistically distinguishable from New Hampshire’s poverty rate. Statistical testing allows for determining whether two estimates are different in a statistically significant manner.
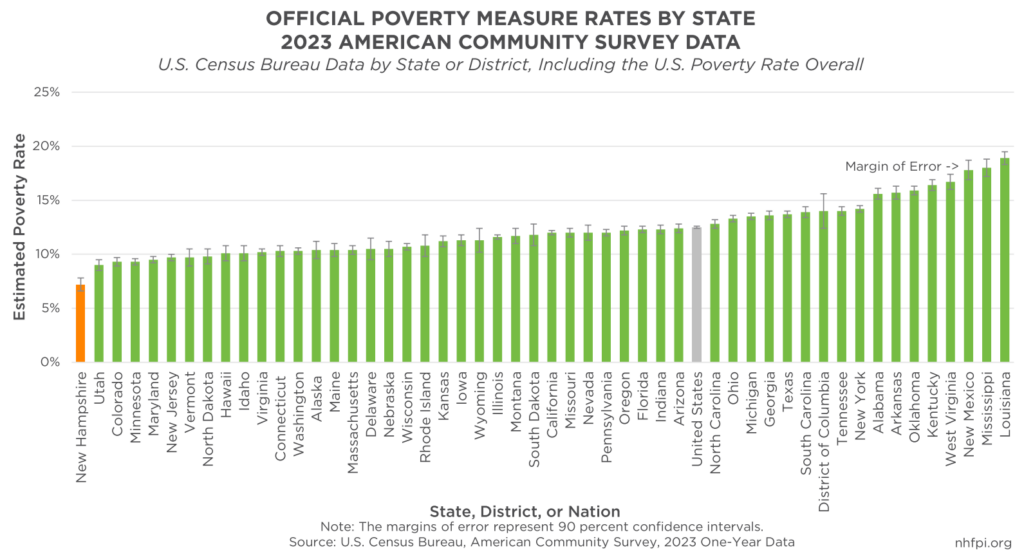
However, in the case of New Hampshire, the OPM measured with data from the American Community Survey show a poverty rate lower than all other states even after accounting for the statistical uncertainty from survey data. The next lowest point estimate poverty rate by this measure, which was in Utah, was 9.0 percent with a margin of error of 0.5 percentage points. The next states, which were Colorado, Minnesota, Maryland, and New Jersey, all had slightly higher poverty rates and narrower margins of error. The U.S. Census Bureau recommends using the American Community Survey for detailed state-level data, so by this typical measure, New Hampshire has the lowest poverty rate in the country.
While the lowest in the country, the OPM poverty rate still represents a large number of Granite Staters facing significant material hardship. An estimated 98,000 people in New Hampshire lived with incomes below OPM poverty thresholds in 2023. The Official Poverty Measure thresholds for 2023 are $15,852 for a single person under 65 years old, $21,002 for a two-person household with one child and one adult under 65, $24,526 for a three-person household with one child, and $30,900 for a four-person household with two children. The estimated 98,000 people in poverty is slightly more than the 2023 populations of Claremont, Concord, Laconia, and Portsmouth combined. That total number of people in poverty included about 20,000 children and 21,000 older adults.
Insights from Another Survey and Other Measures of Poverty
While consistently used over decades as a benchmark for many means-tested policies, the OPM has shortcomings. The original definition, developed in the 1960s, relied on survey data from 1955 that showed families of three or more people spent about one-third of their income on food. A federally-estimated cost for a basic food plan to feed a three-person family was multiplied by three to develop the poverty threshold, and families with incomes below that level were considered to be living in poverty. The multiplication factor varies for different household compositions, but this measure, with adjustments for food costs over time, provides the fundamental framework for defining poverty under the federal government’s OPM.
To help understand and address these limitations, the U.S. Census Bureau developed and published the Supplemental Poverty Measure (SPM) starting in 2011. The SPM uses ongoing survey data to estimate expenditure costs for food, clothing, utilities, and housing. The SPM includes regional variation in housing costs, but not geographic changes in other costs, and has different definitions for household membership than used in the OPM. The SPM also includes the effects of taxes and tax credits, nutrition and energy assistance, work and medical expenditures, child support payments, and child care costs.
The U.S. Census Bureau collects information needed to calculate the Supplemental Poverty Measure in the Current Population Survey, which is separate from the American Community Survey. The Current Population Survey reaches about 100,000 addresses across the country with live phone or in-person interviews, and asks detailed questions about sources of income. By contrast, the American Community Survey reaches three million addresses with a mailed or internet survey, with follow-ups from live individuals only if needed.
The Current Population Survey produces the official poverty rate for the entire country, but the sample sizes are too small to reliably measure each state in each individual year. However, the U.S. Census Bureau publishes estimates of poverty rates for each state by combining three years of data from the Current Population Survey to increase the size of the sample. These estimates are produced for both the OPM and the SPM poverty rates in each state. The most recent data, spanning 2021 to 2023, show that New Hampshire has among the lowest poverty rates in the country, but not definitively the lowest.
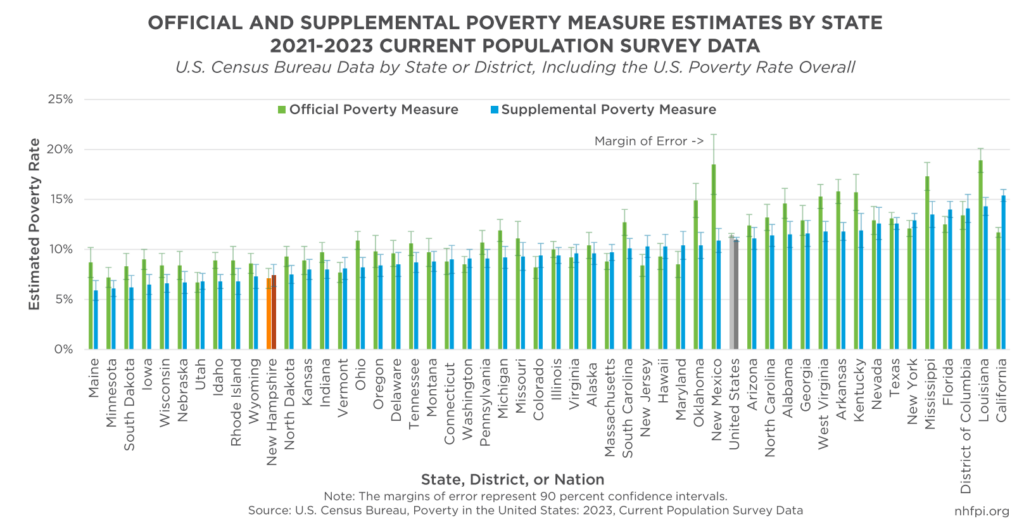
The OPM poverty rate estimated for New Hampshire during the 2021-2023 period, based on the more detailed Current Population Survey, shows a very similar rate to the American Community Survey. New Hampshire’s OPM poverty rate of 7.1 percent during this period closely matches the consistent 7.2 percent from the American Community Survey over these three years. However, Utah’s rate of 6.7 percent and Minnesota’s rate of 7.2 percent are statistically indistinguishable from New Hampshire’s rate, meaning the data do not offer enough certainty to determine with statistical confidence that New Hampshire’s poverty rate is lower than Minnesota’s rate, or higher than Utah’s rate. Relatively large margins of error also make New Hampshire’s poverty rate statistically indistinguishable from rates in neighboring Maine and Vermont, as well as Colorado, South Dakota, New Jersey, Wisconsin, Nebraska, and Maryland.
New Hampshire Not Definitively Lowest After Accounting for Certain Costs and Aid
The same dataset collected through the Current Population Survey allows for calculations of SPM poverty rates for each state, and results in a notably different ordering of the states. The SPM poverty rates can be substantially different both because of regional variations in housing costs and because of certain types of assistance, such as tax credits, that may either have higher participation or be structured differently across state lines. Using Current Population Survey data for 2021-2023, New Hampshire’s SPM poverty rate of 7.4 percent is statistically indistinguishable from 19 other states. However, testing for statistical significance shows that Maine, with the lowest point estimate in the country of a 5.9 percent SPM poverty rate, was lower than New Hampshire with at least 90 percent statistical confidence.
Recently, the U.S. Census Bureau has also calculated the one-year SPM rates for states by extrapolating from the more limited data collected through the American Community Survey. Using data drawn from the Current Population Survey and imputing more detail into the American Community Survey data, the U.S. Census Bureau has published estimated SPM poverty rates for each state based on the American Community Survey for individual years, most recently for 2022. These poverty rates provide further insights into the impacts of regional variations in housing costs and assistance programs, particularly aid delivered through tax codes, on well-being across state lines.
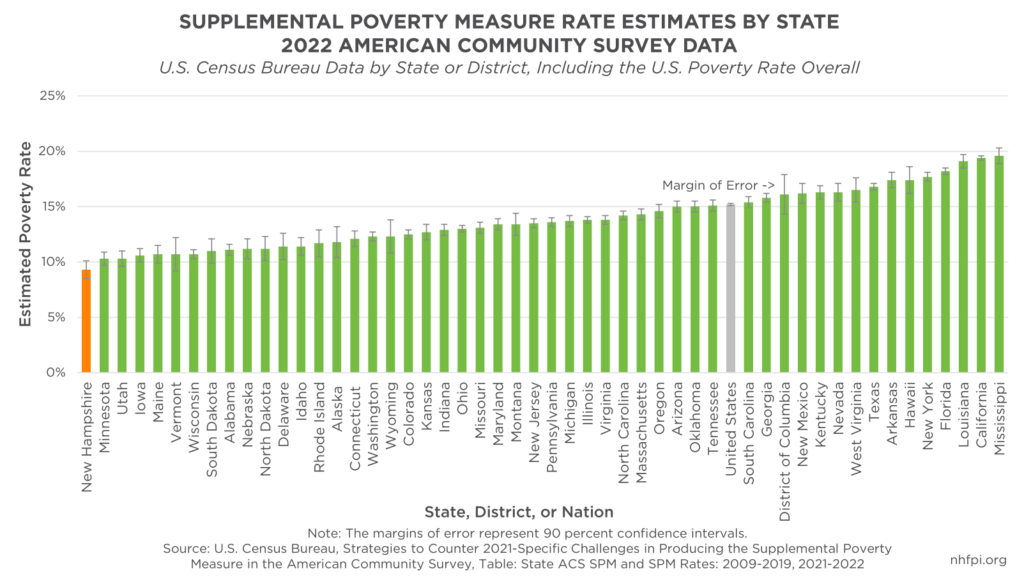
Using the American Community Survey to estimate SPM poverty rates for 2022, New Hampshire had the lowest point estimate poverty rate among the states, ignoring the margin of error, at 9.3 percent. However, the 0.8 percent margin of error renders this poverty rate statistically indistinguishable from estimated poverty rates in Minnesota, Utah, and Vermont.
All these data suggest New Hampshire has a relatively low poverty rate. However, only one dataset indicates with certainty that New Hampshire has the lowest poverty rate in the country among the states. That dataset is the recommended and official set of figures to use, so New Hampshire’s poverty rate remained the lowest of all states in 2023 by the typical measure. The other data show, however, that adjusting for regional housing costs, certain expenses, targeted assistance, and other factors may change New Hampshire’s relative ranking compared to other states. These data provide insights into the types of challenges, such as housing costs, that residents with low incomes and limited resources may struggle to overcome in New Hampshire.
– Phil Sletten, Research Director and Jess Williams, Policy Analyst