Recent Census Bureau releases showing data for 2016 yielded some good news for New Hampshire, with a lower overall poverty rate and lower poverty rates for children and seniors, although about 23 percent of households earned less than $35,000 per year and more than 94,000 Granite Staters remained in poverty.
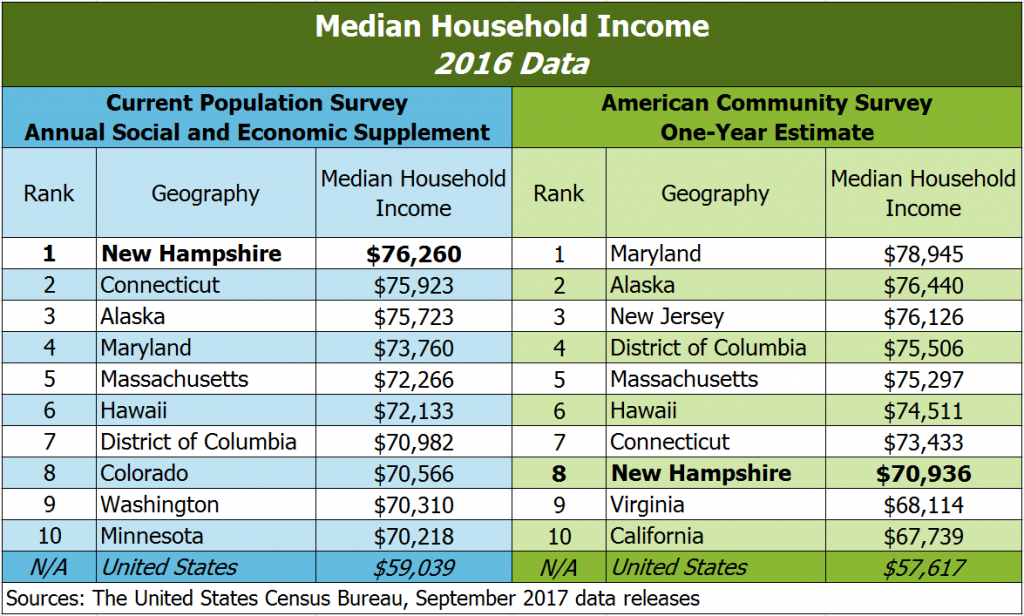
Attentive news consumers may have heard that New Hampshire has the highest median household income of any state in the country, at $76,260. However, these same consumers may have also read New Hampshire has the eighth highest median household income in the country at $70,936, with both sets of reports citing the U.S. Census Bureau. Why the discrepancy?
The Census Bureau released two sets of data in the same week based on different data sources, which offer similar measures but resulted in different state-by-state rankings. On Tuesday, September 12, the Census Bureau published the Current Population Survey Annual Social and Economic Supplement, or “CPS ASEC” as the Census Bureau abbreviates it. This survey of households, which uses a sample of about 95,000 addresses, is designed to provide timely and detailed estimates of income and poverty to measure change in national-level estimates. The CPS ASEC indicates New Hampshire’s median household income is $76,260, the highest among the states.
On Thursday, September 14, the Census Bureau released its one-year survey estimates from the American Community Survey (ACS) for 2016. This survey’s results are based on an annual sample size of approximately 3.5 million addresses and include both housing units and group quarters (such as nursing homes and prisons, which are not included in the CPS ASEC). The ACS pegged New Hampshire’s median household income at $70,936, ranked as the eighth highest among the states.
The Census Bureau identifies a few reasons why these metrics differ. Income questions on the CPS ASEC are more detailed than in the ACS, and interviewers administer the CPS ASEC in person or over the phone, while the ACS is completed through online or mailed forms. The CPS ASEC also asks respondents about their incomes in the previous calendar year, while the ACS asks about the prior 12 months of income; as the survey is administered throughout the year, the timeframe respondents are using to answer the ACS can vary considerably. Other methodological differences may lead to different outcomes.
The Census Bureau recommends that the CPS ASEC be used for national statistics, as it provides a longer track of historical comparisons, but recommends those looking to examine state and other subnational data use the ACS because of the larger sample sizes. This recommendation is particularly important for small states like New Hampshire, where national surveys like CPS ASEC may only collect a small sample from relatively low-population states, while the ACS’s larger sample size helps keep margins of error smaller. The Census Bureau does publish data for the CPS ASEC by state for median household income, but does not incorporate these data prominently into the primary data release for the CPS ASEC, as it does for the ACS.
Whether using the CPS ASEC or the ACS, New Hampshire is doing relatively well on a state-by-state comparison. Future scheduled data releases will permit more intrastate comparisons. For more on the 2016 ACS one-year release, see NHFPI’s September 14 analysis of the state-level data.