Access to resources varies substantially between Granite Staters, and inequities in that access among racial and ethnic groups in New Hampshire indicate that both historical and present-day limitations diminish opportunities. New Hampshire is not immune to national trends that impact the lives and livelihoods of many U.S. residents, particularly relative to incomes for Granite Staters who identify as Black, African American, Hispanic, or Latino. Helping ensure a recovery from the COVID-19 crisis that reaches all Granite Staters, including the increasingly racially and ethnically diverse population of children in the state, requires consideration of these factors. Expanding equitable opportunities in New Hampshire’s two largest cities, which are more racially and ethnically diverse than the state as a whole and where roughly one quarter of Granite State children in poverty live, will be key to these efforts. Increasing equity and access to opportunity will better enable all New Hampshire residents to thrive.
This Issue Brief examines the differences in household and personal incomes, poverty rates, and demographic trends between racial and ethnic groups in New Hampshire, and also reviews the concentrations of both racial and ethnic diversity and child poverty in the state’s two largest cities.
Growing Diversity
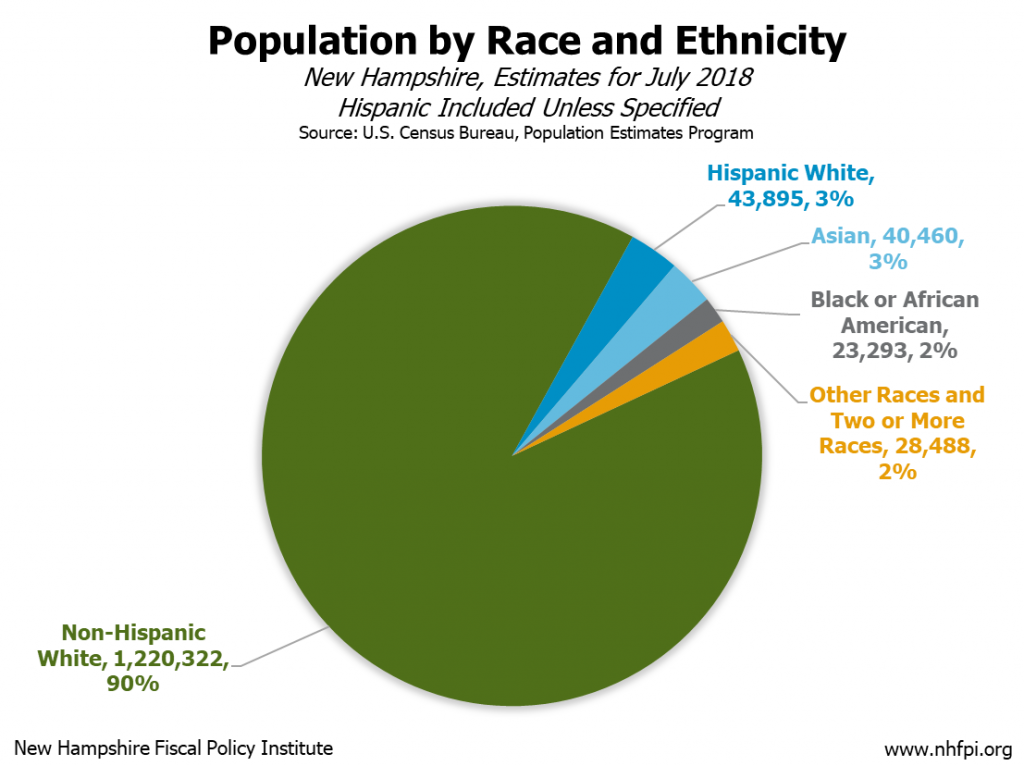
New Hampshire has become more diverse in recent years, with the portion of the population that does not identify their race as white or their ethnicity as Hispanic or Latino reaching 10 percent in 2018, based on population estimates from the U.S. Census Bureau. The Bureau identifies race and ethnicity separately; someone of any Bureau-defined racial group, such as white or Asian, could also be ethnically Hispanic or Latino, or identify as not Hispanic or Latino. The percentage of the New Hampshire population that identified as non-Hispanic white in the 2010 Census was 92.3 percent, but estimates of the 2018 New Hampshire population suggest that percentage has decreased to 90.0 percent.[i]
The increase in racial and ethnic diversity is apparent across nearly every age group in New Hampshire. While adults aged 18 and over identifying as something other than non-Hispanic white comprise an estimated 8.7 percent of the population in 2018, children identifying as something other than non-Hispanic white comprised 15.5 percent of the population under 18 years old. Residents aged 65 years and older were about 96.3 percent non-Hispanic white, with about 3.7 percent identifying as either non-white or Hispanic. The median age for non-Hispanic whites in New Hampshire was 46.4 years in 2018, while it was 28.8 years for those identifying as Black or African American, 28.6 years for Hispanic whites, 35.0 years for Asians, and only 21.7 years old for those identifying as two or more races.[ii]
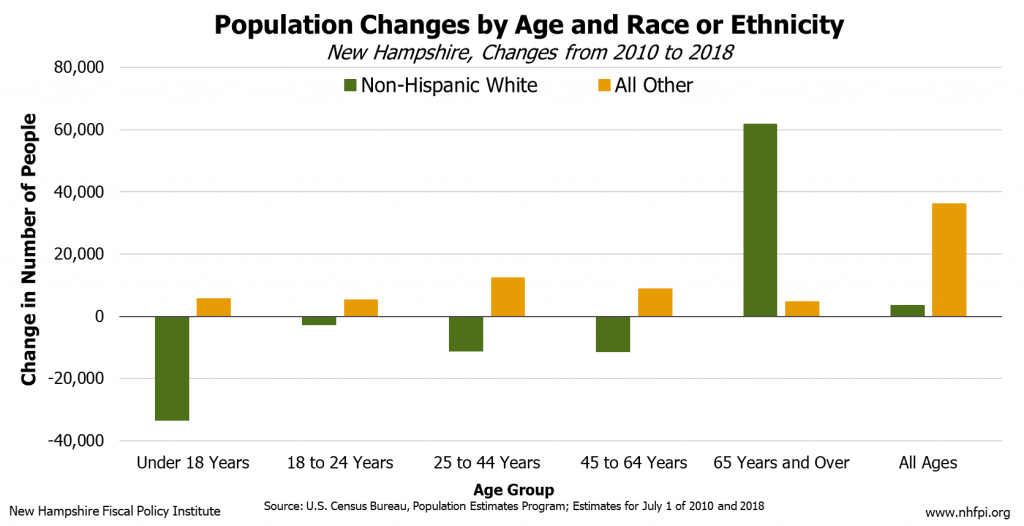
These age patterns reflect the estimated population growth that occurred in New Hampshire between 2010 and 2018. Estimates indicate populations declined for non-Hispanic whites in New Hampshire across all age groups except for those aged 65 and older. The population declines for non-Hispanic whites were steepest among children. In contrast, the population of individuals identifying as something other than non-Hispanic white grew across all age groups.
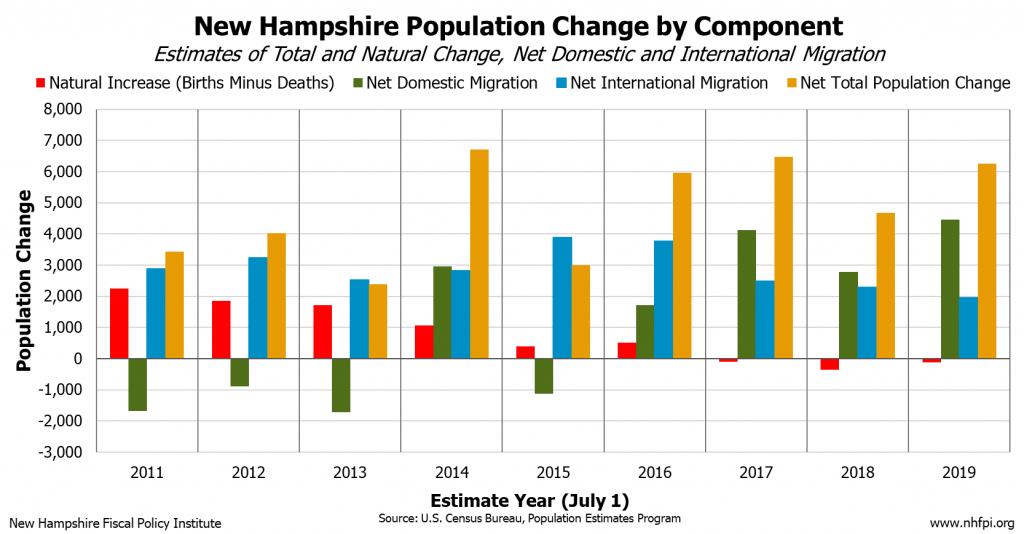
International migration may be contributing to this change in demographics. Annual population estimates from the U.S. Census Bureau suggest net increases in population due to people moving to New Hampshire from outside the United States were the reason the state’s population did not decline in 2013 and 2015. These estimates also indicate total deaths have outnumbered births in New Hampshire in the most recent three years of data, suggesting the state is entirely reliant on people moving here from other parts of the country, and world, for population growth.[iii] Increases in population help enable New Hampshire to grow a vibrant economy.
These figures, particularly the population increases in children from racial and ethnic minority groups in the state, and national trends suggest New Hampshire and its workforce are likely to become more racially and ethnically diverse over time.[iv]
Income and Poverty
Even with growing diversity, systemic and persistent inequities contribute to a lack of access to opportunity for Granite Staters identifying with racial and ethnic minority groups, and understanding the extent of these inequities is critical to addressing them. Income and poverty levels put certain groups at a distinct disadvantage, in terms of access to resources, which may have a dramatic impact on opportunities and outcomes for members of these communities.
Poverty is defined by the federal government as having an income below a certain level based on the size and composition of the household. For 2018, the federal poverty thresholds were less than $13,064 for a single person under age 65, $17,308 for a householder under 65 with one child, and $25,465 for two adults with two children.[v]
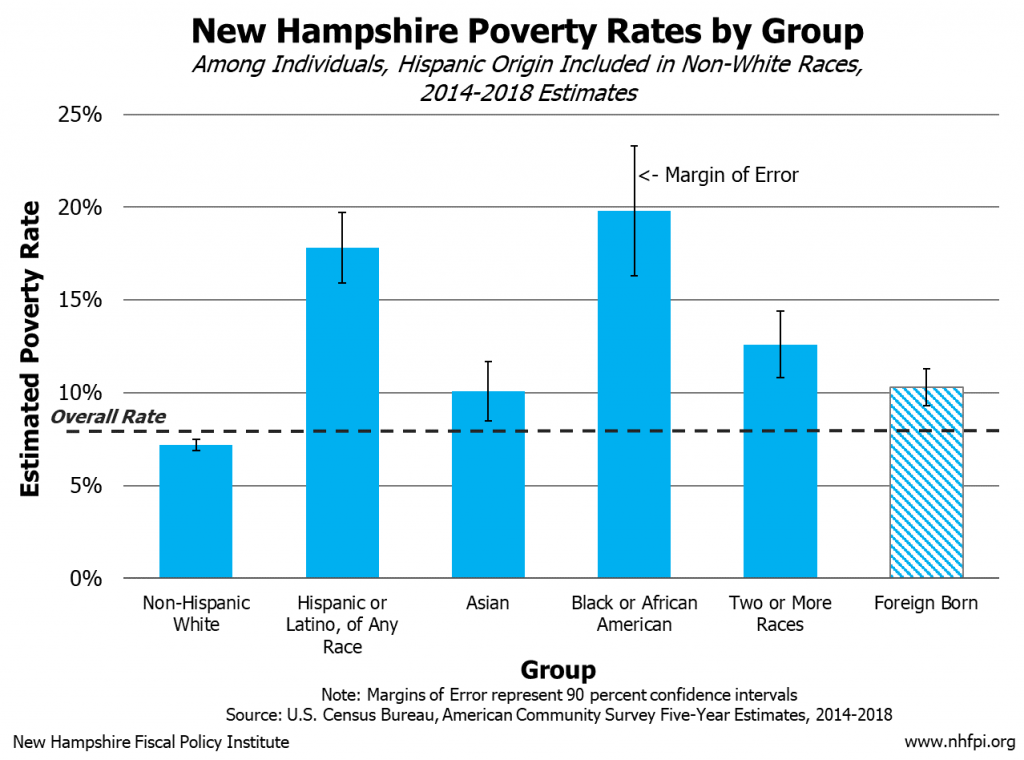
The overall poverty rate for individuals in New Hampshire during the 2014-2018 time period was 7.9 percent. For non-Hispanic white individuals, the poverty rate was 7.2 percent, while Hispanic individuals of any race faced a poverty rate of 17.8 percent in New Hampshire. The poverty rate for individuals identifying as Black or African American was estimated to be 19.8 percent, or roughly one in five individuals living with incomes below poverty levels, nearly three times the poverty rate of non-Hispanic white individuals. Those who were Asian, identifying with two or more races, or born outside the United States also experienced higher poverty rates than the state as a whole.[vi]
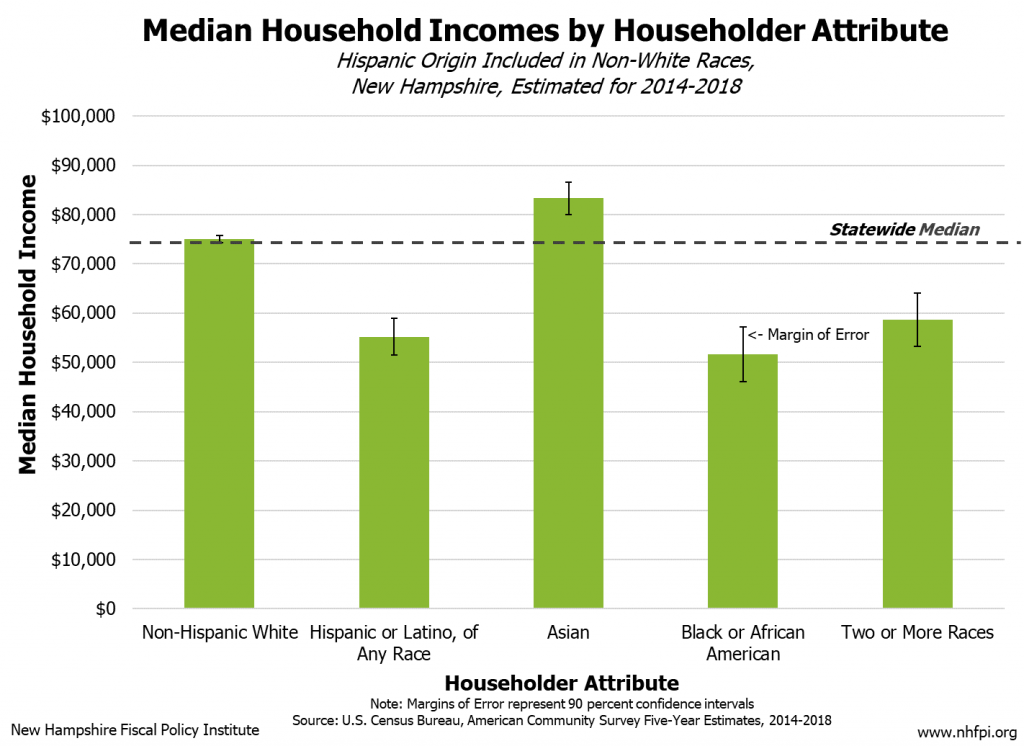
Differences in household incomes by the race of the householder also reflects the relative lack of access to resources among individuals of different groups. The statewide median household income for 2014-2018 was about $74,057, statistically indistinguishable from the median household income of $74,973 for homes with white householders. For households with Asian heads of household, median income was higher than for non-Hispanic white households. However, median income for households with Hispanic or Latino householders was estimated to be $55,157, or 74 cents for every dollar for non-Hispanic white households. Although households with Black or African American householders had an estimated median income that was statistically indistinguishable from the median incomes for Hispanic households or those with householders identifying as two or more races, the estimate for these households of $51,630 was 69 cents per every dollar in a non-Hispanic white household’s median income. Households headed by Black, African American, Hispanic, or Latino individuals had median incomes that were about three quarters of the statewide median household income, or approximately $20,000 per year less, which provided less purchasing power within the year and a reduced ability to save over time relative to non-Hispanic white households in the state.
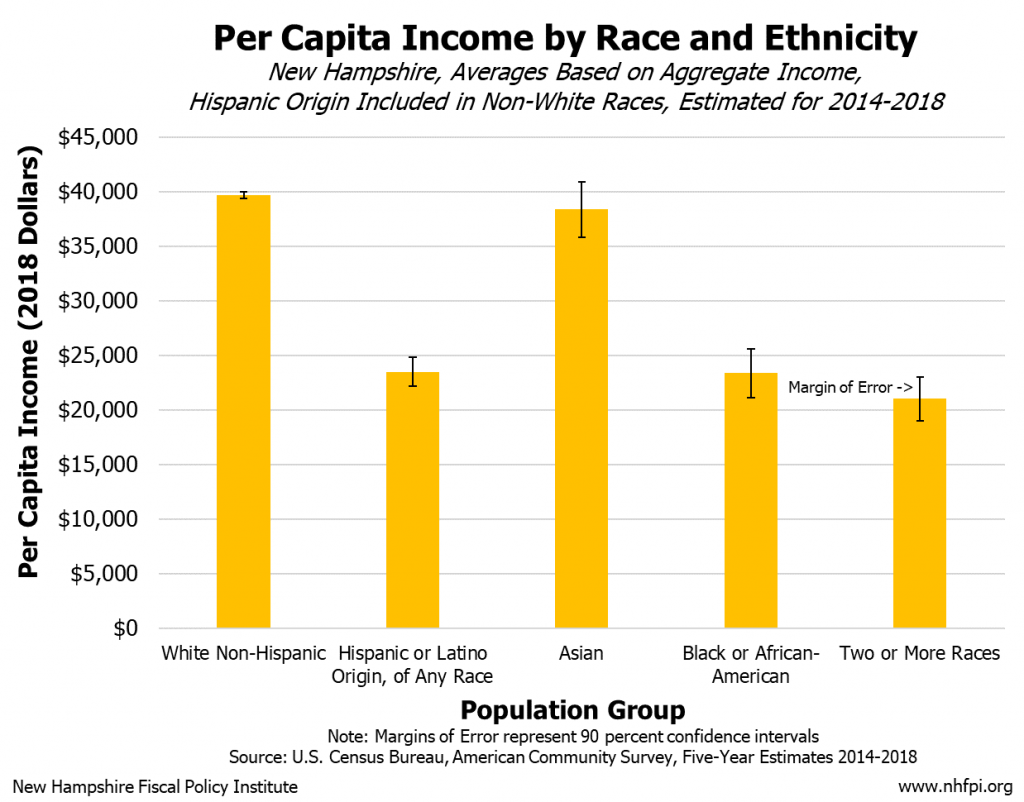
The disparities by race and ethnicity persist when considered on a per person basis, rather than measuring income by household. These averages, which are impacted by outliers more than medians are, show that incomes for each individual identifying as non-Hispanic white and Asian were statistically indistinguishable from each other in the 2014-2018 timeframe, with the non-Hispanic white per capita income estimated at $39,704. Incomes per individual for Granite Staters identifying their race as Black or African American, or those identifying their ethnicity as Hispanic or Latino, were both estimated to be about $23,000. While statistically indistinguishable from individuals in the Black, African American, Hispanic, and Latino groups, the per capita incomes of those identifying as two or more races was estimated to be $21,000, or only about 53 cents for every dollar of income per non-Hispanic white person in New Hampshire. These inequities in income compound over time and result in diminished access to opportunity, leaving some Granite Staters less able to thrive.
Race and Child Poverty in New Hampshire’s Largest Cities
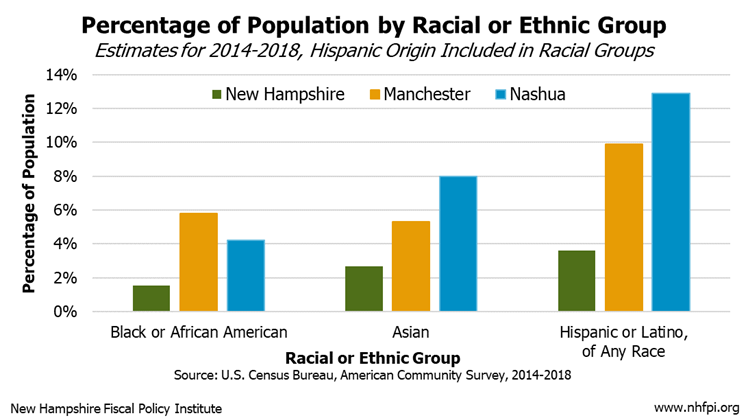
New Hampshire’s two largest cities, Manchester and Nashua, are more racially and ethnically diverse than the state as a whole. Together, these two cities accounted for approximately 15 percent of New Hampshire’s total population, based on data collected from 2014-2018. In addition, these two cities were collectively home to half of the New Hampshire population identifying as Black or African American, and nearly half the population identifying their ethnicity as Hispanic or Latino. About one in three New Hampshire residents identifying their race as Asian lived in Manchester or Nashua, as well as one quarter of those identifying as being of two or more races.[vii]
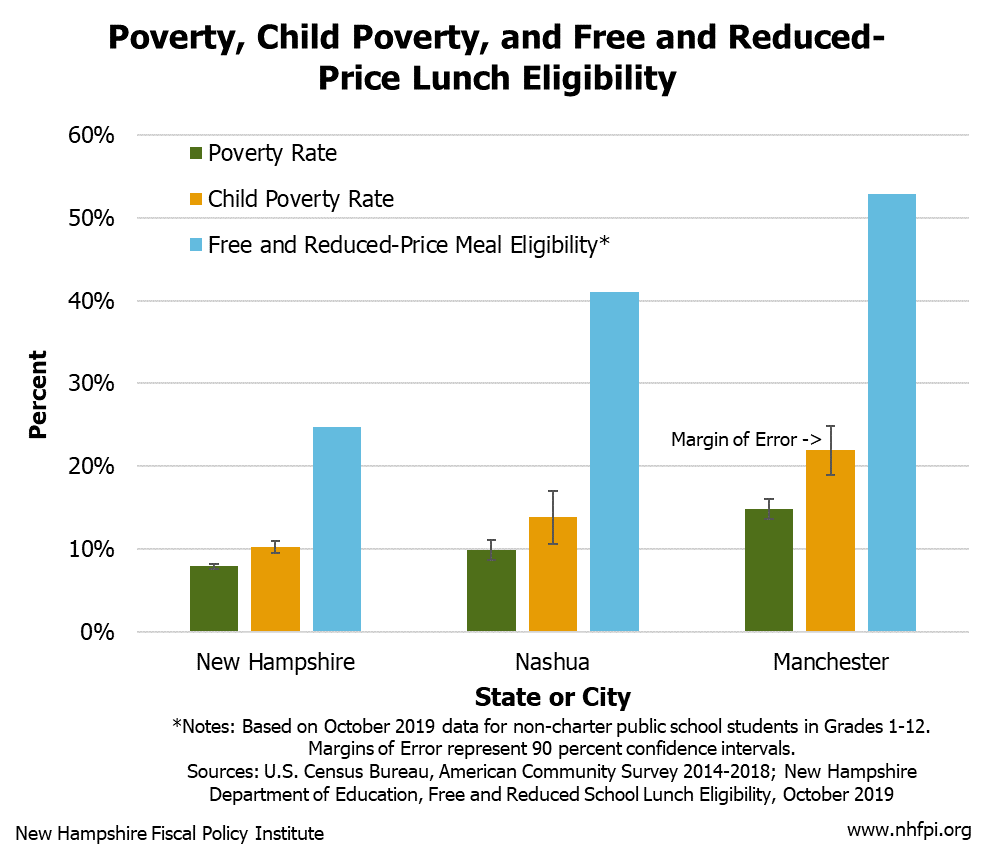
About 15 percent of New Hampshire’s children live in Manchester and Nashua, which matches the percentage of the total state population in those two cities. However, these two cities are estimated to be home to about 27 percent of individuals under 18 in poverty in New Hampshire, based on 2014-2018 U.S. Census Bureau survey data. Statewide, about 10 percent of children were in poverty, while the child poverty rate for Nashua was 14 percent and for Manchester was 22 percent.
Data from the New Hampshire Department of Education indicate that statewide about 25 percent of students in grades 1-12 at non-charter public schools were eligible for free and reduced-price school meals in October 2019. These children were eligible to participate in programs that help provide access to food for students from low-income families. In the Manchester school district, the percentage of students eligible in October 2019 was nearly 53 percent, rising to more than 86 percent at one elementary school serving almost 500 students. In Nashua, the total eligibility rate was 41 percent, with one school serving more than 400 students having more than three quarters of students eligible.[viii] This provides additional evidence that children in Manchester and Nashua, which are more racially and ethnically diverse cities than the state as a whole, are more likely to face financial hardship at home.
These data suggest that many children in New Hampshire who identify as a racial or ethnic minority may not only face higher likelihoods of poverty or lower incomes at home, but may also live in communities where the resources available to friends and neighbors may also be limited, decreasing their abilities to provide support to one another in times of need.[ix]
Inequities in Health Impacts and the COVID-19 Crisis
These resource inequities also have consequences for health, which has become more evident during the COVID-19 crisis. Lower incomes and fewer assets mean housing options may be more limited, and available options in densely developed areas may make distancing more difficult to accomplish. The need for access to public transportation also necessitates finding housing near to public transportation networks, which are primarily located in the state’s larger cities, or being able to access services by walking, riding a bicycle, or through some form of transport service. Access to medical care may also be more difficult for some populations, both due to a lack of health coverage and the physical location of the nearest medical facilities. These and other factors have resulted in racial and ethnic disparities in incidences of COVID-19 across the country and in New Hampshire that help demonstrate the broad implications of longstanding inequities.[x]
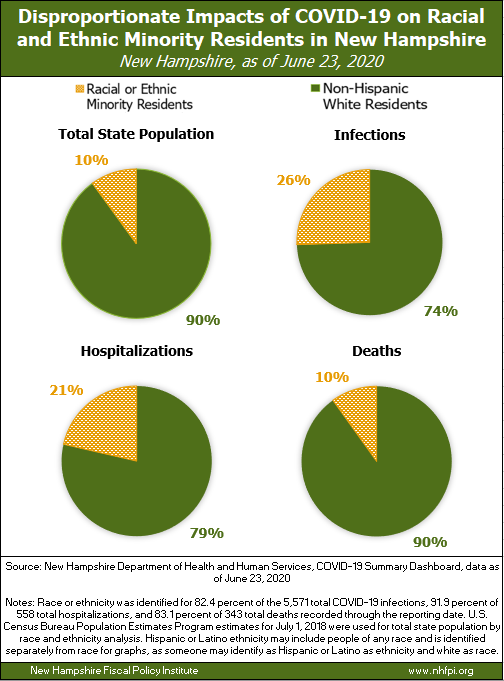
While non-Hispanic white residents make up 90 percent of the New Hampshire population, they constituted only 74 percent of identified COVID-19 infections as of June 23, 2020. More than one in five hospitalizations were of someone who identified as something other than non-Hispanic white. The COVID-19-related deaths as of June 23 were approximately proportionate to the population sizes, which may reflect the median age of the different racial and ethnic groups in the state, as older adults are more likely to be non-Hispanic whites and are more likely to be vulnerable to severe complications from COVID-19.[xi] These figures indicate the health impacts of the COVID-19 crisis are falling disproportionately on non-white and Hispanic communities in New Hampshire.
Creating an Equitable Economic Recovery
Many factors have contributed to longstanding inequities in incomes and resources available to racial and ethnic minority populations, including historic and systematic disenfranchisement and denial of opportunities. Black, African American, Hispanic, and Latino residents of New Hampshire face considerably greater resource limitations, on average, and the associated implications complicate their abilities to recover from this crisis and to have the same opportunities as other New Hampshire residents. Building an economic recovery that lifts all Granite Staters equitably and helps ensure those previously disadvantaged unjustly are equitably included will help make all individuals and families in New Hampshire stronger, and will help ensure a better future for New Hampshire’s children.
Endnotes
[i] See U.S. Census Bureau, 2010 Census Summary File, Table P9 and U.S. Census Bureau, QuickFacts, New Hampshire, 2018 Population Estimates Program.
[ii] Annual population estimates by race from 2011 to 2018, median ages, and components of population change from 2010 to 2019, drawn from the U.S. Census Bureau’s Population Estimates Program, previously published in American FactFinder.
[iii] See the U.S. Census Bureau’s Population Estimates Program.
[iv] For more on national trends, see U.S. Census Bureau, Demographic Turning Points for the United States: Population Projections for 2020 to 2060, revised February 2020 and The Brookings Institution, The U.S. Will Become ‘Minority White’ in 2045, Census Projects, March 14, 2018.
[v] For the poverty thresholds published by the U.S. Census Bureau, see the files published on the Bureau’s web page for historical Poverty Thresholds.
[vi] All data in this section identified as representing the period of 2014 to 2018 are from the U.S. Census Bureau’s American Community Survey.
[vii] See also NHFPI’s May 3, 2020 Common Cents post COVID-19 Crisis Effects Greater on Racial and Ethnic Minority Populations in New Hampshire.
[viii] For free and reduced-price school meal data from October 2019, see the New Hampshire Department of Education, Free and Reduced School Lunch Eligibility reports. For more on free and reduced-price meal programs in New Hampshire, see NHFPI’s May 2019 Issue Brief Education Funding in the House Budget, May 6, 2019, endnote #2.
[ix] For more analysis of resources available at the community level in New Hampshire, see NHFPI’s August 2018 Issue Brief Measuring New Hampshire’s Municipalities: Economic Disparities and Fiscal Capacities.
[x] See NHFPI’s May 3, 2020 Common Cents post COVID-19 Crisis Effects Greater on Racial and Ethnic Minority Populations in New Hampshire.
[xi] Updated infection, hospitalization, and death data for COVID-19 in New Hampshire are available from the New Hampshire Department of Health and Human Services via the COVID-19 Summary Dashboard. See NHFPI’s March 24, 2020 Common Cents post New Hampshire’s Older and At-Risk Populations May Require Greater Levels of Care in COVID-19 Crisis.