New Hampshire is a state with large differences between the more urban regions, primarily in the southeastern part of the state, and less urban regions in the west and north. The southeastern part of the state has larger concentrations of population, higher median incomes among residents, and lower poverty rates compared to the western and northern regions. Analyses of statewide and county-level characteristics provide information on general trends within the state. However, examinations of smaller areas within county boundaries show significant disparities as well. Each New Hampshire municipality has a different population size, income, poverty level, and aggregate property value that impacts the capacity of local governments to attract businesses and residents and provide needed services.
In general, municipal fiscal capacity and local needs for services can range from having high capacity to raise funds and relatively low-cost needs, to having low capacity to raise funds and relatively high-cost needs.[1] This Issue Brief explores the implications that different demographic and socioeconomic characteristics can have in terms of municipal fiscal capacity and local needs across the state.
Past Research and Data Selections
The state of New Hampshire has been performing well economically in recent years, with wages and incomes rising back to pre-Recession levels and the unemployment rate staying below 3 percent since late 2015.[2] However, a closer look at specific regions, counties, and municipalities, reveals that economic growth is uneven between different parts of the state.[3] A 2013 report titled The Two New Hampshires: What Does It Mean? described trends in New Hampshire’s more rural and more urban counties and highlighted significant disparities in terms of population, education level, income, and poverty rates between the different regions of state and the relationships of those characteristics to the economic vibrancy and growth of those regions.[4] Recent research also indicates that communities in the northern part of the state face a substantial lack of job opportunities, challenges with substance misuse, population declines, and higher poverty rates.[5] Using data available at or near the municipal level shows the disparities within counties as well as between larger regions of the state.
Municipalities may be able to attract businesses and residents by providing quality infrastructure and amenities.[6] However, providing public services requires funding, and economic disparities between municipalities can be striking, even within the same county. Municipalities may have different taxable resources to finance those services and different levels of need for those services due to demographics, local workforce availability, resident income and educational attainment, and amenities available.[7] A lack of public resources may reduce educational quality for children and affect the skills of the local workforce in the long-term, limit a community’s ability to attract or retain businesses and residents, and reduce the quality of life for residents, increasing the challenges for local governments to improve services.
Aging demographics and population declines may create additional economic challenges in certain parts of the state, as an estimated one out of every five participants in the current labor force is a worker between the ages of 55 and 64 years.[8] Moreover, certain rural areas have been losing young adults through out-migration.[9] Both aging demographics and population distribution differences across urban and rural areas present short- and long-term challenges at all levels of government in the state.
Child poverty is another concern across the state, as children living in poverty are more likely to have lower academic achievement, which may impact earnings throughout adulthood.[10] In New Hampshire, child poverty estimates have been consistently elevated compared to the senior poverty rate and the poverty rate for the state overall. While higher during the Recession and the slow recovery, New Hampshire’s child poverty rate dropped to an estimated 7.9 percent in 2016 from 10.7 percent in 2015, which was closer to the 2016 overall estimated poverty rate of 7.3 percent statewide. Those in poverty in New Hampshire during 2016 had annual incomes less than roughly $12,000 for an individual and $19,000 for a family of three, depending on the composition of the household.[11]
This Issue Brief examines data on New Hampshire’s counties, municipalities, school districts, and ZIP codes, sourced from the 2010 U.S. Census, the American Community Survey (five-year estimates), 2015 federal tax returns, 2017 municipal property valuation, 2017 Medicaid enrollment, and students eligible for the Free and Reduced-Price School Lunch program for the school year of 2017-2018, to reveal disparities across New Hampshire and within the state’s regions. The datasets used were chosen to reduce uncertainty and the potential for errors in calculations for individual cities and towns, especially those with low populations. Data from program enrollment and the 2010 Census counts, for example, provide more certainty in their measurements than estimates associated with survey-based data, which are based on sampling a population.
Population Distribution, Concentration and Change
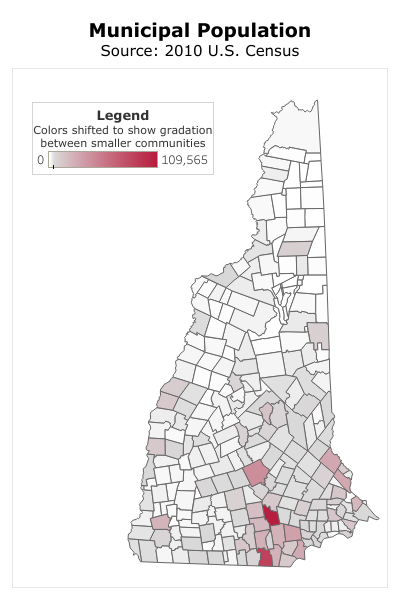
Using 2010 Census data from the U.S. Census Bureau, the map to the right shows population distribution across New Hampshire’s municipalities. The larger the population of the municipality, the darker the shade of red.
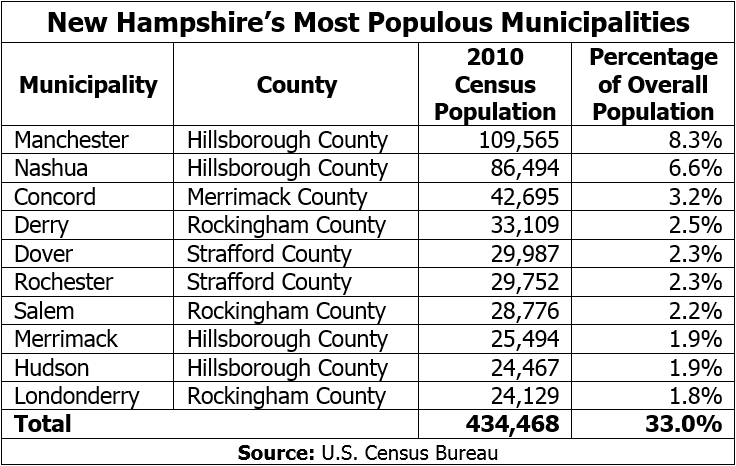
The larger municipal populations are located in urban areas in and around Manchester and Nashua, as well as in Concord, Rochester, Dover, and Portsmouth.[12] Other urban centers, such as Berlin, Claremont, Conway, Keene, Laconia, and Lebanon and Hanover, are also notable in the map as the largest population centers in their respective regions.[13] However, the map generally illustrates that the highest population municipalities in the state are located within or nearer to the greater Boston metropolitan area, and municipal populations generally decrease as distance from the southeastern portion of the state increases.
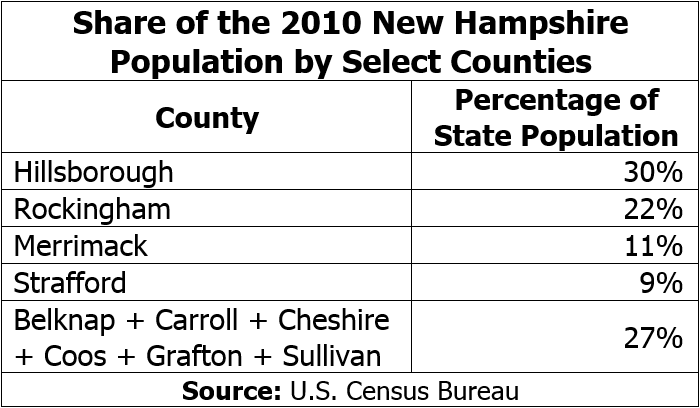
The geographic concentration of the ten most populous municipalities in the state reflects the concentration of the population’s overall distribution. The ten largest municipalities, all located in the four more urban counties in the state, included almost a third of the overall state population. Those four counties are closest to metropolitan Boston: Hillsborough County, Merrimack County, Rockingham County, and Strafford County. The two counties of these four that border Massachusetts – Hillsborough and Rockingham – have more than half of the overall state population, which was counted at 1,316,470 by the 2010 Census. The state’s six more rural counties – Belknap, Carroll, Cheshire, Coos, Grafton, and Sullivan – account for just over a quarter of the overall state population.
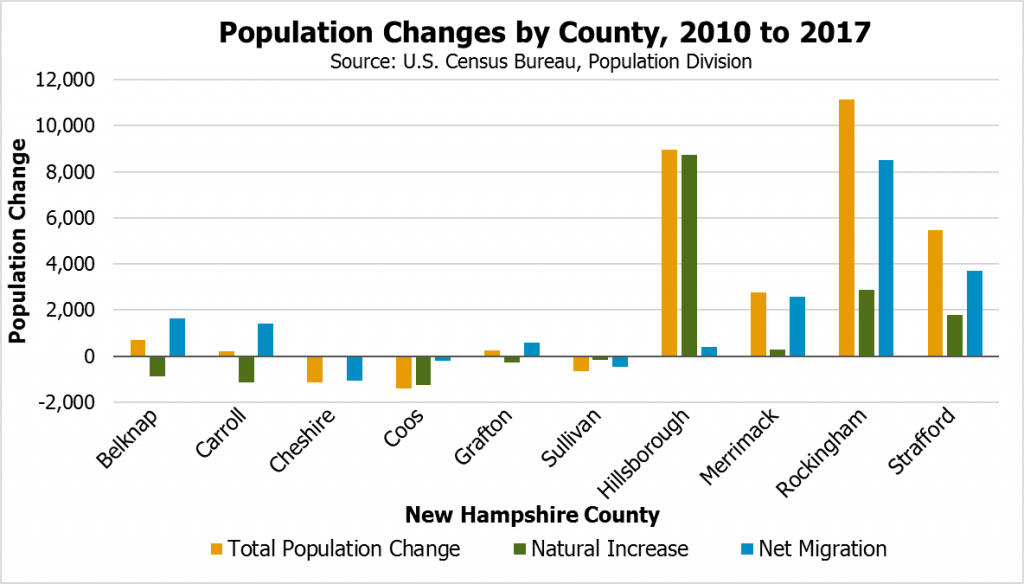
Analysis of estimated changes in county demographics between 2010 and 2017 across New Hampshire shows that the state’s four more urban counties gained population through natural increase, meaning more births than deaths, and in-migration from outside of the county, whereas the state’s six more rural counties experienced natural decreases. Belknap County, Carroll County, and Grafton County had overall population increases solely because of in-migration to those counties. Cheshire County, Coos County, and Sullivan County had overall out-migration, in addition to the natural decrease, which may pose additional challenges to the economy and service delivery in those areas. Despite estimated overall population decreases in Cheshire County and Sullivan County since 2010, both counties experienced a slight increase in overall population between 2016 and 2017 due to in-migration, according to U.S. Census Bureau estimates, which may indicate a positive population trend in the future.
Population changes through natural increases or decreases and in-migration directly impact the size of the local labor force in different regions across the state. Relative to the size of their labor forces in 2010, Strafford, Rockingham, and Hillsborough counties saw large increases, while Belknap, Carroll, Cheshire, Coos, and Sullivan counties saw significant declines in labor force size by 2017.[14]
The population’s distribution and population changes provide evidence as to how different regions and municipalities in the state are attracting residents. Urban pockets of the state have attracted population to urban centers and localities in the immediate vicinity, where families may have economic opportunities and access to services. However, in recent years, rural areas of the state may not have been as attractive to new residents, with possible exceptions for those areas with recreational and natural amenities, particularly in the Lakes Region.
Median Age by Municipality
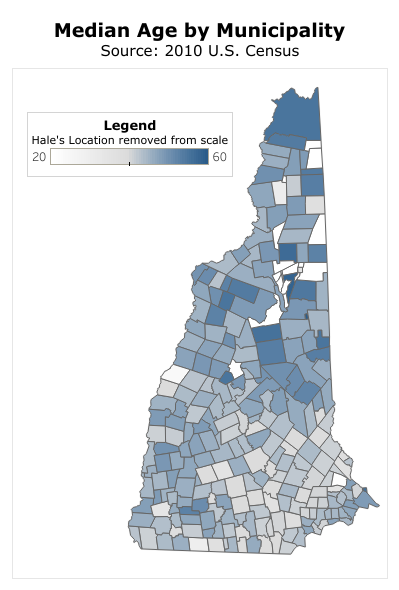
Population age is another important demographic characteristic of a municipality, as it may indicate the size of the labor force and the age and life stage of residents. Using the 2010 Census data, the map to the right shows median age of the population in the state’s populated municipalities. The greater the median age in the municipality, the darker the shade of blue. As demonstrated by the lighter shading, municipalities located closer to the greater Boston metropolitan area typically have a lower median age, and municipalities located farther north in the state tend to have a higher median age.
The 25 municipalities with the oldest median age in 2010, which includes the towns of Franconia, Freedom, Hancock, Moultonborough, New Castle, Sandwich, Tuftonboro, and Wolfeboro, all had median population ages over 50 years old in 2010. Hale’s Location had the highest median age, which, at about 68, was approximately ten years higher than the next oldest community. At the opposite end of the spectrum, the 25 municipalities with the youngest median ages in 2010, which included Manchester, Nashua, Derry, Goffstown, and Weare, had median population ages lower than 40 years old. Median ages in communities with substantial student populations, such as Durham, Hanover, Keene, and Plymouth, were considerably younger than the statewide median as well.
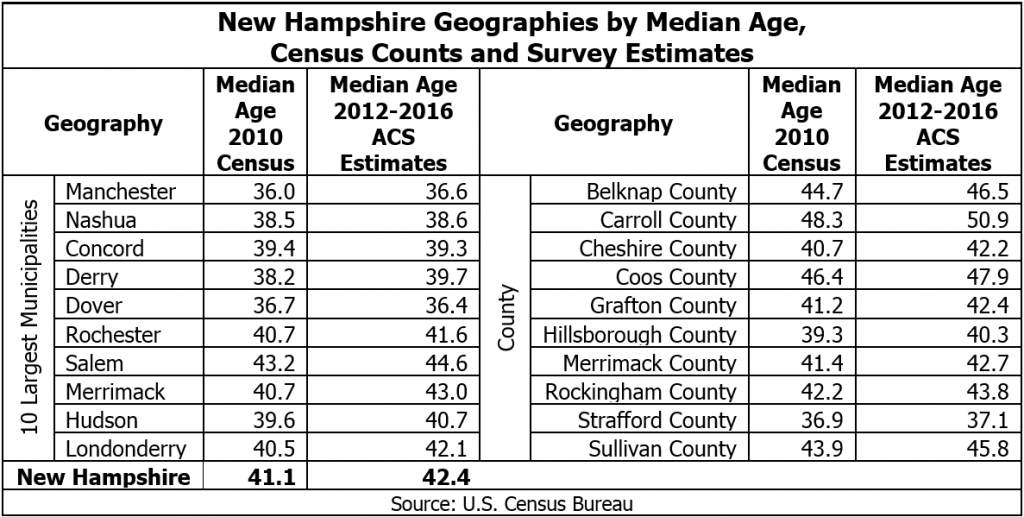
Comparing the analysis of 2010 Census population distribution with community median ages, the regions of the state with smaller populations appear to also have larger proportions of older adults, and the regions with larger populations appear to have larger shares of younger residents. The state’s six more rural counties that are not situated within or near the greater Boston metropolitan area present median population ages above 40 years old; Carroll County and Coos County were the oldest, with median population ages of over 48 and 46 years, respectively. The counties situated closer to metropolitan Boston present median population ages around the lower 40s or below; Strafford County and Hillsborough County were the youngest, with median population ages of 36.9 and 39.3 years old, respectively. Furthermore, the ten most populous municipalities, with the exception of Salem, all had median ages below 41 in 2010.
Using more recent estimates from the 2012-2016 American Community Survey (ACS), the most populous municipalities are the same ten municipalities as in the 2010 Census counts. Any estimated changes in median age in these municipalities were small; ACS data are less certain than census counts, but several midpoint estimates slightly increased from the 2010 Census in the more recent data. As an example, in 2010, Manchester and Salem had median ages of 36 and 43.2, respectively. In the more recent data, both municipalities had estimated median ages of 36.6 and 44.6, respectively.
In terms of counties, there was also a slight potential increase in median age, according to these ACS data; the largest increase in these estimates was in Carroll County, where median age was estimated at 50.9 years old. Notably, Carroll County was the only county where the estimated median age surpassed 50 years old. The second oldest county by median age was Coos County at 47.9 years old. In contrast, the youngest estimated median age was Strafford County at 37.1 years old, which clearly indicates the large age differences across the New Hampshire.[15]
Comparing Carroll County with southern neighbor Strafford County shows the apparent differing trends in aging population between regions. Between the 2010 Census and 2012-2016 ACS estimates, the median age increased 2.6 years for Carroll County, compared to 0.2 years for Strafford County. Across the same period of time, population aging was much more pronounced in Carroll County relative to Strafford County.
Property Wealth by Municipality
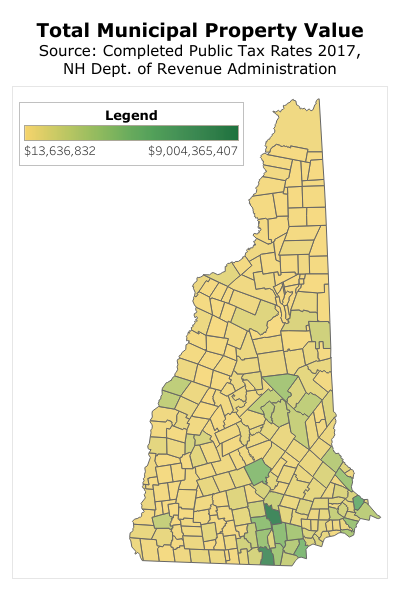
Municipal property valuation indicates the total value of properties in a municipality that city and town governments can use as a tax base to raise revenue, unadjusted for population or service needs. Using 2017 municipal property valuation data from the New Hampshire Department of Revenue Administration (NH DRA), the map to the right shows the total municipal property valuations across the state’s municipalities. The larger the property valuation of the municipality, the darker the shade of green.
Municipalities with larger populations generally have the highest total property valuation, as properties in the municipality contribute to the total valuation and larger municipalities will necessarily have more housing, commercial buildings, and other taxable property. In fact, the ten municipalities with the highest total property valuations include Manchester, Nashua, Salem, Concord, Londonderry, Merrimack, and Dover, which were all among the state’s top ten most populous municipalities in 2010. Although Manchester and Nashua have the highest property valuations, that does not necessarily indicate these cities have a tax base large enough to support the service needs of their populations with greater ease than other municipalities that have lower overall property valuations, as the costs of service needs vary with population and other factors.
Municipalities with the highest total property values also tend to be located closer to metropolitan Boston or the state’s more urban municipalities as well as near recreation areas in the White Mountains, Lakes, and Seacoast regions.[16]
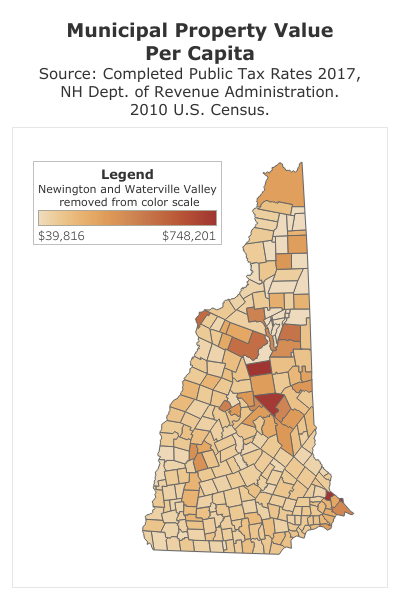
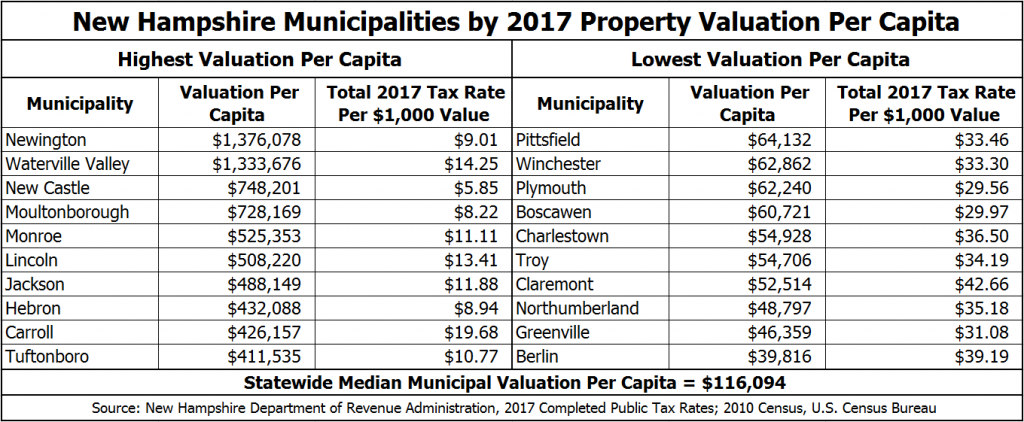
However, if we compare the total municipal property value in per capita terms for each municipality, it is possible to identify five different types of municipalities. Using the 2017 municipal property value data from the NH DRA and the 2010 Census population count, the map below shows the municipal property value per capita across the state’s municipalities. The larger the property value per capita of the municipality, the darker the shade of brown.
In per capita terms, the most pronounced group of municipalities are the ones located in recreational areas that are likely to have second homes or where property values are higher due to natural amenities, such as mountains or bodies of water. Waterville Valley, New Castle, and Moultonborough are examples of these communities. Vacation or second homes likely increase the property value per capita the most near lakes such as Newfound, Sunapee, and Winnipesaukee, in certain communities adjacent to or within the White Mountains and recreational facilities in those municipalities, and in some North Country communities with relatively low permanent populations.
The second group of municipalities are the ones that have many commercial or industrial properties and relatively low populations. Newington is likely the most striking example of this phenomenon, but high commercial property values in neighboring Portsmouth likely contribute substantially to a higher property tax base there. Other communities, such as Seabrook, may substantially benefit from electric power plants and other large facilities.[17]
The third group is comprised of municipalities with high population densities, such as Manchester and Nashua. Those municipalities have high total property values but lower property values per capita, which may indicate that the local government is able to pay for sufficient infrastructure, such as water systems and other utilities, in some instances because they are able to afford the high costs of establishing some of these services and only have to pay to expand them for additional population. However, communities with higher populations may also have greater or more complex service needs that smaller communities may not experience.
The fourth group is comprised of relatively wealthy communities with mid-size to large populations that have valuations per capita in the middle or the upper-middle of the range. Those are typical residential communities in suburban areas of the southeastern part of the state, such as Bedford and Bow, which may attract middle- and high-income families with the services offered, including the quality of schools and other resources available to residents. These and other municipalities may have less property wealth per capita than the most property-rich communities in the state despite higher incomes and a healthy residential housing stock because of a larger average number of people living in each home, in contrast to those communities with high levels of second and vacation homes.
Finally, there are the communities that likely struggle the most to raise funds, which are municipalities that have relatively low total property valuations and low- to mid-size populations. Berlin and Claremont are examples of communities with mid-size populations, and Allenstown, Lisbon, Troy, and Pittsfield are examples of smaller communities, that share these characteristics. This group of communities may include certain municipalities in the southeastern part of the state and in areas with higher property wealth more generally. For example, Derry has approximately half of the property valuation per capita as neighboring Londonderry, which suggests substantially differing capacities to provide services paid through property tax revenue.
Property taxes are the primary method through which local governments raise money in New Hampshire, and in some cases are the only viable option for raising revenue.[18] Property tax rates and property values combined determine the amount of taxes paid, making the property valuation in a municipality important for determining the tax rate required to raise a certain amount of revenue; while the dollar value of taxes paid by a property owner depends in part on the property’s value, there are significant disparities in tax rates between municipalities. Municipalities with lower populations may face a higher cost per capita to establish and maintain public infrastructure at the local level. This could have a great impact on access to services and potential municipal investments. Municipalities with smaller populations and property tax bases often struggle to raise funds to finance needed infrastructure, as each resident must face higher financial cost per dollar of property value to fund investments. Coupling smaller communities’ limited fiscal capacity with their higher incidence of aging population, inequities in access to services and economic opportunity may emerge across the state’s municipalities.[19]
Municipal Median Household Income vs. State Median Household Income
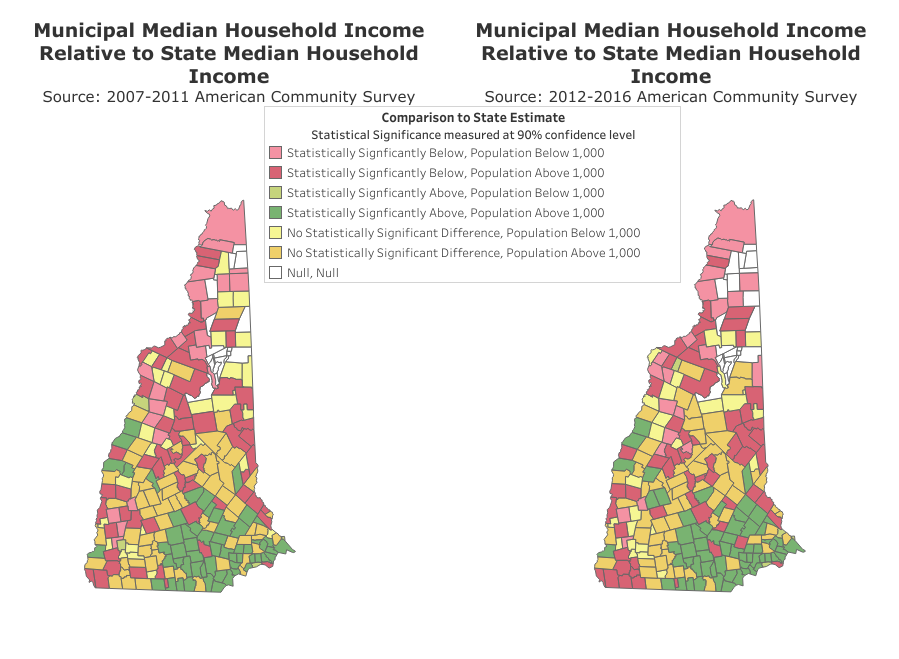
Using estimates from the ACS for 2007-2011 and 2012-2016, the maps below display the median household income estimates for New Hampshire cities and towns relative to the state’s median household income for each five-year period. Lighter colors are used to identify the comparison between municipal and state estimates in municipalities that have estimated populations of less than 1,000, which indicates that survey data results can be subject to significant uncertainty, as sample sizes used in these survey data can be very small and should be interpreted with caution.
Both maps show that municipalities with estimated median household incomes below the statewide estimate are mainly located in the northern and western parts of the state, quite removed from the Boston metropolitan area, whereas municipalities with higher median household incomes are generally located in the southeastern part of the state, closer to the Boston metropolitan area. Notable exceptions to this trend include some of the state’s larger cities, such as Manchester, Concord, Dover, and Rochester, which have lower estimated median household incomes than the estimated statewide median in both five-year periods analyzed, and higher incomes in certain municipalities in the Upper Connecticut River Valley, such as Hanover.
Comparing the two periods, it is possible to see similar economic trends across municipalities. Potential changes are mainly apparent at the edges of the Boston metropolitan area. Hillsborough County provides examples of the disparities between municipalities within counties, as it includes lower-income areas in urban Manchester and in more rural western Hillsborough County as well as higher-income communities nearer to Manchester, Nashua, and the Boston metropolitan area. Rockingham County also shows internal variation, as it has a relatively large number of communities with median household incomes estimated to be higher than the statewide median, but Seabrook remained below the statewide median in both datasets. Grafton County has several communities that appear to have higher median household incomes than the statewide median in the southwestern part of the county, and adjacent communities in northern Sullivan County may have higher incomes as well. However, Lebanon has a lower median household income than the statewide median in both datasets, and other areas of both Grafton and Sullivan counties appear to have lower incomes as well. Finally, Belknap County, Carroll County, and Coos County all lack any communities with median household incomes estimated to be higher than the statewide average. However, some of those communities, especially in Carroll County and Coos County, have very small populations, making survey data results less certain.
The data from these two periods, as well as the identified changes, suggest that income disparities between different geographic areas of the state are persistent and may be increasing, with median household incomes higher than the statewide estimate in southeastern municipalities, and relatively lower median household incomes in the northern region and certain areas of the central and southwestern regions of the state. They also suggest considerable median household income disparities exist within counties.
High Incomes Across New Hampshire
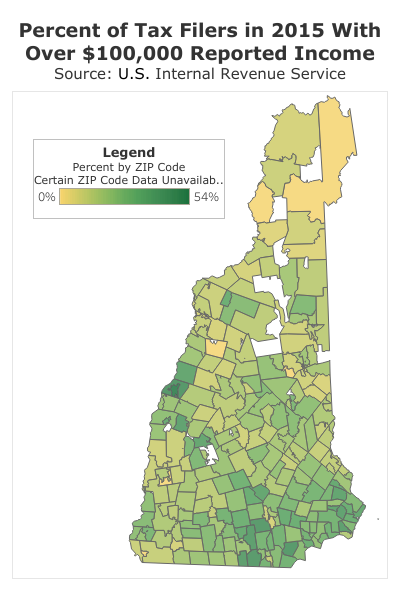
In 2015, New Hampshire residents filed almost 685,000 federal tax returns. Roughly 20.6 percent of tax returns in the state reported incomes of $100,000 or more. These tax returns may have included individuals, joint filers, and families with and without dependents, and this analysis does not control for income collected per capita. However, differences between ZIP Codes indicate a significant disparity in filers reporting high incomes, as in eight ZIP Codes more than 40 percent of total tax filers reported income of $100,000 or more and one with over 50 percent of filers reporting such incomes, whereas in other ZIP Codes no tax filers reported such income levels.
Using publicly-available data from the United States Internal Revenue Service on aggregated 2015 tax returns, the map shows the percent of tax filers with $100,000 or more in reportable income across the state’s ZIP Codes.[20] In the map, darker green represents ZIP Codes with greater shares of tax filers with $100,000 or more in reportable income.
Following the previous indications of regional income disparities between southeastern and northern regions, the southeastern part of the state has the largest shares of tax filers with $100,000 or more in reportable income, whereas the northern part has the lowest shares. Comparing to the previous analysis on municipal property valuation, communities in the southeastern region both generally having large proportions of high income tax filers and relatively high property values indicates a likely interaction between these two measures of fiscal capacity, as higher income individuals and families may seek out and be able to afford more expensive properties.
This measure showing distributions of higher-income individuals continues to suggest more opportunities to earn higher incomes exist in the southeastern part of the state than in other regions. Opportunities for higher incomes may attract people to certain regions, and fewer opportunities for higher incomes may conversely make other regions less attractive for mobile populations, creating the risk of a downward cycle for lower-income areas.
Both the median household income, as well as the share of high-income tax filers by municipality, can be indications of municipal fiscal capacity. Higher resident incomes in municipalities allows local governments to increase revenue to improve service provision and investment. However, if municipalities have a large number of residents at lower income brackets, local governments may face greater difficulty raising funds, diminishing the quality of services they provide and their ability to make necessary investments.
Indicators of Poverty Risk Across New Hampshire
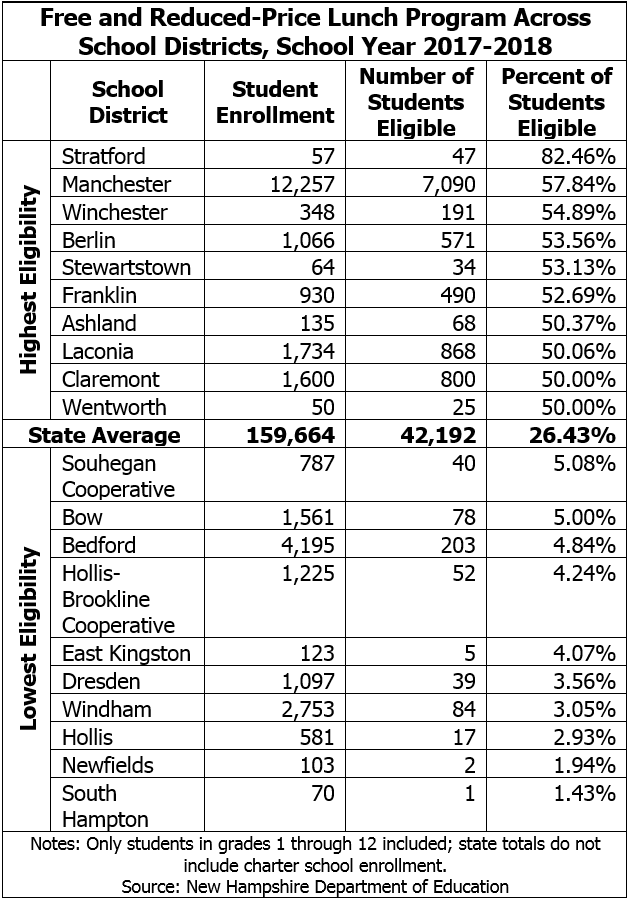
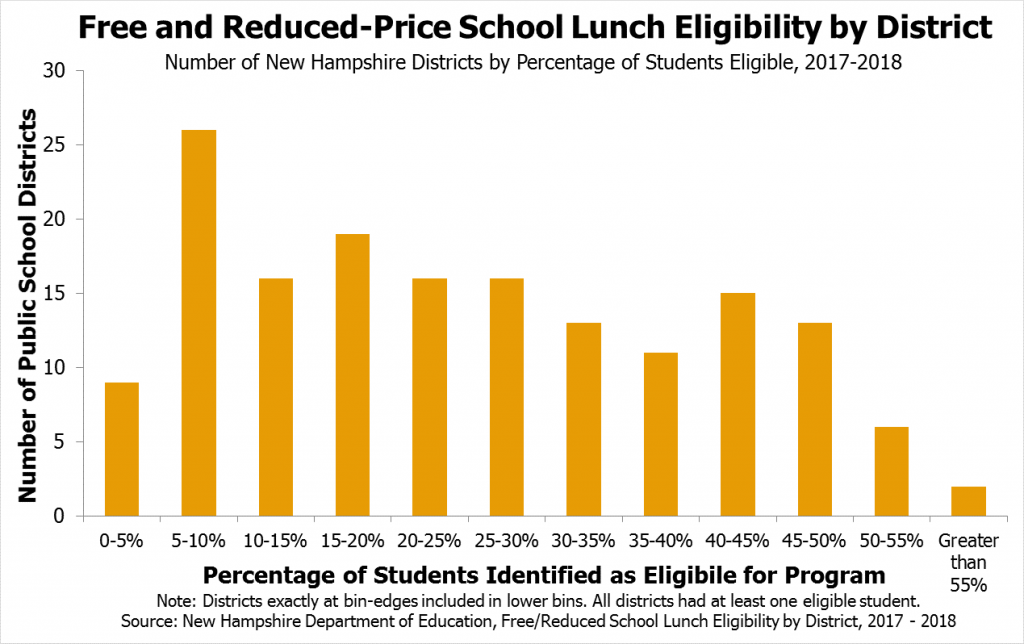
Economic disparities can have greater long-term effects when children are raised in poverty, and child poverty can impact educational attainment, health, and earnings in adulthood.[21] Adverse impacts may be even more pronounced when the communities in which children are raised face high and persistent poverty rates for generations.[22] The Free and Reduced-Price School Lunch program can be a useful indicator of child poverty levels, as eligibility is determined in part by specific family income criteria. The program likely does not provide a complete picture, however, as it requires either application or enrollment through separate aid programs. The distribution of New Hampshire school districts by percentage of children found eligible for the Free and Reduced-Price School Lunch program for the 2017-2018 school year indicates significant differences in the number of low-income children across school districts in the state.
All 10 school districts with the highest Free and Reduced-Price School Lunch program eligibility rates had at least half of total pupils in their school district found eligible for the program; the Stratford School District had the highest rate of eligibility, with approximately 82.5 percent of total pupils qualifying for the program. Across the 10 school districts with the lowest eligibility rates, no school district had more than 6 percent of pupils in their systems eligible for the Free and Reduced-Price School Lunch program.
While those 10 school districts with the highest rates of Free and Reduced-Price School Lunch program participation include the state’s largest city, they also include smaller cities and several rural towns in the northern or western parts of the state. In contrast, eight of the ten school districts with the lowest participation rates are in more suburban or exurban areas of Rockingham or Hillsborough counties, while the remaining two are based in southern Merrimack County and southwestern Grafton County. Notably, the presented data are for school districts, and rates for individual schools within districts may be higher.
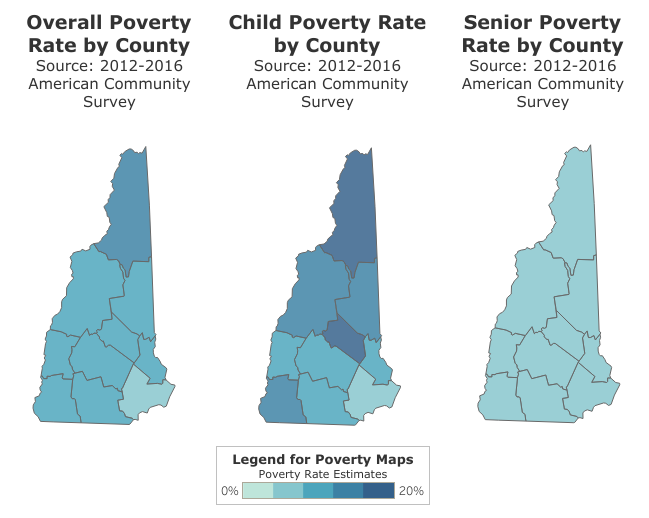
Children are more likely to live in poverty in New Hampshire than the population overall. Analyzing county poverty rates among children, seniors, and the overall population, child poverty estimates are statistically significantly higher than the senior poverty rate in every county in New Hampshire, and higher than the overall poverty rate in six out of ten counties.[23] In terms of regional differences, child poverty is clearly the lowest in Rockingham County and generally increases the further the county is from the Boston metropolitan area.
Comparing median household income by municipality with the different rate of child poverty across the state’s regions, higher rates of child poverty are seen in the northern part of the state, where municipal median household incomes are statistically significantly below the state’s estimate. Because of the long-term social effects of child poverty, maintaining and expanding programs and policies that help alleviate poverty conditions, such as the Free and Reduced-Price School Lunch program, may yield substantial long-term benefits. However, municipalities may face constraints for raising funds to support their own additional or new programs as local government revenue relies heavily on property taxes.[24]
Senior poverty across counties ranges from 4.3 percent to 8.0 percent. Compared to the statewide senior poverty rate (5.6 percent), only Merrimack County (4.7 percent) and Rockingham County (4.3 percent) were estimated to be statistically significantly lower than the statewide estimate, and Cheshire County (7.8 percent) and Coos County (8.0 percent) were statistically significantly above. Establishing and supporting policies that address poverty among seniors and improve senior well-being will become more imperative as the elder population in the state increases. All levels of government may need to enhance awareness of issues related to senior poverty and implement programs targeted toward addressing the needs of older populations, such as housing affordability and adaptability, transportation, mobility, and community engagement.
Medicaid Data by Municipality
Aging demographics may also prompt additional concerns regarding population health and health care costs. As previously identified, New Hampshire has significant disparities in the population’s distribution and median population ages between the northern and southeastern regions of the state, as municipalities located closer to metropolitan Boston typically have lower median ages and municipalities located farther north in the state tend to have higher median ages.
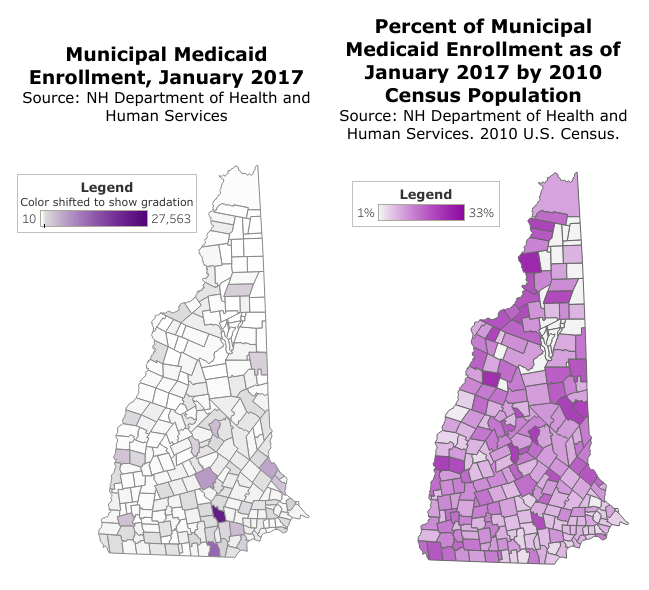
Using the January 2017 month-end count of Medicaid enrollment by municipality provided by the New Hampshire Department of Health and Human Services, the map on the left shows the total number of residents enrolled in Medicaid by municipality. Medicaid generally seeks to provide health coverage for low-income people, with particular parts of Medicaid focused on certain populations such as children, the elderly, and those with disabilities.[25] The larger the number of residents enrolled in Medicaid, the darker the shade of purple. The municipalities with the largest total number of enrollees also tend to have the largest total populations, such as Manchester, Nashua, and Concord, followed by other municipalities with a large number of residents overall but also relatively older or lower-income populations, such as Berlin, Conway, Laconia, and Rochester.
Adjusting for the large population differences across the state, analyzing the share of the total population that is enrolled in Medicaid by municipality provides a different indicator for the potential local needs for providing services to residents with low incomes, including certain older adults and residents with disabilities. Using the total number of enrollees in Medicaid by municipality for January 2017 and the 2010 Census population count by municipality, the map above shows Medicaid enrollees as a percentage of the total population. The larger the number of residents enrolled in Medicaid as a percentage of the total population of the municipality, the darker the shade of purple.
With certain exceptions, the trend of general disparity between the northern and southeastern parts of the state is clearly held by this metric again. The southeastern region of the state, with the exceptions of Manchester and several other smaller municipalities, appears to have smaller shares of the population enrolled in Medicaid, whereas the southwestern and, especially, the northern parts of the state have larger shares of residents enrolled.
Although Medicaid coverage is primarily paid through state and federal government dollars, certain long-term supports and services, particularly nursing home care, are paid in part by counties. Counties primarily raise tax revenue through property taxes. Differences in median ages, property values, and incomes across the state suggest that counties in the northern part of the state have less fiscal capacity but may face comparatively larger responsibilities in caring for residents.
Food Stamp Program Enrollment
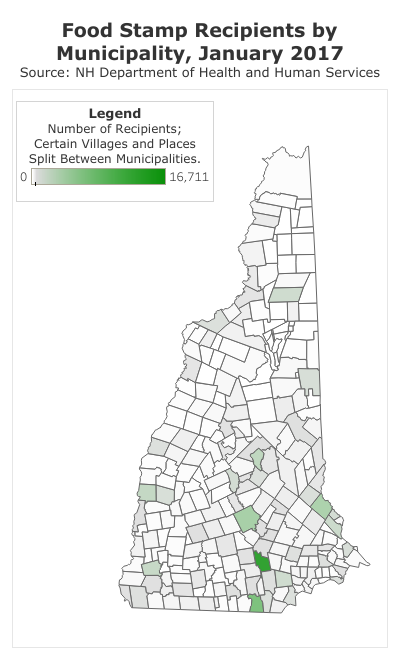
The New Hampshire Food Stamp Program, often identified by the underlying federal program called the Supplemental Nutrition Assistance Program (SNAP), provides low-income individuals and families with resources to purchase certain food items at grocery stores and other food retailers. Recipients can qualify for SNAP in New Hampshire in a number of different ways, including through enrollment in certain other assistance programs; generally, SNAP recipients in New Hampshire qualify because they have incomes below 185 percent of the federal poverty threshold.[26] Similar to counts of Medicaid or Free and Reduced-Price School Lunch program enrollees, counts of SNAP participants provides an indicator of the number of people in or near poverty in a community; while based on counts and not survey data, these programs do not provide perfect measures of income or relative poverty rates due to variability in enrollment eligibility, specific populations targeted for service, and varying enrollment rates among eligible populations.
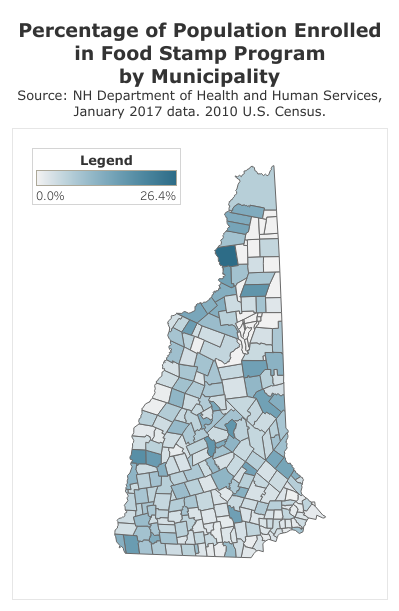
The two maps show the number of SNAP recipients in each municipality in January 2017 and the percentage of each municipality’s 2010 Census population that was enrolled in SNAP. Darker shading indicates a larger number of SNAP participants or a higher percentage of SNAP participants as a percentage of the population, respectively. High concentrations of SNAP enrollees exist in larger urban centers in the state, such as Manchester, Nashua, and Concord. However, differences in SNAP counts relative to populations suggest different economic conditions in many of these communities. Rochester and Dover, neighboring cities in Strafford County, have similar populations, but Rochester had more than twice the number of SNAP participants as Dover. Hooksett had approximately 5,000 more residents than fellow Merrimack County municipality Franklin in 2010, but Franklin had 900 more SNAP recipients than Hooksett in January 2017. Generally, while the number of SNAP participants is higher in larger population municipalities, the enrollment is not as concentrated in larger towns in the southeastern part of the state as the population’s distribution was in 2010. This indicates a greater percentage of the population in rural areas is enrolled in SNAP than in suburban areas in southeastern New Hampshire.
The percentage of the population enrolled in SNAP shown by the second map provides greater insight into the disparities in enrollment between municipalities, potentially indicating the relative concentrations of individuals in or near poverty in these communities. Although municipalities without residents or with very low populations did not include any enrollees in the dataset, the percentage of the local populations enrolled in SNAP was generally highest in the northernmost parts of New Hampshire, particularly in Berlin and along the Connecticut River in Coos and northern Grafton counties. The percentage of the population enrolled in SNAP was in the low single-digits in most communities near to metropolitan Boston, with the larger municipalities of Manchester, Nashua, and Derry being exceptions in the south-central part of the state. Again, rates were generally higher in rural western and northern parts of the state, with small and mid-sized cities and larger towns, including Claremont, Franklin, Laconia, Newport, Ossipee, and Pittsfield, showing notably high rates of SNAP participation.
Concluding Discussions
New Hampshire is a state with large regional differences between the more urban regions, primarily in the southeastern part of the state, and less urban regions in the west and north. The southeastern part of the state includes larger concentrations of population, higher-income residents, and lower poverty rates compared to the western and northern regions generally.
Rockingham and Hillsborough counties, which are situated near to metropolitan Boston, have more than 50 percent of the overall state population and include 46 of the 65 municipalities with median household incomes above the statewide levels, according to the most recently available estimates. Yet, Coos County, the northernmost county in the state, and Cheshire County, the westernmost county in the state, both face challenging demographic transitions, as they have declining populations and higher rates of poverty than the statewide estimate.
Analyzing regional differences does not necessarily provide the full picture of the experience local governments and residents may face. These data suggest occasionally striking differences between municipalities that are neighboring or within the same county in New Hampshire. Those differences are likely related to the natural amenities, economic opportunities, and municipal services localities can offer to their residents, which are, in turn, influenced by the characteristics of those same residents.
The demographic and socioeconomic characteristics of residents will influence the ability of the local government to raise funds to support infrastructure and provide services, which may in turn influence local economic activity and opportunities for residents. In general, municipalities with greater fiscal capacities in the state have more resources to provide services and infrastructure and a larger population falling within traditional working ages. Workers are mobile, and people often work outside of the town in which they live, so communities located next to urban centers or localities that are home to organizations employing a large number of people may also experience higher levels of economic vibrancy. Middle- and high-income families are often attracted to municipalities that can offer good educational and recreational services as well, and may be more likely to have the means to relocate to those municipalities. Municipalities with recreational and natural amenities may also attract wealthier retirees, second-home owners, and tourist activity. Unfortunately, the most fiscally-challenged communities in New Hampshire can face both proportionally high costs and low revenue capacity. Those are the communities facing population declines, a lack of job opportunities, and high poverty rates, along with fewer taxable resources to enable government investments and generally higher property tax rates, which may discourage new or continued business investment or families from moving into those communities.
The state government can help reduce disparities between municipalities and regions of the state. In regions that are struggling, policies to maintain or expand programs designed to combat poverty along with policies to ameliorate the adverse impacts of diminishing populations and to provide access to needed local resources will be key to fostering economic activity. In regions that are growing, programs and policy to address the complex issues created by growth and development may reduce socioeconomic inequities. The growth of municipalities located in areas with natural amenities may also place more pressure on the environment, which may require policies to better manage those resources.[27] Finally, superseding most municipal disparities, every community in New Hampshire will likely face challenges in providing social and health care services to the growing senior population, with significant fiscal implications for the future.
Endnotes
[1] Zhao, Bo and Weiner, Jennifer. Measuring municipal fiscal disparities in Connecticut, New England Public Policy Center, Federal Reserve Bank of Boston, May 2015.
[2] New Hampshire Fiscal Policy Institute. New Hampshire’s Economy: Strengths and Constraints, June 4, 2018.
[3] Bird, Greg. New Hampshire Economic Outlook 2018, New Hampshire Center for Public Policy Studies, November 28, 2017.
[4] Gittell, Ross. The Two New Hampshires: What Does It Mean?, Community College System of New Hampshire, 2013.
[5] Hamilton, Lawrence; Fogg, Linda and Grimm, Curt. Challenge and Hope in the North Country, National Issue Brief #130, Carsey School of Public Policy, University of New Hampshire, Fall 2017.
[6] Gale, William G.; Pack, Janet Rothenberg and Potter, Samara R. Problems and Prospects for Urban Areas, Policy Brief: Conference Report #13. The Brookings Institution, July 2002.
[7] Zhao, Bo and Weiner, Jennifer. Measuring municipal fiscal disparities in Connecticut, New England Public Policy Center, Federal Reserve Bank of Boston, May 2015.
[8] U.S. Census Bureau. 2012-2016 American Community Survey, New Hampshire Labor Force Participation by Age, accessed via American FactFinder; Bird, Greg. New Hampshire Economic Outlook 2018, New Hampshire Center for Public Policy Studies, November 28, 2017.
[9] Johnson, Kenneth M. New Hampshire Demographic Trends in the Twenty-First Century, Carsey Institute, University of New Hampshire, 2012.
[10] Schaefer, Andrew; Mattingly, Beth and Johnson, Kenneth M. Child Poverty Higher and More Persistent in Rural America, National Issue Brief #97, Carsey School of Public Policy, University of New Hampshire, Winter 2016.
[11] New Hampshire Fiscal Policy Institute. New Hampshire’s Economy: Strengths and Constraints, June 4, 2018.
[12] U.S. Census Bureau. New Hampshire: 2010; Population and Housing Unit Counts, August 2012, page IV-I; U.S. Census Bureau. 2010 Census Urban and Rural Classification and Urban Area Criteria.
[13] U.S. Census Bureau. New Hampshire: 2010; Population and Housing Unit Counts, August 2012, page IV-I.
[14] New Hampshire Fiscal Policy Institute. New Hampshire’s Economy: Strengths and Constraints, June 4, 2018.
[15] All county median age estimates had margins of error of +/- 0.3 years in the U.S. Census Bureau’s American Community Survey 2012-2016 data, based on a 90 percent confidence interval.
[16] U.S. Census Bureau. New Hampshire: 2010; Population and Housing Unit Counts, August 2012, page IV-I.
[17] Annual Reports of the Town of Seabrook, New Hampshire For the Year Ending December 31, 2017. “Report of the Assessor,” page 30.
[18] New Hampshire Fiscal Policy Institute. “How We Fund Public Services in New Hampshire,” April 11, 2018, slide 29.
[19] Gittell, Ross. The Two New Hampshires: What Does It Mean?, Community College System of New Hampshire, 2013.
[20] U.S. Internal Revenue Service. “SOI Tax Stats – Individual Income Tax Statistics – 2015 ZIP Code Data (SOI).”
[21] Schaefer, Andrew; Mattingly, Beth and Johnson, Kenneth M. Child Poverty Higher and More Persistent in Rural America, National Issue Brief #97, Carsey School of Public Policy, University of New Hampshire, Winter 2016.
[22] Schaefer, Andrew; Mattingly, Beth and Johnson, Kenneth M. Child Poverty Higher and More Persistent in Rural America, National Issue Brief #97, Carsey School of Public Policy, University of New Hampshire, Winter 2016.
[23] All statistical significance testing completed at the 90 percent confidence level.
[24] New Hampshire Fiscal Policy Institute. Revenue in Revue: An Overview of New Hampshire’s Tax System and Major Revenue Sources, May 2017.
[25] New Hampshire Fiscal Policy Institute. Medicaid Expansion in New Hampshire and the State Senate’s Proposed Changes, March 30, 2018; New Hampshire Fiscal Policy Institute. Common Cents, “Medicaid Assists More Than 185,000 New Hampshire Residents,” July 25, 2017.
[26] New Hampshire Fiscal Policy Institute. The New Hampshire Food Stamp Program, March 10, 2017.
[27] Johnson, Kenneth M. New Hampshire Demographic Trends in the Twenty-First Century, Carsey Institute, University of New Hampshire, 2012.

