The U.S. Census Bureau’s American Community Survey seeks to collect information on demographic and housing characteristics of residents of the United States within different geographies, ranging from describing the entire nation to understanding small communities. The U.S. Census Bureau produces five-year estimates, based on five successive years of survey data to achieve sufficient sample sizes for some geographies to make the survey results meaningful. Sample sizes which are too small, such as those for almost all municipalities in New Hampshire and based on only one year of survey data, do not provide reliable results in many instances.
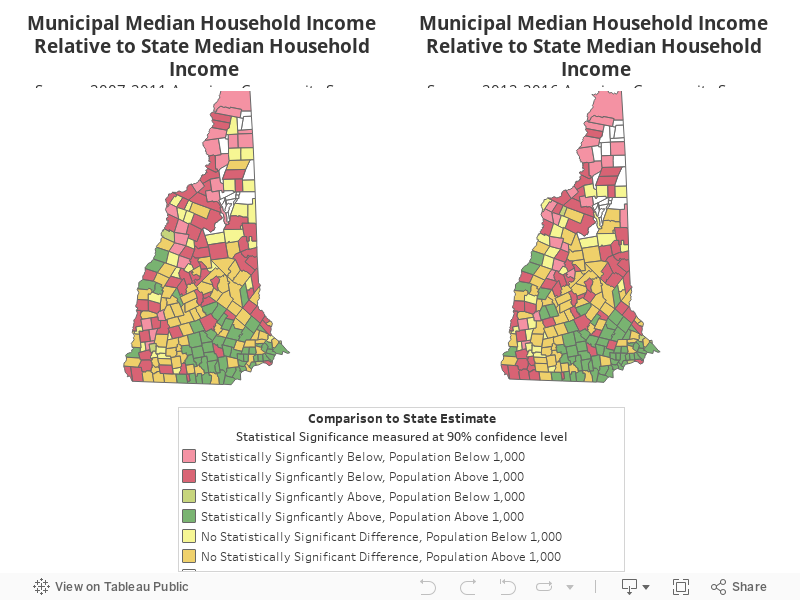
Using estimates from the American Community Survey for 2007-2011 and 2012-2016, the maps below display the median household income estimates for New Hampshire cities and towns relative to the statewide median household income for each five-year period. Lighter colors are used to identify the comparison between municipal and state estimates in municipalities that have estimated populations of less than 1,000, which indicates that survey data results can be subject to significant uncertainty, as sample sizes used in these survey data can be very small and should be interpreted with caution.
Both maps show that municipalities with estimated median household incomes below the statewide estimate are mainly located in the northern and western parts of the state, quite removed from the Boston metropolitan area, whereas municipalities with higher median household incomes are generally located in the southeastern part of the state, closer to the Boston metropolitan area. Notable exceptions to this trend include some of the state’s larger cities, such as Manchester, Concord, Dover, and Rochester, which have lower estimated median household incomes than the estimated statewide median in both five-year periods analyzed, and higher incomes in certain municipalities in the Upper Connecticut River Valley, such as Hanover.
Comparing the two periods, it is possible to see similar economic trends across municipalities. Potential changes are mainly apparent at the edges of the Boston metropolitan area. Hillsborough County provides examples of the disparities between municipalities and within counties, as it includes lower-income areas in urban Manchester and in more rural western Hillsborough County as well as higher-income communities nearer to Manchester, Nashua, and the Boston metropolitan area. Rockingham County also shows internal variation, as it has a relatively large number of communities with median household incomes estimated to be higher than the statewide median, but Seabrook remained below the statewide median in both datasets. Grafton County has several communities that appear to have higher median household incomes than the statewide median in the southwestern part of the county, and adjacent communities in northern Sullivan County may have higher incomes as well. However, Lebanon has a lower median household income than the statewide median in both datasets, and other areas of both Grafton and Sullivan counties appear to have lower incomes as well. Finally, Belknap County, Carroll County, and Coos County all lack any communities with median household incomes estimated to be higher than the statewide average. However, some of those communities, especially in Carroll County and Coos County, have very small populations, making survey data results less certain.
The data from these two periods, as well as the identified changes, suggest that income disparities between different geographic areas of the state are persistent and may be increasing, with median household incomes higher than the statewide estimate in southeastern municipalities, and relatively lower median household incomes in the northern region and certain areas of the central and southwestern regions of the state. They also suggest considerable median household income disparities exist within counties.
For more on the demographics of New Hampshire communities, including higher incomes reported on tax returns by ZIP Code, see NHFPI’s Issue Brief Measuring New Hampshire’s Municipalities: Economic Disparities and Fiscal Capacities.
To see the municipal median household income estimated ranges by community in dollar terms based on the American Community Survey data from 2012-2016, see Municipal Median Household Incomes Compared to the State Median Household Income.
To learn more about statistical significance, see NHFPI’s Common Cents post Interpreting the Significance of the October County Census Data Release.