Estimates from the U.S. Census Bureau’s annual American Community Survey provide insights into the economic conditions facing, and resources available to, New Hampshire residents. Data averaging responses over the five-year period from 2018 to 2022, published in December 2023, allows for more statistical certainty for measurements among smaller population groups than the annual data.
Poverty Thresholds and Poverty Rates by Age, Gender, and Disability
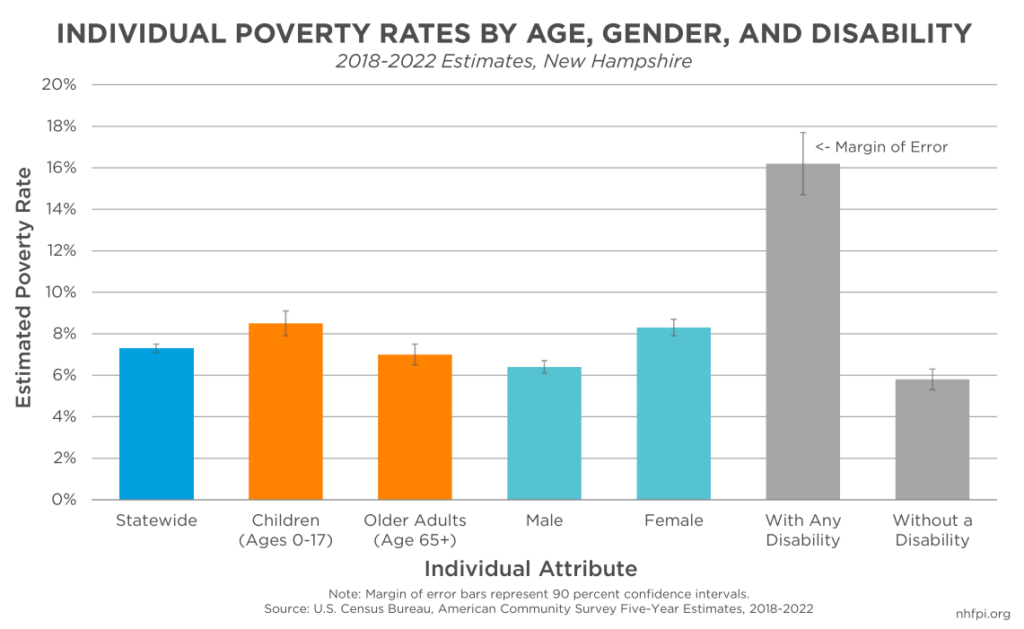
Poverty thresholds are annual incomes for households of varying sizes and compositions below which households are considered living in poverty. The poverty threshold throughout the contiguous 48 states in 2022 was $15,225 annually for an individual under 65 years old, $23,556 for a family of three with one child, and $29,678 for a family of four with two children.
Female Granite Staters and children were more likely to be in poverty during 2018-2022 than the population as a whole. Individuals with disabilities had a much higher poverty rate, 16.2 percent, than the overall population’s 7.3 percent poverty rate or the 5.8 percent rate for those without disabilities. About 30 percent of all people in poverty had a disability, likely impacting their employment options.
Poverty Changes with Educational and Employment Status
Poverty rates for individuals age 16 and over vary substantially by employment engagement. The poverty rate was about 15.8 percent for individuals who did not work, while Granite Staters working part-time or seasonally faced a poverty rate of 8.9 percent. Full-time, year-round workers had a poverty rate of less than one percent. More formal educational attainment is also associated with lower poverty rates. About 20.4 percent of Granite Staters age 25 years and older who did not have a high school degree or equivalent were in poverty, while those with that level of education but no postsecondary classwork was 9.3 percent. Poverty rates fell further for those with some college experience or an associate’s degree (6.1 percent) and for those with a bachelor’s degree or higher (3.0 percent).
Poverty Rates Vary by Race, Ethnicity, and Region
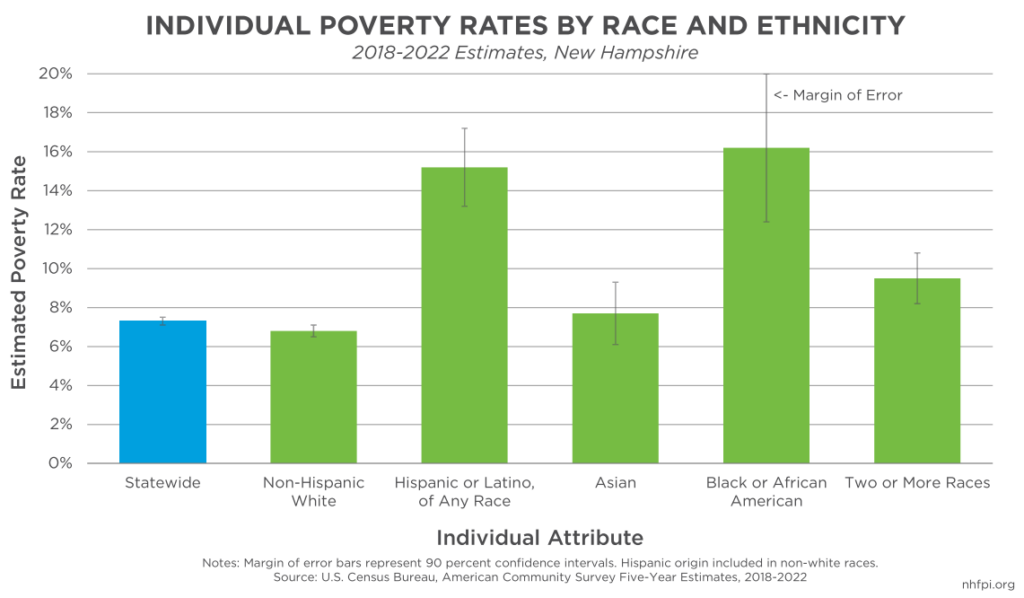
Structural barriers to success associated with race and ethnicity negatively impacted Granite Staters of color. The poverty rates for individuals identifying their ethnicity as Hispanic or Latino, regardless of their race, or as Black or African American were about twice the statewide rate. Individuals identifying as having two or more races also had an elevated poverty rate, while Asian New Hampshire residents and those identifying as white and not Hispanic reported a poverty rate statistically indistinguishable from the statewide estimate.
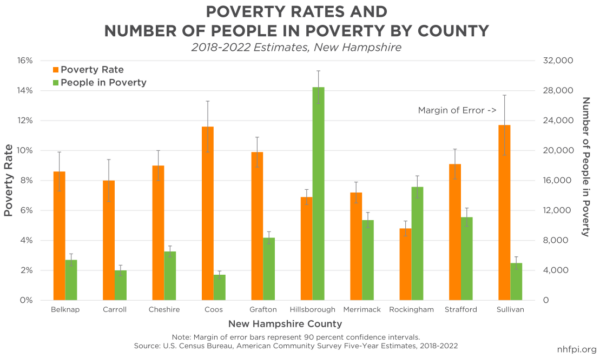
Poverty rates varied by county, with the lowest poverty rate estimated to be 4.8 percent in Rockingham County and high poverty rates in rural Sullivan (11.7 percent) and Coos (11.6 percent) counties. However, Rockingham County was home to the second highest number of people in poverty by New Hampshire county, with an estimated 15,100 people living in poverty, lower only than Hillsborough County, the state’s most populous county and home to 28,500 Granite Staters in poverty.
For more information and citations, see NHFPI’s March 2024 Issue Brief Poverty and Food Insecurity in New Hampshire During and Following the COVID-19 Crisis.