Reductions in the tax rates for New Hampshire’s two primary business taxes have likely resulted in between $795 million and $1.17 billion less in State revenue from Tax Years 2016 through 2024.
The rates of New Hampshire’s two primary business taxes, the Business Profits Tax (BPT) and the Business Enterprise Tax (BET), were reduced iteratively between Tax Year 2016 and Tax Year 2023. In 2015, the BPT rate was 8.5 percent, and the BET rate was 0.75 percent. By 2023, the BPT rate had been lowered to 7.5 percent, and the BET rate was 0.55 percent, which is where both rates remain today. Total business tax revenue rose during this time period, but available evidence suggests aggregate revenue would have been at least $795 million higher than it was over this time period if tax rates had remained at their 2015 levels.
Prior research provides no evidence that reducing these tax rates increased revenue. Research from other states and at the national level, as well as research conducted using New Hampshire-based data, does not indicate lower business tax rates spurred sufficient investment to offset the revenue shortfall generated by reducing the tax rates. Increased business tax revenues in New Hampshire during the last ten years appear to be due to factors beyond the BPT and BET rates, including factors that have significantly increased corporate tax revenues in other states without reducing tax rates.[1]
This analysis is an update of the topline figures in NHFPI’s Issue Brief: State Business Tax Rate Reductions Led to Between $496 Million and $729 Million Less for Public Services, published in August 2023.[2] These figures were able to be updated with new, audited information regarding State revenues, released on March 21, 2025, in the State’s Annual Comprehensive Financial Report and February revenue projections from the Governor and the New Hampshire House of Representatives.[3]
Business Tax Rate Reductions Generated Net Revenue Loss, Not an Increase
BET and BPT tax rates were reduced in Tax Years 2016, 2018, 2019, and 2022, with a BPT-only reduction in 2023. Tax Years coincide with Calendar Years for about 90 percent of business tax filers.[4] Between State Fiscal Years 2015 and 2024, combined revenues from the two business taxes increased 118 percent.[5]
While combined BPT and BET revenues increased during this period, reviews of existing research, separate analyses of economic changes and tax revenue trends in New Hampshire, and data from other states around the country indicate New Hampshire’s business tax rate reductions lowered revenue relative to the amounts the State would have collected if tax rates had remained at their 2015 levels.
There are six key reasons evidence indicates significant revenue was forgone with the business tax rate reductions, rather than more revenue generated due to increased or cross-border investments.
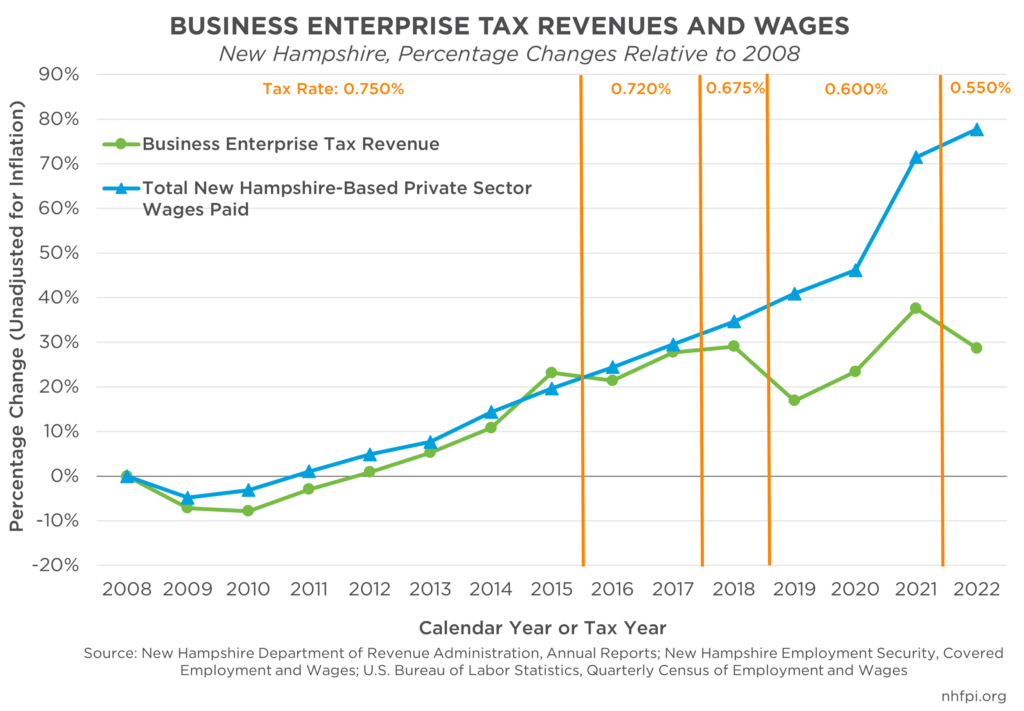
1. Business Enterprise Tax Revenue Declined, Relative to the Tax Base, After Each Rate Reduction
The BET is based on compensation businesses accrued or paid to employees, as well as interest paid or accrued and dividends paid.[6] The State of New Hampshire and the U.S. Bureau of Labor Statistics measure aggregate wages and salaries paid in New Hampshire’s private sector to employees based in the State through the unemployment compensation system.[7] These data correlated closely with BET revenue between 2008 and 2015.[8]
However, after each year of tax rate reduction, BET revenues broke from the trend of growing with aggregate wages and salaries paid in New Hampshire. Between 2008 and 2015, private sector wages paid by businesses increased 20 percent, and BET revenues increased 23 percent. Between 2015 and 2021, however, private sector pay increased 43 percent, while BET revenues increased only 12 percent. Preliminary Tax Year 2022 data show that, while private sector wage growth was 49 percent from 2015 to 2022, BET revenue grew 4 percent during this period, declining from 2021 revenues after a tax rate reduction for 2022. Unadjusted for inflation, BET revenues in 2015 were higher than in 2019, and about the same as in 2020. From 2015 to 2022, the BPT was responsible for 97.7 percent of combined business tax revenue growth.[9] Updated data for 2022, which may offer a more complete picture of Tax Year 2022 filers and returns, will likely be available later in 2025.
2. No Significant Statistical Relationship Exists Between Business Profits Tax Rates and Job Growth
From the creation of the BPT in 1970 through 2022, there is no statistically significant relationship between the tax rate and job growth. Nor does a statistically significant relationship exist between the BPT tax rate and Gross State Product growth, a measure of the size of the economy, in New Hampshire relative to New England or to the United States overall. There is no clear historical pattern that could provide evidence of a direct and overriding causal relationship between BPT rate levels, either higher or lower, and job growth or growth in the State’s economy.
Examining both job growth and growth in the size of the economy in the single years immediately following rate reductions between 2001 and 2024, in both the BPT and the BET, showed lower average job and economic growth in New Hampshire compared to relevant points of reference, such as growth rates in Massachusetts, New England, or the United States overall, during those years. These data suggest there were not single-year bursts of job or economic growth following rate reductions in 2016, 2018, 2019, 2022, and 2023. If the rate reductions spurred sufficient growth to offset revenue losses, economic responses to lower rates would likely be detectable in these datasets, but no such evidence exists.[10]
Personal income per capita, adjusted for inflation, grew faster nationally (17.3 percent), in Maine (20.9 percent), and in Vermont by a slim margin (16.3 percent) than in New Hampshire (16.0 percent) between 2015 and 2023. New Hampshire’s personal income per capita slightly outpaced growth in Massachusetts (15.2 percent) during this time period, while growing faster than Rhode Island (14.3 percent) and Connecticut (13.7 percent). As with the economic and job growth data, these data do not suggest lower business tax rates substantially helped New Hampshire’s personal income relative to the effects from the overall economic environment.[11]
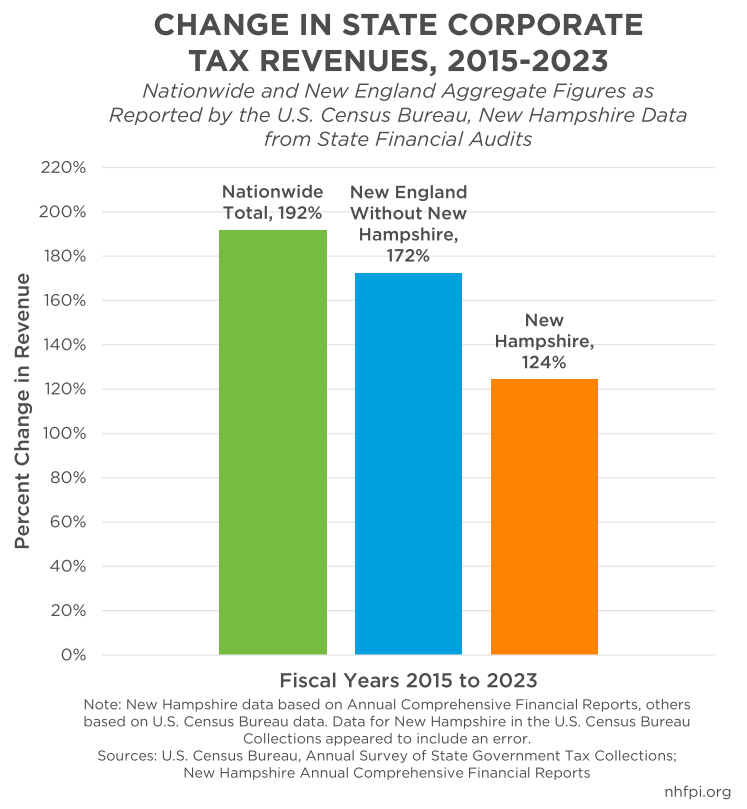
3. State-Level Corporate Tax Revenues Increased Faster Nationally, and in Maine and Vermont, than in New Hampshire
Between fiscal years 2015 and 2023, New Hampshire’s combined business tax revenues increased 124 percent. While significant, New Hampshire was not the only state that experienced this increase. Combined corporate tax revenues from all 50 states rose 192 percent during this period. While New Hampshire’s 124 percent increase outpaced the 105 percent increase in Massachusetts, it fell behind the 166 percent increase in Vermont and the 167 percent increase in Maine during this period. Across all New England, excluding New Hampshire, corporate tax revenues increased by 172 percent. These data suggest that corporate tax receipts would have increased independently of the New Hampshire policy changes.[12]
4. National Corporate Profits Have Surged, and High-Profit Companies Pay Most of the BPT
U.S. corporate profits increased 76 percent from 2015 to 2024, with a significant jump following the initial impacts of the COVID-19 pandemic.[13] While this figure reflects corporate profits around the country, multi-state and multi-national entities that have sufficient sales in the Granite State are required to pay New Hampshire business taxes. A relatively small number of large business tax filers pay most of the revenue collected. For the BPT and the BET combined in Tax Year 2022, the most recent year for which data are available, 2,554 business tax filers, or 5.2 percent of all filers, paid 79.1 percent of business tax revenue. For the BPT specifically, the larger of the two taxes and the one more directly tied to corporate profits, 119 filers (0.2 percent of the total number of filers) paid $326.4 million (40.3 percent of total revenue) in BPT in Tax Year 2022. Another 1,033 filers (1.4 percent) paid $295.1 million (36.4 percent). As a result, 76.7 percent of the State’s largest tax revenue source was paid by 1,152 filers, suggesting large, highly-profitable businesses are a significant component of the tax base. Additionally, 58.4 percent of the revenue collected by the BPT in Tax Year 2022 came from “Water’s Edge” filers, which are multi-part businesses that report as one combined filer; for example, a partnership and a corporation, or two businesses incorporated in different states but operating under the same larger business entity, would file together as a “Water’s Edge” filer. These filers may have component businesses operating primarily outside of the United States, and include large, multi-national businesses.[14]
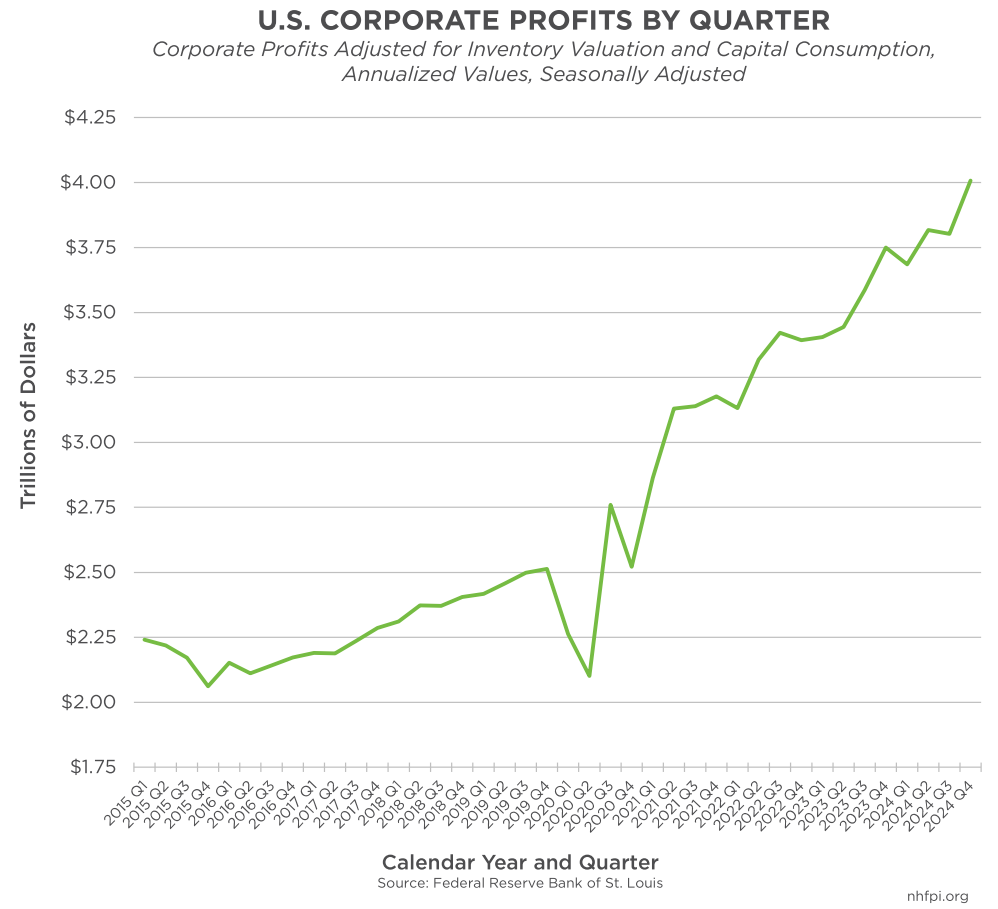
The surge in corporate profits nationally has very likely enhanced New Hampshire’s business tax revenues, as the payments owed to New Hampshire are based on the fraction of total sales a multi-state business has that are attributable to New Hampshire. Certain international sales are excluded from the tax base for multi-national filers, which does enable international profit-shifting and transfer-pricing among business entities.[15]
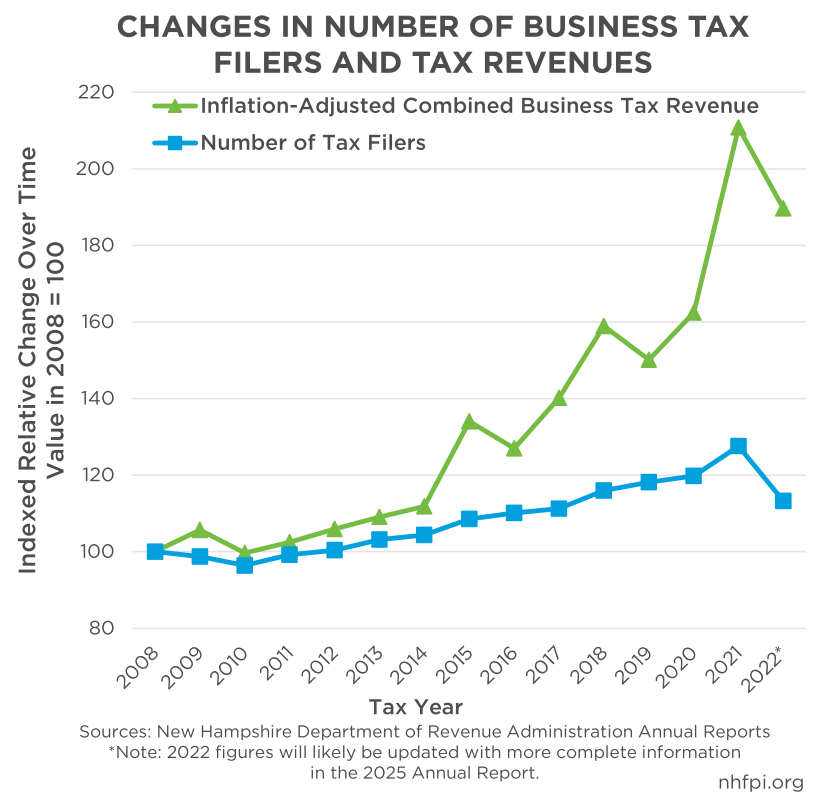
5. The Number of Business Tax Filers Increased, but Likely Not Enough to Explain the Revenue Growth
From Tax Years 2015 to 2021, the number of business tax filers in New Hampshire increased by 18 percent. During this same period, inflation-adjusted business tax revenue increased by 57 percent.[16]
While the number of filers and revenue decreased in preliminary 2022 data, updated data for Tax Year 2022 will likely be available in a future 2025 report from the New Hampshire Department of Revenue Administration and may lead to a revised figure.
If tax revenue growth were driven primarily by businesses moving to, expanding in, or being created within the state, the number of filers would likely increase in a manner more consistent with revenue, rather than falling substantially behind revenue growth.
6. Research from Other States and Nationally Does Not Provide Evidence that Increased Economic Activity from State Corporate Tax Rate Reductions Would Fully Offset Revenue Losses
Research is mixed as to whether changes in state tax policies have significant effects on state and local economies. In a December 2015 literature review published in National Tax Journal, authors found “[m]ajor recent studies reach almost every conceivable finding: tax cuts raise, reduce, do not affect, or have no clear effect on growth.” Relative to state corporate taxes, the authors identified several studies that show no statistically significant negative effects of corporate tax rates on economic growth, while some research suggests higher property taxes have negative impacts.[17]
NHFPI’s 2023 analysis included research from other states and nationally, including peer-reviewed academic analyses published between 2013 and 2022 as well as research from government entities and private-sector organizations published between 2010 and 2023. Relative to returns on investment for economic growth, modeling published by Moody’s Analytics in 2021 identified that a federal corporate tax rate reduction at the beginning of that year would have generated $0.32 more in Gross Domestic Product for every dollar of foregone revenue by the end of the year. Food assistance to households with low incomes through the Supplemental Nutrition Assistance Program, in contrast, would have generated $1.61 per every dollar invested, while aid to state and local governments would have led to $1.34 of growth per dollar of federal spending.[18] In total, the analyses reviewed from a wide variety of sources did not indicate reducing state corporate tax rates is likely to increase revenue, or have a dramatic effect on economic activity overall.[19]
Calculating the Forgone Revenue from Rate Reductions
This Issue Brief updates the figures from NHFPI’s August 2023 analysis, using the same basic methodology and updated data to calculate new estimates for 2022 through 2024. In summary, this methodology uses these steps to generate a higher impact and lower impact set of estimates:
- Calculating the tax base for each of the known years for separated BPT and BET revenues, including 2016 through 2022 in this updated analysis, and estimating revenue that would have been collected using 2015 tax rates[20]
- Estimating the split between the BPT and BET revenues using combined business tax revenue collections for State Fiscal Years 2023 and 2024 as well as available information regarding private sector wages paid for 2023 and the first half of 2024, annualized for this analysis, and employing the prior statistical relationship between private sector wages paid and BET revenues to estimate BET revenues independent of BPT revenues[21]
- Using the constructed splits between BPT and BET revenues and the New Hampshire Department of Revenue Administration’s published distributions of State fiscal year business tax revenues among Tax Years and the average projected revenues for State Fiscal Years 2025 and 2026 from both the Governor and the New Hampshire House of Representatives, estimating the amount of revenue that would be collected each Tax Year by the Tax Year, and thus effective tax rate, to which those revenues can be attributed [22]
- Calculating forgone revenue using these imputed separate BET and BPT estimates by calculating the tax base and applying 2015 tax rates
- Estimating a lower impact scenario by estimating 32 percent feedback from economic growth generated by rate reductions, which is a higher percentage feedback rate than modeling from other states and national estimates that calculated economic responses from corporate tax rate reductions[23]
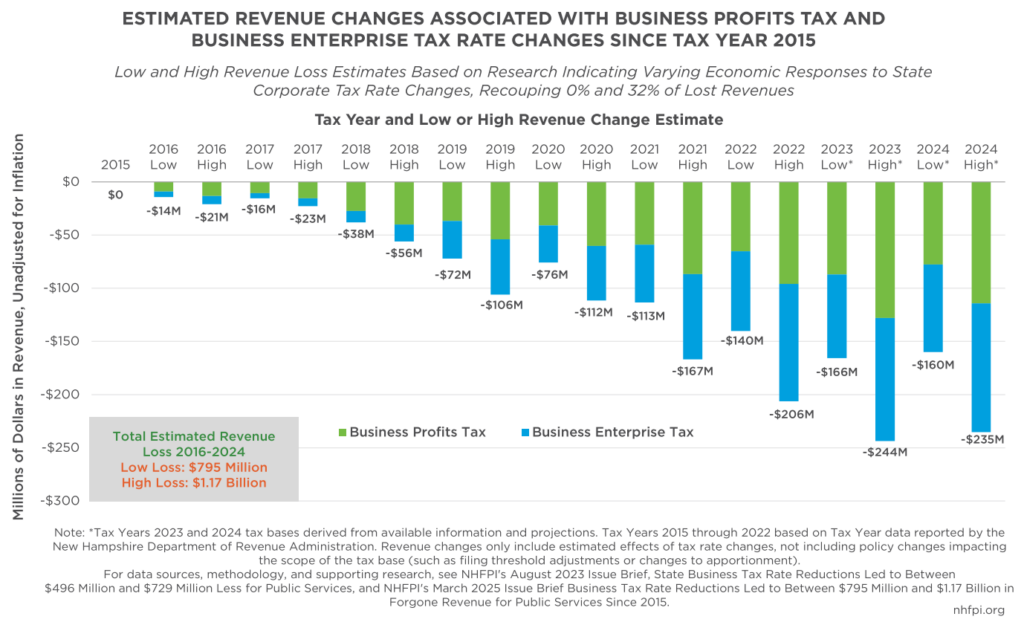
Using tax data from 2016 through 2022, revenue losses would have totaled $470 million in the scenario with 32 percent economic feedback, and $691 million in the scenario without any growth feedback or negative economic effect from loss of services. Using the imputations for Tax Years 2023 and 2024, the total forgone revenue from lower rates relative to their 2015 levels is between $795 million and $1.17 billion in State revenue from 2016 through 2024.
In Tax Year 2022, these revenue losses totaled between $140 million and $206 million, while the estimated loss for Tax Year 2024 would be between $160 million and $235 million, based on available data.
For context, the New Hampshire Department of Safety’s entire adjusted authorized budget for State Fiscal Year 2025, including federal funds, is $265 million, while the University System of New Hampshire’s State Budget appropriation is $95 million. New Hampshire Hospital’s entire budget for the year is $111 million, and the Statewide Education Property Tax will raise about $363 million this year.[24]
Not Costless, Unclear Benefits
Business tax rate reductions enacted in New Hampshire since 2015 have resulted in significant losses of State revenue available for public services.
The available evidence, including both sophisticated multi-state modeling and simple quantitative relationships based on New Hampshire data, cannot conclusively quantify the effects of tax rate reductions on the economy. However, recent changes in the rate of the Business Profits Tax, the State government’s largest tax revenue source, do not appear to have an impact on the economy that is definitively distinguishable from underlying economic activity or national trends. Both NHFPI’s August 2023 analysis and this update show that New Hampshire’s business tax rate reductions do not appear to have resulted in more revenue.
While recent adjustments to their rates are not deterministic for the direction of New Hampshire’s economy, the Business Profits Tax and the Business Enterprise Tax are key revenue sources for funding public services. As policymakers are considering the next State Budget, balanced budget requirements result in policy outcome tradeoffs for each dollar of revenue raised, as well as for the deployment of dollars spent on services.
Policymakers aiming to use State fiscal policy for the benefit of Granite Staters and the local economy may seek to consider reductions in taxes that directly affect New Hampshire residents with low and moderate incomes, or to preserve and bolster services that support Granite State individuals, families, and the workforce.
Endnotes
[1] For more detail on these conclusions and other reviews of existing literature identified in this report, see NHFPI’s August 2023 Issue Brief State Business Tax Rate Reductions Led to Between $496 Million and $729 Million Less for Public Services.
[2] For the full August 2023 analysis and explanation of the methodology, see NHFPI’s August 2023 Issue Brief State Business Tax Rate Reductions Led to Between $496 Million and $729 Million Less for Public Services. For the February revenue projections from the Governor and the House of Representatives, see the Office of Legislative Budget Assistant’s February 14, 2025 document House Ways and Means 2-12-25 Estimates and Governor 2-13-25 General Fund and Education Trust Fund Estimates.
[3] See the Joint Legislative Fiscal Committee’s March 21, 2025 agenda and the State of New Hampshire Annual Comprehensive Financial Report for the Fiscal Year Ending June 30, 2024.
[4] See NHFPI’s August 2023 Issue Brief State Business Tax Rate Reductions Led to Between $496 Million and $729 Million Less for Public Services.
[5] See New Hampshire’s Annual Comprehensive Financial Reports for State Fiscal Years 2015, page 10, and 2023, page 6.
[6] See RSA 77-E, particularly RSA 77-E:1, IX.
[7] To access these data, see the U.S. Bureau of Labor Statistics Quarterly Census of Employment and Wages Employment and Wages Data Viewer and New Hampshire Employment Security’s Covered Employment and Wages data.
[8] The relationship between wages paid, which is a key part, but not all, of the tax base, in a Calendar Year and the Tax Year BET revenues is quite strong between 2008 and 2015; variation in total wages paid predicts approximately 95.0 percent of the variation in BET revenues in this two-variable model. For more analysis of the relationship between private sector wages and BET revenues, see NHFPI’s August 2023 Issue Brief State Business Tax Rate Reductions Led to Between $496 Million and $729 Million Less for Public Services.
[9] Tax Year data for the BET and the BPT is published in the New Hampshire Department of Revenue Administration’s annual reports; see the 2018 and 2024 reports for the data used in this paragraph. See also NHFPI’s January 27, 2025 Data Byte Business Enterprise Tax Rate Decreases Have Reduced State Revenue Over Time.
[10] For more detailed analyses of these findings, see NHFPI’s August 2023 Issue Brief State Business Tax Rate Reductions Led to Between $496 Million and $729 Million Less for Public Services.
[11] Inflation-adjusted personal income per capita data accessed from the U.S. Bureau of Economic Analysis, and this analysis employed the table Real Personal Income and Real Personal Consumption Expenditures by State (SARPI).
[12] For data from other states, see the U.S. Census Bureau’s Annual Survey of State Government Tax Collections. New Hampshire data from the State’s Annual Comprehensive Financial Reports. According to the Tax Foundation, between 2015 and 2025, neither Vermont nor Maine changed the top corporate tax rates in those states.
[13] Corporate profits are measured using the measure “Corporate Profits with Inventory Valuation Adjustment (IVA) and Capital Consumption Adjustment (CCAdj)” published by the U.S. Bureau of Economic Analysis and aggregated by the U.S. Federal Reserve Bank of Saint Louis.
[14] See the New Hampshire Department of Revenue Administration’s 2024 Annual Report, pages 47 and 48.
[15] For more information on Water’s Edge and combined reporting, see the Institute on Taxation and Economic Policy’s February 2025 report A Revenue Analysis of Worldwide Combined Reporting in the States.
[16] See the New Hampshire Department of Revenue Administration’s Annual Reports from 2018 and 2024. For the inflation adjustment, this analysis used the Consumer Price Index-Urban for the Northeastern United States from the U.S. Bureau of Labor Statistics.
[17] See The Relationship Between Taxes and Growth at the State Level: New Evidence as published in December 2015 in the National Tax Journal.
[18] See the archived version of Moody’s Analytics January 2021 analysis The Biden Fiscal Rescue Package: Light on the Horizon, page 4.
[19] For a more detailed summary of existing research, see NHFPI’s August 2023 Issue Brief State Business Tax Rate Reductions Led to Between $496 Million and $729 Million Less for Public Services.
[20] See the New Hampshire Department of Revenue Administration’s Annual Reports for these data.
[21] For total private sector wages paid, see the U.S. Bureau of Labor Statistics Quarterly Census of Employment and Wages Employment and Wages Data Viewer and New Hampshire Employment Security’s Covered Employment and Wages data.
[22] This analysis used an average of three published sets of splits between State fiscal years and Tax Years published in fiscal notes from the Department of Revenue Administration: Senate Bill 135 of the 2019 Session, House Bill 10 of the 2021 Session, and House Bill 1422 of the 2024 Session. For these two sets of revenue projections, which were averages for this analysis, see the Office of Legislative Budget Assistant’s February 14, 2025 document House Ways and Means 2-12-25 Estimates and Governor 2-13-25 General Fund and Education Trust Fund Estimates.
[23] For a more detailed summary of modeling from other states, see NHFPI’s August 2023 Issue Brief State Business Tax Rate Reductions Led to Between $496 Million and $729 Million Less for Public Services.
[24] For more information and comparisons, see the Governor’s Executive Budget Summary for State Fiscal Years 2026-2027.