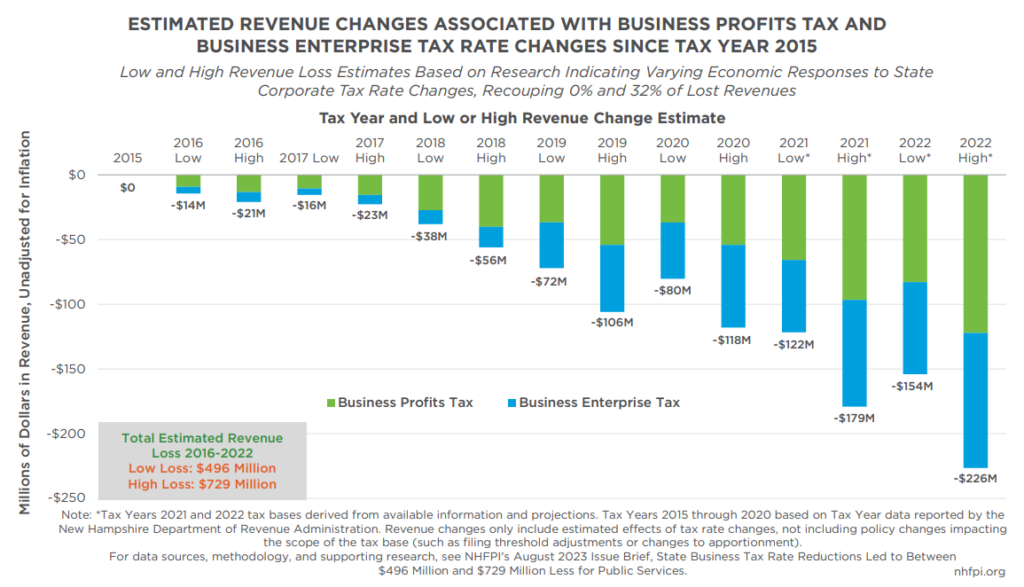
NHFPI’s August 2023 analysis of rate reductions for the State’s Business Profits Tax (BPT) and Business Enterprise Tax (BET) implemented between 2015 and 2022 estimated the State lost between $496 million and $729 million in revenue due to these reductions.
Between State Fiscal Years 2015 and 2022, combined BPT and BET revenues increased 118 percent, more than doubling the revenue collected by these two taxes. This analysis found no evidence that concurrent business tax rate reductions led to increased revenue by spurring more economic activity in the state. Research from other states and nationally show mixed impacts from tax rate changes on the economy. While some studies showed changes in behavior of multi-state businesses or economic effects in specific time periods, such as recessions, in response to state-level corporate tax changes, other research found no discernable impacts on the overall economy from corporate tax rate changes.
Parsing between revenues collected by the BPT and the BET in New Hampshire requires analysis of data that is delayed substantially by tax return filing timelines, and Tax Years used by businesses usually align with the Calendar Year, rather than the State Fiscal Year. Using draft data published by the State from Tax Years 2015 to 2020, this analysis shows that BET rate reductions have decreased revenue. While BET revenues previously tracked salary and wage growth in New Hampshire, revenues dropped relative to that trend with each tax rate reduction. BET revenues in Tax Year 2019 and 2020 were lower, based on publicly available data, than they were in Tax Year 2015, before the rate reductions began and despite growing salary and wage payments by businesses in the state.
Both available data and economic modeling, based on known changes in business compensation, suggest the vast majority of combined business tax revenue growth in New Hampshire between 2015 and 2022 was generated by the BPT, rather than the BET. NHFPI’s statistical analysis of New Hampshire data found no clear relationship between BPT rates and key economic indicators, indicating these rate reductions likely did not spur sufficient growth to generate BPT revenue increases. Specifically, this analysis found no statistically significant relationship between BPT rates and state-level employment growth between 1970 and 2022; private sector Gross State Product growth in New Hampshire relative to New England, or relative to national Gross Domestic Product, between 1970 and 2022; or inflation- adjusted private sector Gross State Product growth between 2001 and 2021. Single-year analyses of job growth and overall economic growth, relative to New England overall, following the tax rate reductions in 2016, 2018, 2019, and 2022 did not suggest the tax rate reductions spurred one-time bursts of business hiring or other economic activity in New Hampshire. While the number of BPT filers has generally increased in New Hampshire, BPT revenue growth has far outpaced that increase.
These analyses do not disprove any type of relationship between economic growth in New Hampshire and the BPT and BET rates, but they do show any economic effects are too limited to explain business tax revenue growth. The lack of clear economic response to tax rate reductions, particularly for BPT rates, reflects the limited magnitude of the reductions for most businesses and the types of businesses that pay BPT. Based on Tax Year 2020 data, businesses that owed between $1,000 and $10,000 in taxes, the largest group of businesses paying BPT, would have received an average tax reduction of about $50 with a 0.1 percent lower rate, the percentage point change from the 2022 and 2023 BPT rate reductions. About 58 percent of 2020 BPT revenue came from multi-component filers, including those with significant international components. Key research indicates that a significant portion of a corporate tax reduction’s benefits accrues to firm owners and shareholders, suggesting BPT reductions may result in corporate profits flowing out of state.
The causes of the recent BPT revenue increases appear to be linked to 1) federal corporate tax changes that incentivized the repatriation of corporate profits held internationally and made expansions to the base of taxable activities, and 2) to a sharp rise in corporate profits during the pandemic. Between fiscal years 2015 and 2021, New Hampshire’s BPT and BET revenue growth lagged behind combined state corporate tax revenue growth in the other New England states and nationally.
Key research also suggests dollars retained in the New Hampshire economy, particularly those targeted at services for individuals and families with low and moderate incomes, provide more effective economic stimulus than corporate tax reductions. State balanced budget requirements mean reduced revenues could limit economic growth enabled by these public services.
Using a wide range of possible outcomes based on prior state-level corporate tax modeling and known revenues and projections, NHFPI estimated revenue losses for each year from Tax Years 2016 to 2022. For more analysis, citations, and methodological discussions, see NHFPI’s August 2023 Issue Brief State Business Tax Rate Reductions Led to Between $496 Million and $729 Million Less for Public Services.