This second edition of New Hampshire Policy Points provides an overview of the Granite State and the people who call New Hampshire home. It focuses in on some of the issues that are most important to supporting thriving lives and livelihoods for New Hampshire’s residents. Moreover, the book addresses areas of key policy investments that will help ensure greater well-being for all Granite Staters and a more equitable, inclusive, and prosperous New Hampshire.
New Hampshire Policy Points is intended to provide an informative and accessible resource to policymakers and the general public alike, highlighting areas of key concerns. Touching on some important points but by no means comprehensive, each section within New Hampshire Policy Points includes the most up-to-date information available on each topic area. The facts and figures included within this book provide useful information and references for anyone interested in learning about New Hampshire and contributing to making the Granite State a better place for everyone to call home.
To purchase a print copy or download a free digital PDF of New Hampshire Policy Points, visit nhfpi.org/nhpp

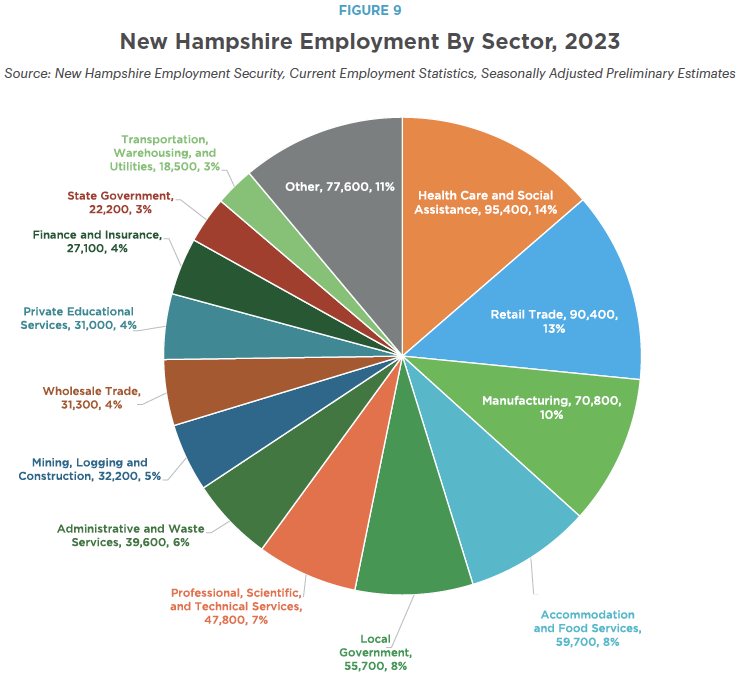
A thriving economy with well-paying jobs creates prosperity for residents, communities, and the state as a whole. Economies can be more resilient to economic downturns and the consequences of failure in a single industry if substantial employment thrives in a variety of employment sectors. New Hampshire’s state economy is diverse, relying on an array of distinct industries. In 2023, the Granite State’s largest employment sectors were Health Care and Social Assistance (14 percent of employees), followed by Retail Trade (13 percent), Manufacturing (10 percent), Accommodation and Food Services (8 percent), Local Government (8 percent), Professional, Scientific and Technical Services (7 percent), and Administrative and Waste Services (6 percent).[1]
These figures do not include New Hampshire residents who commute to jobs out of state, such as to metropolitan Boston, for higher-paying or otherwise desirable job opportunities. In 2023, approximately 13.2 percent of employed Granite Staters age 16 and older commuted out of state for work compared to 3.3 percent of employed individuals nationally.[2]
Access to job opportunities and economic activity in neighboring states, particularly in Massachusetts, has had a significant impact on New Hampshire’s economy. The relative proximity of communities in southeastern New Hampshire to metropolitan Boston contributes to higher incomes and more urbanization in those areas, spurring increased economic and employment growth. While rural areas further north and west in New Hampshire have not benefited as directly from proximity to Boston, relative ease of access to these areas for tourism and recreation for out-of-state travelers has impacted these local economies.
Wages and Pandemic Impacts
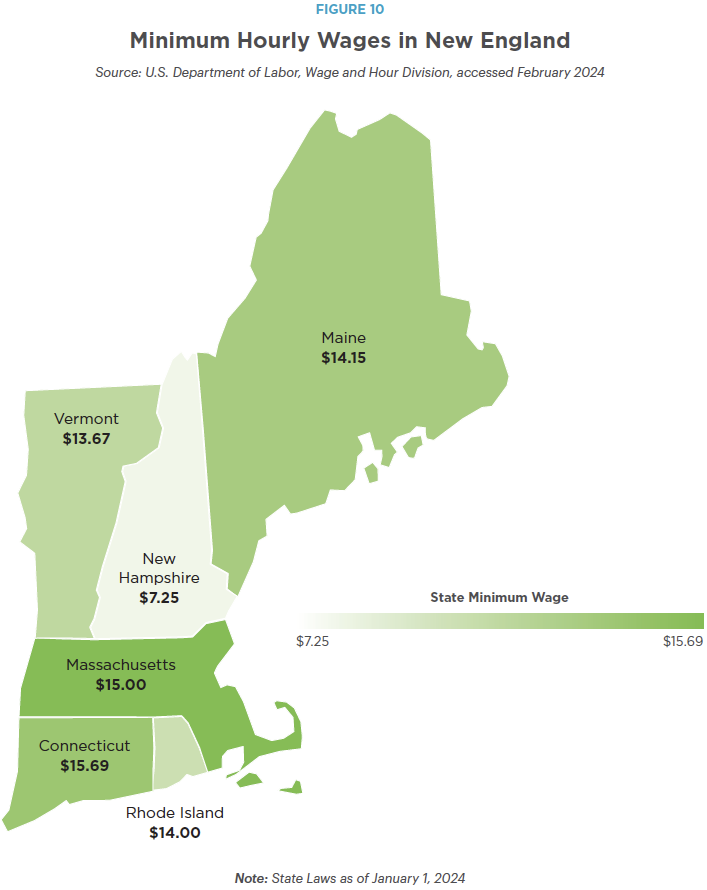
New Hampshire adheres to the federal minimum wage, which was last raised in 2009 and is currently $7.25 per hour. By comparison, every other New England state had a minimum wage of at least $13.67 per hour as of January 1, 2024.[3] The minimum wage is not adjusted for inflation in New Hampshire or federally. In July 2009, a full-time worker earning the federal minimum wage earned $15,080 annually. When adjusted for inflation to prices in the United States during the first half of 2024, the equivalent purchasing power of the annual July 2009 minimum wage salary would have been $10,364, as goods and services have become more expensive while the wage has remained the same dollar value.[4] For context, the Federal Poverty Guideline for a family of four in 2009 was $22,050 and $31,200 in 2024.[5]
Of New Hampshire’s five industries that employed the most residents in 2023, three paid average wages lower than the statewide average weekly wage for private sector industries ($1,463).[6] While the average reported weekly wage for Professional, Scientific and Technical Services was $2,493, and Manufacturing employers reported an average weekly wage of $1,681, average weekly wages reported by Health Care and Social Assistance, Retail Trade, and Accommodation and Food Services employers was $1,364, $836, and $571, respectively. These figures are calculated by dividing total wages by total employment, which includes both full- and part-time employment, as well as other categories such as students and voluntary employment. Additionally, average wages reported in New Hampshire do not include tips.[7]
During 2020, employment declined significantly in key industries, including Health Care and Social Assistance, Retail Trade, Education Services, and Accommodation and Food Services. These employment declines resulted in lower incomes for many people, including younger workers, workers from diverse racial and ethnic backgrounds, and workers with lower levels of education, all of whom were disproportionately impacted by the COVID-19 pandemic. Granite Staters with lower wages were also more significantly affected by the employment and income losses caused by the pandemic. During the long, slow recovery from the Great Recession of 2007-2009, wages for those earning lower and median incomes in New Hampshire took longer to recover than for those earning higher incomes, suggesting that these workers were not benefiting equitably from the economy even before the pandemic.[8]
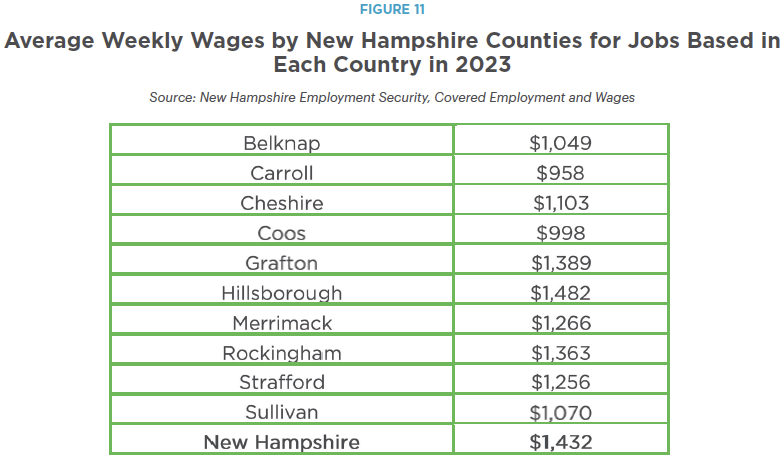
During 2023, the average public and private sector weekly wage in the state was $1,432.[9] The average wage of workers differs by county, with Hillsborough reporting the highest at $1,482, and Carroll the lowest at $958. Some of these differences in county-level average wages are due to higher concentrations of industries that pay workers more, and are more likely to employ workers fulltime, in some regions than in others.[10]
Unemployment and Workforce Challenges
The COVID-19 pandemic resulted in large overall employment declines in 2020. The number of Granite Staters employed in 2019 averaged over 758,400. In 2020, an average of just over 710,500 residents were employed.[11] By May 2024, the State’s estimated number of employed residents had nearly returned to 2019 levels, with 750,720 Granite State workers employed. However, the employment recovery to pre-pandemic levels was incomplete and employment remained lower than it might have been if the economy had continued growing, rather than being impacted by the pandemic.[12] Workforce participation and the size of the labor force also declined during the pandemic. The size of the labor force, which includes the number of people employed and looking for work, averaged about 778,500 for New Hampshire in 2019. In 2020, it averaged just over 761,400. Labor force estimates showed signs of post-pandemic recovery as of August 2024, with an estimated 770,748 workers.[13]
Prior to the COVID-19 pandemic reaching New Hampshire, the statewide unemployment rate had averaged below 3.0 percent since 2016. In April 2020, unemployment peaked at 15.8 percent statewide, and declined throughout the remainder of 2020 and into 2021.[14] In August 2024, the estimated seasonally adjusted unemployment rate was at 2.6 percent statewide, lower than the national unemployment rate of 4.2 percent.[15] A different measure of unemployment that includes discouraged (e.g., not in the labor force but looked for a job in the past year and want and are available for employment), underemployed, and unemployed workers showed higher levels of unemployment and higher labor underutilization compared to the standard measure, with average rates of 5.2 percent in 2019 and 4.5 percent for 2023 in New Hampshire.[16]
A combination of factors, including New Hampshire’s aging population, the health risks exacerbated by the pandemic, temporary changes to household finances associated with the pandemic, and challenges to accessing affordable housing and child care, have resulted in significant declines in labor force participation.[17] The largest persistent declines in participation rates have been among younger adult workers, including those who are of ages that are more likely to have young children. The initial employment losses of the pandemic impacted women more dramatically than men, as women were more likely to work in key industries directly disrupted by the pandemic; women were also more likely to step back from the labor force to fill gaps in child care and family caregiving needs.[18]
The economic health of households is critical to the economy. In 2022, New Hampshire household financial security eroded and poverty rebounded after being reduced by federal policies to combat the impacts of the pandemic.[19] Key national metrics suggest savings accumulated during the pandemic are being, or have been, depleted.[20] The average wage in the state appears to have fallen behind inflation relative to 2021 in annualized data reported in 2023. With nearly a third of Granite State adults surveyed reporting that paying for usual household expenses is somewhat or very difficult, economic growth may be more likely to remain slow despite relatively favorable economic conditions.[21] Providing targeted supports and making investments to expand opportunities for households to access key needs, including child care and housing, has the potential to substantially help New Hampshire’s residents and economy thrive.[22]
• • •
This publication and its conclusions are based on independent research and analysis conducted by NHFPI. Please email us at info@nhfpi.org with any inquiries or when using or citing New Hampshire Policy Points in any forthcoming publications.
© New Hampshire Fiscal Policy Institute, 2024.
Endnotes
[1] See New Hampshire Employment Security’s Nonfarm Employment, Seasonally Adjusted, All Employees 2023 preliminary estimates.
[2] See U.S. Census Bureau’s American Community Survey, Commuting Characteristics by Sex, S0801.
[3] See U.S. Department of Labor Wage and Hour Division’s State Minimum Wage Laws.
[4] Annual minimum wage calculation derived assuming 40 hours of work per week for 52 weeks at $7.25 an hour. CPI for All Urban Consumers 1982-84=100 (Unadjusted) for the first half of 2024 used for inflation calculations.
[5] See U.S. Department of Health and Human Services 2009 and 2024 Federal Poverty Guidelines.
[6] Annual 2023 figures in this paragraph are an average of the four individual quarters from 2023.
[7] Average weekly wages by private sector industries calculated using four individual quarters from 2023.
[8] See NHFPI’s August 2022 issue brief, Key Challenges Facing Granite State Workers Amid the COVID-19 Economic Recovery and NHFPI’s March 4, 2022 presentation The New Hampshire Economy in 2021 and 2022.
[9] Annual 2023 figures in this paragraph are an average of the four individual quarters from 2023.
[10] See New Hampshire Employment Security’s 2023 Quarterly Census of Employment Wages for Counties. Annual 2023 figures in this paragraph are an average of the four quarters from 2023.
[11] See New Hampshire Employment Security’s Granite Stats – Unemployment Rate and Labor Force annual time period.
[12] See New Hampshire Employment Security’s New Hampshire Economic Conditions – July 2024.
[13] See Granite Stats – Unemployment Rate and Labor Force annual and monthly, seasonally adjusted time periods.
[14] See New Hampshire Employment Security’s Granite Stats – Unemployment Rate and Labor Forcemonthly, seasonally adjusted time period.
[15] See New Hampshire Employment Security’s New Hampshire Economic Conditions – October 2024.
[16] See New Hampshire Employment Security’s Alternative Measures of Labor Underutilization Annual Averages 2023, U-6 metric, and U.S. Bureau of Labor Statistics “Local Area Unemployment Statistics” for more information on the U-L measure.
[17] See NHFPI’s August 2022 issue brief, Key Challenges Facing Granite State Workers Amid the COVID-19 Economic Recovery and NHFPI’s August 2023 issue brief, Granite State Workers and Employers Face Rising Costs and Significant Economic Constraints. Inflation adjustment calculated using Consumer Price Index for All Urban Consumers-New England.
[18] See NHFPI’s September 2021 issue brief, Uneven Employment Impacts and Recovery from the COVID-19 Crisis.
[19] See NHFPI’s June 10, 2024 blog, Poverty Among Older Adults Rose Significantly, and Rebounded for Children, in 2022.
[20] See the Federal Reserve Bank of San Francisco, Pandemic Savings Are Gone: What’s Next for U.S. Consumers?, May 3, 2024, and the Federal Reserve Bank of Boston, Have U.S. Households Depleted All the Excess Savings They Accumulated during the Pandemic?, November 7, 2023.
[21] See NHFPI’s May 22, 2024 presentation New Hampshire’s Labor Force and Policies to Support Granite State Workers and the U.S. Census Bureau’s Household Pulse Survey, accessed July 2024.
[22] See NHFPI’s August 2023 issue brief, Granite State Workers and Employers Face Rising Costs and Significant Economic Constraints.