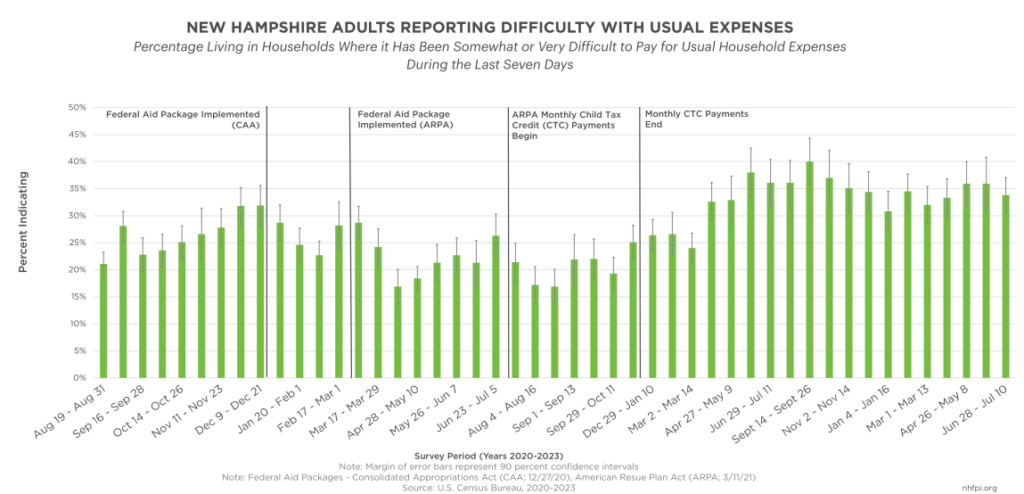
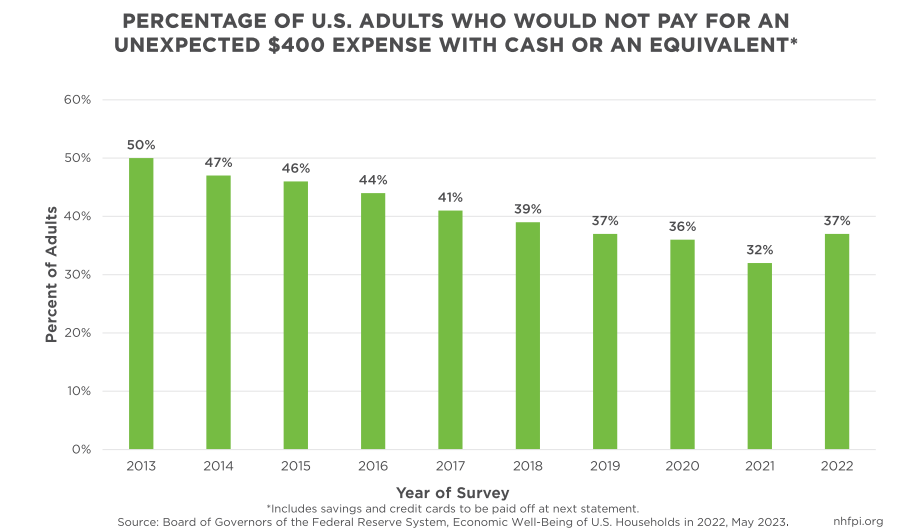
According to data from the U.S. Census Bureau, about one in three Granite State adults reported that paying for usual household expenses was somewhat or very difficult between June 28 and July 10, 2023. New Hampshire households have been reporting financial struggles since before the pandemic. Recent estimates suggest about a quarter of Granite State households did not have at least $2,000 in savings in 2019. These findings continue to be relevant as national-level data suggest many households have returned to pre-pandemic levels of savings; about 37 percent of U.S. adults reported they would not pay for an unexpected $400 expense using cash or equivalent means in both 2019 and 2022, following a pandemic-era decline to 32 percent in 2021. These data suggest a significant portion of Granite State residents may not have robust emergency savings, leaving them more financially vulnerable to rising costs, unexpected expenses, or income losses.
Difficulty Paying for Household Expenses
Beginning in April 2020, the U.S. Census Bureau began collecting data through the Household Pulse Survey to measure the impacts of the COVID-19 pandemic, including on household spending. During the most recent survey period, which was from June 28 to July 10 of 2023, about 34 percent of Granite State adults reported that paying for usual household expenses was somewhat or very difficult in the previous seven days. The percentage of New Hampshire residents reporting difficulty paying household expenses has been relatively stable for the last two years, but is significantly higher than the approximately one in five adults who reported difficulty affording expenses during the Summers of 2020 and 2021.
Fewer New Hampshire adults facing difficulty paying household expenses in 2020 and 2021 may be explained in part by the implementation of federal aid packages during those years, including the one-time Economic Impact Payments and the monthly Advance Child Tax Credit (CTC) payments. The National Bureau of Economic Research recently released findings that indicated the majority of CTC payments were used for key household expenses. For every $100 of Advance CTC payments families received, an estimated $28 was spent on food, $31 was spent on housing, and $15 was spent on goods and services for children. Additionally, the report noted the payments were especially helpful to households with Black and Hispanic members. This research mirrors earlier analyses of U.S. Census Bureau data that found about nine in ten families with low incomes were using the Advance CTC payments for basic needs, including food, clothing, shelter, and utilities.
The more recent Household Pulse Survey reports from 2022 and 2023, which show greater difficulty affording usual household expenses than the 2020 and 2021 data, may reflect impacts related to the end of key federal pandemic assistance as well as inflation in New Hampshire‘s cost of living expenses.
Savings for Unexpected Expenses
Another, separately calculated barometer of financial well-being is the percentage of adults who can pay an unexpected $400 expense using cash or equivalent means, such as savings or a credit card to be paid in full at the end of the month. This measure is not necessarily identifying the available savings an individual or household has, but rather how someone would decide to pay for an unexpected $400 expense, if they were able to do so at all, given their financial situation.
The U.S. Federal Reserve’s Survey of Household Economics and Decision-making (SHED) asks adults nationwide questions about their personal and family finances to gather insight into the economic well-being of individuals and their families. Among the 11,667 U.S. adults surveyed in October 2022, slightly more than one in three (37 percent) reported they would not pay for an unexpected $400 expense using cash or equivalent means. This figure is an increase from last year and a return to pre-pandemic levels after a decline in 2020 and 2021, suggesting that the effects of pandemic-related aid may have worn off, and inflation-related cost increases are impacting individual and family budgets throughout the country.
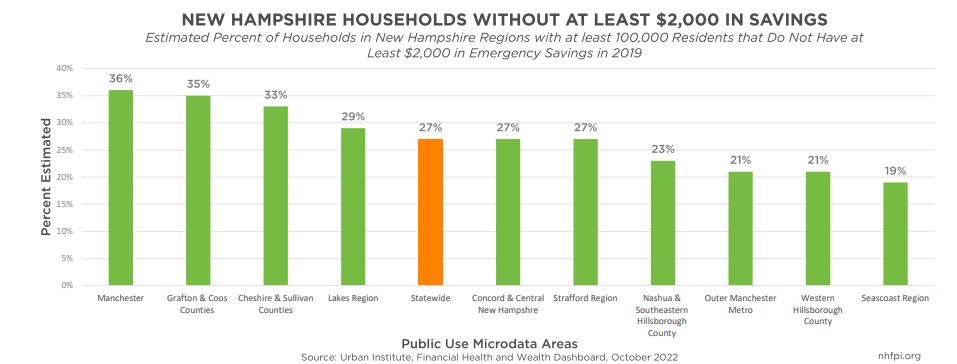
Although the SHED survey does not provide comparable data at the state level, the Urban Institute has separately examined financial well-being by state and within substate regions across the country. Using a mix of surveys and census data from 2018 and 2019, researchers at the institute produced modeled estimates of the percent of households with savings of $2,000 or more, an amount considered adequate to pay for an emergency expense by the researchers. While the $400 measurement was focused on paying for an unexpected expense, the Urban Institute’s calculations are designed to identify the actual amount of savings available to households. In the substate geographic analysis, most communities in New Hampshire were combined with other surrounding areas to reach the 100,000 person threshold used in the Urban Institute’s statistical estimates for substate areas. Manchester is the only municipality with a population large enough to be mapped independently and have a separately-calculated estimate.
The Urban Institute’s estimates suggest that 27 percent of New Hampshire households do not have at least $2,000 in emergency savings. However, that figure ranges between 19 percent in the Seacoast region to as high as 35 percent in Grafton and Coos counties and 36 percent in Manchester. Given some of the data used for the models was collected in 2018 and 2019, these figures may underestimate the actual percentage of families without at least $2,000 in savings, as direct pandemic aid to individuals and families has ended and relatively rapid inflation has increased household expenses.
Financial Climate for Granite State Households
Both the end to assistance associated with the COVID-19 pandemic and the high inflation rate are key factors affecting the financial well-being of Granite Staters. Inflation is the increase in the prices of goods and services over time, measured by overall price levels in the economy. In New England, the U.S. Bureau of Labor Statistics reported that consumer prices increased by 6.1 percent between January 2022 and June 2023, but wage and salary growth only increased by 2.6 percent. When price increases outpace wage growth, the purchasing power of consumers decreases and pressure on household finances rises.
According to the Massachusetts Institute of Technology’s Living Wage Calculator, a New Hampshire household with two working adults and one child requires an annual 2023 pre-tax income of $82,937 ($6,911/monthly) to afford typical expenses. Based on the most recent estimates, the 2021 median household income of New Hampshire family households is $108,208, and the average family size is 2.96 members. While the median household is above the estimated cost for a three-person household, nearly one in three families had incomes below $75,000 in 2021, and approximately one in six had incomes below $50,000 that year. These figures suggest a substantial portion of New Hampshire families cannot afford typical household living expenses.
The two largest expenses for New Hampshire families with children, as estimated in the Living Wage Calculator, are child care and housing costs. When costs of necessities rise, families with low incomes likely pay a higher proportion of their incomes on living expenses than households that earn more. For example, a median income married couple family with an infant in center-based child care would have paid about 13 percent of their household income toward care, based on 2022 child care price estimates, while a median income household headed by a single woman with at least one child present would have paid about 41 percent. Additionally, the U.S. Census Bureau’s American Community Survey suggests nearly 45 percent of renters, 26 percent of homeowners with mortgages, and 18 percent of households that own their homes outright in New Hampshire paid 30 percent or more of their household income toward housing costs in 2021, a proportional cutoff above what is considered affordable housing by the U.S. Department of Housing and Urban Development. The disparity between living expenses and household income for a large proportion of New Hampshire families likely explains why many Granite Staters lack emergency savings and report financial vulnerability.
Long-Term Policy Considerations
Overall, recent data show a considerable percentage of Granite Staters report having difficulty affording their usual household expenses. Additionally, about a quarter of New Hampshire households did not have at least $2,000 in savings for emergencies going into the COVID-19 pandemic, and national data suggests savings for households with limited resources may have returned to pre-pandemic levels after rising during the crisis. Families are likely struggling more due to increasing costs for consumer goods, severe childcare and housing constraints, and the end of key pandemic-era public supports. The new biennial State Budget addresses some of these challenges, as do several implemented and forthcoming policy initiatives funded by flexible federal American Rescue Plan Act aid. However, as costs continue to rise, additional policy initiatives may be key to helping bolster the long-term financial well-being of Granite State residents.
– Nicole Heller, Senior Policy Analyst
Note: The graph showing the percentage of adults reporting difficulty with usual household expenses was updated on July 25, 2023 to better align the federal legislation markers with the survey dates represented by the bars on the graph.


