The New Hampshire Food Stamp Program, often identified by the underlying federal program called the Supplemental Nutrition Assistance Program (SNAP), provides low-income individuals and families with resources to purchase certain food items at grocery stores and other food retailers. Recipients can qualify for SNAP in New Hampshire in several different ways, including through enrollment in certain other assistance programs; generally, SNAP recipients in New Hampshire qualify because they have incomes below 185 percent of the federal poverty guidelines. In 2017, qualifying incomes levels were annual household incomes of about $22,000 for an individual, or about $37,000 for a family of three, annually. Similar to counts of Medicaid or Free and Reduced-Price School Lunch program enrollees, counts of SNAP participants provides an indicator of the number of people in or near poverty in a community; while based on counts and not survey data, these programs do not provide perfect measures of income or relative poverty rates due to variability in enrollment eligibility, specific populations targeted for service, and varying enrollment rates among eligible populations.
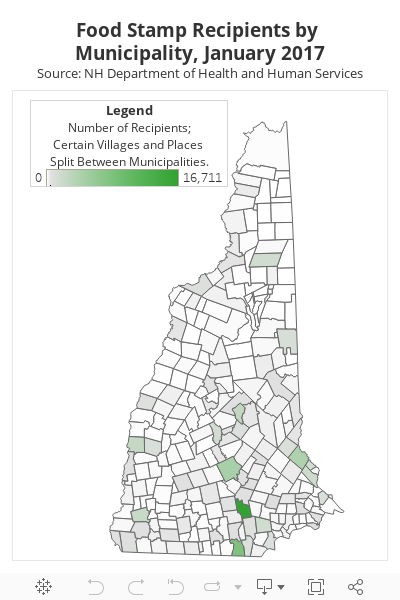
The two maps below show the number of SNAP recipients in each municipality in January 2017 and the percentage of each municipality’s 2010 Census population that was enrolled in SNAP. Darker shading indicates a larger number of SNAP participants or a higher percentage of SNAP participants as a percentage of the population, respectively. High concentrations of SNAP enrollees exist in larger urban centers in the state, such as Manchester, Nashua, and Concord. However, differences in SNAP counts relative to populations suggest different economic conditions in many of these communities. Rochester and Dover, neighboring cities in Strafford County, have similar populations, but Rochester had more than twice the number of SNAP participants as Dover. Hooksett had approximately 5,000 more residents than fellow Merrimack County municipality Franklin in 2010, but Franklin had 900 more SNAP recipients than Hooksett in January 2017. Generally, while the number of SNAP participants is higher in larger population municipalities, the enrollment is not as concentrated in larger towns in the southeastern part of the state as the distribution of the overall population was in 2010. This indicates a greater percentage of the population in rural areas is enrolled in SNAP than in suburban areas in southeastern New Hampshire.
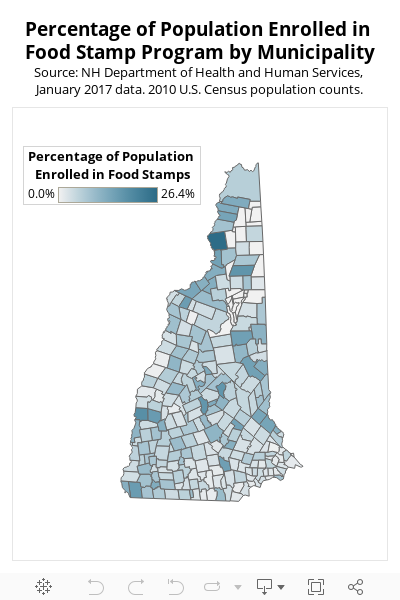
The percentage of the population enrolled in SNAP shown by the second map provides greater insight into the disparities in enrollment between municipalities, potentially indicating the relative concentrations of individuals in or near poverty in these communities. Although municipalities without residents or with very low populations did not include any enrollees in the dataset, the percentage of the local populations enrolled in SNAP was generally highest in the northernmost parts of New Hampshire, particularly in Berlin and along the Connecticut River in Coos and northern Grafton counties. The percentage of the population enrolled in SNAP was in the low single-digits in most communities near to metropolitan Boston, with the larger municipalities of Manchester, Nashua, and Derry being exceptions in the far south-central part of the state. Again, rates were generally higher in rural western and northern parts of the state, with small and mid-sized cities and larger towns, including Berlin, Claremont, Franklin, Laconia, Newport, Ossipee, and Pittsfield, showing notably high rates of SNAP participation.
For more on other metrics of economic activity and fiscal capacity in New Hampshire communities, see NHFPI’s Issue Brief Measuring New Hampshire’s Municipalities: Economic Disparities and Fiscal Capacities.