A report released earlier this month by the U.S. Department of Agriculture’s Economic Research Service shows food insecurity nationally remained at roughly the same level in 2016, 12.3 percent of all households, as in 2015. Food insecurity is higher both nationally and in New Hampshire in the last three years than ten years ago, before the Great Recession. Although progress has been made nationally relative to the next most recent three-year period, New Hampshire has seen no statistically significant change in food insecurity between the last two three-year periods measured, and food insecurity remains higher above pre-Recession levels than the nation as a whole.
The term “food secure” means having access to enough food for an active, healthy life, and food security is necessary for a healthy and well-nourished population, according to the U.S. Department of Agriculture. Food security is evaluated based on responses to 18 questions distributed through the Current Population Survey in a Food Security Supplement, which was completed by 41,186 households nationwide in December 2016. The responses, tabulated and weighted for the population as a whole, are used to determine the approximate percentages of U.S. households that are food secure or food insecure. Among those that are food insecure, responses to the questions allow researchers to identify those households that have either low or very low food security, which present a greater likelihood of household members going hungry. Questions in the survey focus on the availability of food, or lack thereof, due to financial constraints, including a lack of balanced meals, weight loss due to lack of food, meals skipped or days of not eating, and lack of access to food for children in the household. Those who are homeless are not included in the survey, which likely biases the statistics downward.
About 15.6 million U.S. households (12.3 percent) were food insecure at some time during 2016, and 6.1 million (4.9 percent) had very low food security. About 41.2 million people lived in these food insecure households, and 14.6 million lived in households with very low food security. Data suggest children tend to be less likely to be food insecure than other members of households, as children, especially young children, may be protected from its affects while adults may be more severely affected. Both children and adults were food insecure in 3.1 million households, or 8.0 percent of households with children, and 6.5 million children lived in households in which at least one child was food insecure. About 87.7 percent of U.S. households were food secure, compared to 89.9 percent in 1999.
Households with incomes below 185 percent of the federal poverty threshold, or with less than $45,027 for a family of two adults and two children in 2016, were more likely than households overall to be food insecure; 31.6 percent nationally reported food insecurity in 2016. Households with children headed by single women were more likely to be food insecure, at 31.6 percent, as were households headed by black or African-American, non-Hispanic individuals, at 22.5 percent. Food insecurity is higher in households in rural areas (15.0 percent) than in metropolitan areas, and lower in the Northeast (10.8 percent) than in other regions.
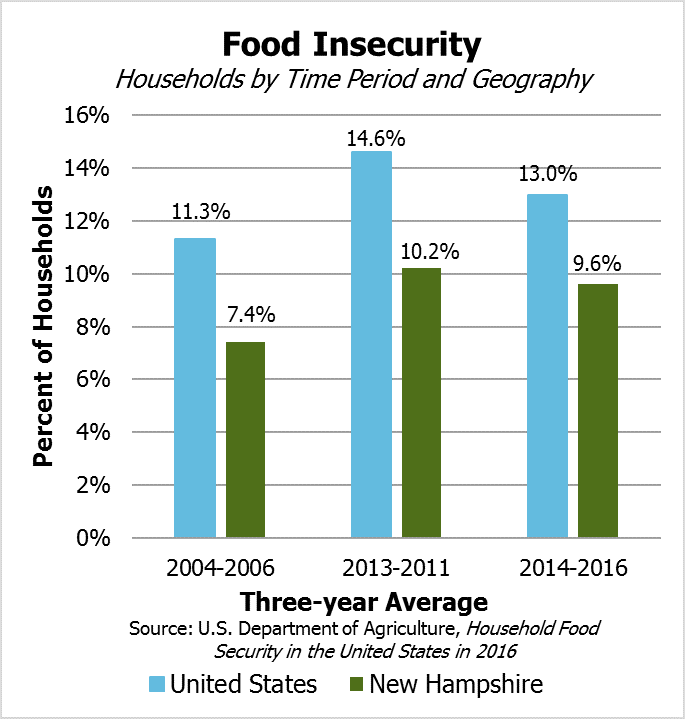
The small sample size of the survey necessitates taking three-year averages to evaluate changes at the state level. In New Hampshire, the rate of overall food insecurity was 9.6 percent and very low food security was 3.8 percent for 2014-2016; both rates were lower than the national averages of 13.0 percent and 5.2 percent, respectively, for the same time period. However, comparing across time periods, New Hampshire’s overall food insecurity and very low food security rates remain higher than the 2004-2006 averages, and the national figures are closer to their pre-Recession levels than New Hampshire’s levels. New Hampshire’s 2014-2016 rates remain 2.2 percentage points higher for food insecurity overall and 1.6 percentage points higher for very low food security relative to 2004-2006, while the national figures show rates 1.7 percentage points and 1.3 percentage points higher, respectively.
While New Hampshire continues to perform better than the nation overall, these point estimates suggest the state has not reduced hunger following the recession as quickly as others. New Hampshire and the federal government have several programs focused on reducing food insecurity, including the food stamp program, also known as the Supplemental Nutrition Assistance Program or “SNAP.” To learn about New Hampshire’s food stamp program, see NHFPI’s Fact Sheet and Common Cents blog post regarding SNAP’s assistance to people with disabilities.
Food insecurity’s relationship to income constraints suggests that the recent decline in New Hampshire’s poverty rate is a positive development for enhanced food security in the state. However, certain groups continue to struggle with higher rates of poverty than the state as a whole, and other rising costs, such as housing, may make devoting additional resources to food more difficult. NHFPI’s analyses of recent Census Bureau data releases related to poverty and housing, as well as median household income, provide more details.