Like much of the United States, New Hampshire is facing a significant child care shortage. Between July 2017 and October 2024, licensed capacity among child care providers serving children under five dropped by nearly 13 percent in the Granite State.[1] From 2017 to 2023, the number of Granite State children under five dropped by approximately 1.6 percent, suggesting supply of child care reduced faster than potential demand.[2] Additionally, New Hampshire’s child care providers may have been collectively operating at only 85 percent of their full licensed capacity in September 2024, according to a provider census conducted by New Hampshire’s Department of Health and Human Services’ Bureau of Child Development and Head Start Collaboration.[3]
The limited availability of licensed child care slots is, in part, related to a shortage of child care professionals across the state.[4] Low wages for these professionals may contribute to high turnover among the Early Care and Education (ECE) workforce and create difficulty when recruiting potential teachers.[5] In 2023, New Hampshire’s full time child care educators, who are categorized by the U.S. Bureau of Labor Statistics as “child care workers,” earned a median wage of $15.62 an hour, which was half of Granite State kindergarten teachers’ annual salaries, another occupational group that educates children as young as five.[6] New Hampshire Employment Security projected the turnover rate for “child care workers” to be 17 percent annually between the second quarters of 2023 and 2025, compared to a rate of 11 percent for all New Hampshire occupations.[7]
The impact of the child care shortage extends beyond the households with children who need care. When parents do not have child care, they may not be able to fully participate in the labor force, and some may not be able to participate at all. During 2024, an average of approximately 17,300 Granite Staters reported being out of the labor force each month because they cared for children who were not in a school or child care setting.[8] This figure does not include parents who stayed in the workforce but reduced their hours to care for their children due to limited or no child care. While some parents prefer to stay out of the labor force to care for their children at home, for others, a lack of child care is the primary reason they cannot engage with the labor force. From August 2023 through August 2024, an estimated average of 13 percent of employed Granite State parents reported leaving a job, and an additional 7 percent reported losing a job, because they needed to care for their children. On average, an estimated 12 percent of parents reported they did not look for a job at all, while 47 percent reported reducing their work hours, to care for their children.[9] Without adequate child care availability, both new and long-term Granite State residents with children may struggle to join, or fully engage, in the labor force, which has not returned to its pre-pandemic level; as of October 2024, there were approximately two available jobs for every one unemployed Granite Stater who was seeking work.[10]
The current labor force constraint makes child care a unique and vital industry for supporting the growth of New Hampshire’s labor force and economy overall. When child care businesses cannot open or current providers cannot operate at full licensed capacity, New Hampshire families, businesses, local municipalities, and the State lose potential income.
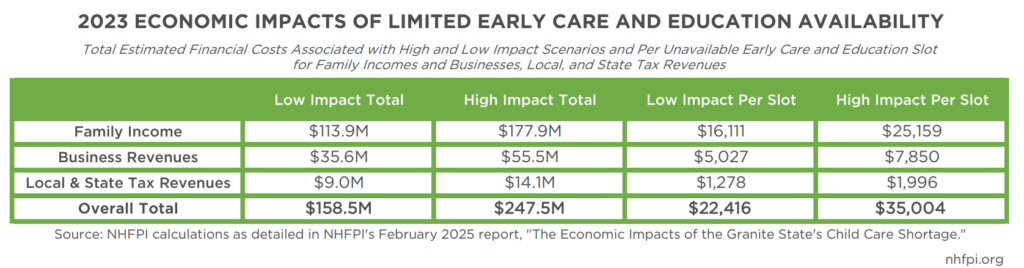
Inspired by the Bipartisan Policy Center’s (BPC) 2021 report, The Economic Impact of America’s Child Care Gap, and using New Hampshire or New England specific data where available, this report summarizes the adverse economic impacts for households, businesses, and state and local tax revenues when families cannot access child care due to limited availability.[11] Derived from this model are low and high total economic impacts, as well as impacts per unavailable slot, for family incomes, business revenues, and State and local government tax revenues. When model assumptions are tailored to New Hampshire and applied to the most recently available 2023 data, every unavailable child care slot may have cost the state’s economy as much as $35,000 in lost earnings to families and in forgone revenues to businesses as well as to the State and local governments. Specifically, families may have collectively lost as much as $177.9 million dollars in wages in 2023 due to reduced working hours or leaving the workforce, and businesses may have collectively lost as much as $55.5 million due to reduced employee productivity and impacts from benefits paid when employees were not working. Finally, the State and local governments may have lost between $9 million to $14.1 million in potential tax revenue that year, or the equivalent of approximately $1,300 to $2,000 per unavailable child care slot.
Assumptions Supporting the Estimates
Due to data availability limitations, this analysis relies on key assumptions to provide potential financial loss estimates to Granite State families, businesses, and governments. Short of conducting a census of all New Hampshire parents with children, using reliable and valid sources helps to ensure estimates provided in this report capture potential losses related to the child care shortage. Throughout the report, written descriptions prioritize transparency regarding why and how necessary assumptions were made.
The following assumptions and limitations must be considered when reading this report:
- All children who have both parents, or their sole parent, in the workforce need a licensed child care slot. Though some families prefer informal care, and others can work without using child care, available data that could quantify these shares of parents is limited. This analysis assumes children under six with all available parents in the workforce require child care.
- The analysis only includes adults in the labor force who live in a household with their “own children,” which the U.S. Census Bureau defines as, “A never-married child under 18 years who is a son or daughter by birth, a stepchild, or an adopted child of the householder.”[12] This analysis excludes adults in the labor force who live with children who are not their biological, step, or adoptive children, even if those adults provide care, financially support, and are otherwise helping to raise the children in the household. For clarity, the term “parent” is used throughout the report to denote adults in the labor force who live with their “own children.”
- The number of children under six for women in the workforce between the ages of 20 and 64 is generalized to apply to all parents. An estimate of the number of slots required per parent in the New Hampshire labor force needed to be determined to analyze how parent labor force productivity and income is impacted by disruptions to child care. For example, two parents in the workforce with one child under six would require one child care slot, or half a slot per parent; however, a single parent with two children under six would require two full slots. The U.S. Census Bureau only provides data on the number of women between 20 to 64 who have children and are in the labor force, and thus, this figure is generalized to all labor force-engaged parents in this analysis.
- The analysis excludes people who were not in the labor force in 2023, but who would have been if they had available child care. The analysis does estimate, however, the potential income lost for the percentage of additional individuals who may have left the labor force due to inadequate child care availability.
- Indirect financial impacts of unavailable child care slots are not explored in this report. Indirect financial effects, including limited purchasing power when households have less money to spend in their communities, can have additional economic effects not accounted for in this analysis. Additional dollars in local and State economies have economic ripple effects that can be beneficial for communities. A 2021 Moody’s Analytics report, for example, indicated that for every $1.00 federal investment in child care that year, there may have been about $1.19 in economic growth.[13]
- The report does not analyze the impact of unavailable child care slots for children aged six and older. While the economic losses may be smaller for this age range than for younger children due to higher child-teacher licensing ratios, there still may be impacts related to parental productivity and ability to work for individuals with children beyond preschool and kindergarten age.
- The analysis assumes parents who want child care but cannot access it are evenly distributed across all socioeconomic levels. However, higher income families are likely able to afford more expensive, alternative options such as nannies and au pairs, have access to more flexible work arrangements that would allow them to be home with their children while working, or be able to participate in a child care cooperative. As a result, demand for care may not be evenly distributed, and the groups of families most in need of child care may be more likely to have low or moderate household incomes.
Impact on Families
To estimate the economic impact of unavailable child care, the size of the child care shortage, or “gap,” must be calculated first, followed by an estimation of the total (potential) parent income that might be associated with that gap. BPC analyses used in this report estimate the affected parent income by multiplying together the child care slot gap, “working parent/child ratio,” average annual wages, and average hours worked.
Calculating the Child Care Gap
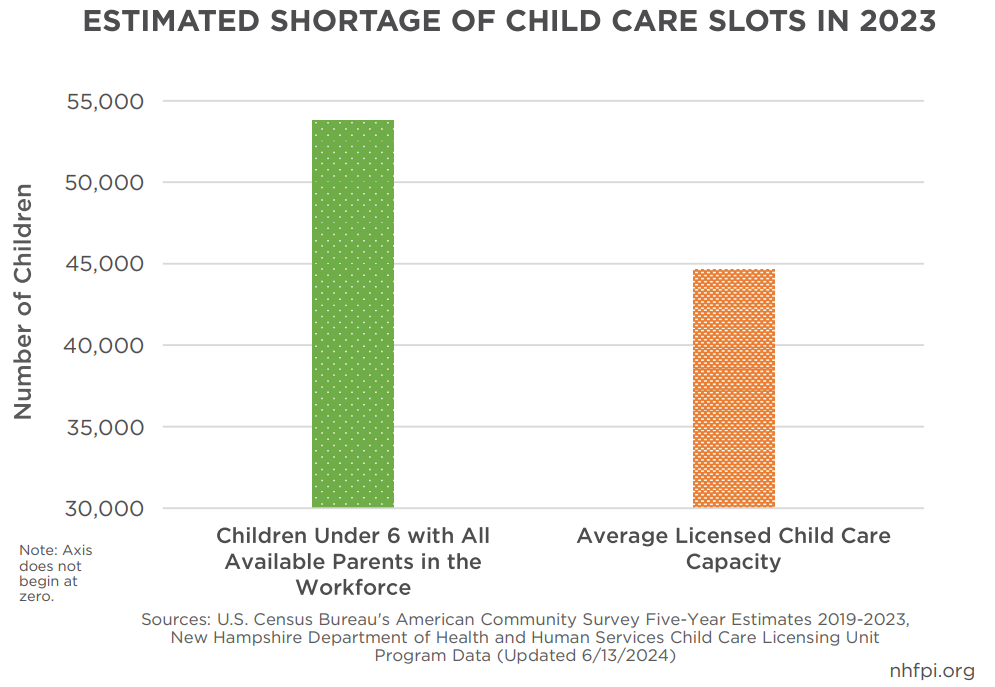
Based on 2019-2023 U.S. Census Bureau American Community Survey (ACS) estimates, there were approximately 53,752 children under six in New Hampshire with both parents, or their sole parent, in the labor force. This represents the number of children who may have needed child care. [14] The average number of licensed child care slots in New Hampshire in 2023 was 44,644.[15] Subtracting the number of licensed slots from the number of children under six who may have needed child care yields a gap of 9,108 slots. These data include all licensed child care slots in the state, even those for children older than six. This figure also summarizes full licensed capacity and does not account for providers who may have been operating below licensed capacity due to staffing shortages or other reasons related to the quality of care. As such, the shortage of slots may have been more acute than these calculations suggest.
Number of Parents Associated with Child Care Gap, Average Annual Wages, and Average Hours Worked
To calculate the impact of each unavailable child care slot on workforce-engaged parent productivity and income, an estimate of the number of parents associated with the child care gap in the New Hampshire labor force needed to be determined. In other words, how many child care slots were needed for each workforce-engaged parent in New Hampshire. For example, two parents in the workforce with one child under six would require one child care slot, or half a slot per parent; however, a single parent with two children under six would require two full slots.
Dividing the number of Granite State children under six by the number of parents in the labor force with at least one child under six would create a ratio that can be applied to the shortage of child care slots to determine the total parent income impacted by the child care shortage. ACS estimates, however, only provide data on the number of women between 20 to 64 who have children and are in the labor force. The mother/child ratio generated using the ACS estimate was generalized to be the parent/child ratio in this model.
According to 2023 ACS five-year estimates, there were approximately 37,257 Granite State women in the labor force with at least one child under six.[16] Dividing the number of children under six living with both parents, or living only with their mother, in the labor force in New Hampshire (47,978 children) by the number of labor force–engaged mothers with at least one child under six (37,257) created a ratio of approximately 0.78. This ratio means that every parent in the labor force with at least one child under six in New Hampshire would require, on average, slightly less than one (0.78) child care slot. Applying this ratio to the child care gap described above (9,108) results in approximately 7,072 labor force-engaged Granite State parents affected by the child care gap.[17]
To calculate the total parent income associated with the child care gap, the number of affected labor force-engaged parents needed to be multiplied by the average number of hours worked by Granite Staters in the labor force and average annual wage for workers in New Hampshire. In 2023, each Granite Stater in the labor force worked an average of approximately 1,453 hours annually at an average wage of $31.78 an hour.[18] When unrounded figures for the number of labor force-engaged parents impacted by the child care gap were multiplied by the average hours worked per labor forced-engaged Granite Stater and average hourly wage for all New Hampshire occupations, the total parent income associated with the child care gap was approximately $326,483,885.
Household Impact Scenarios
Even when families have child care, parents may experience a loss in income and work productivity when child care is unavailable during holiday breaks, snowstorms, or when a child is sick and is excluded from attending child care. Between September 2023 and September 2024, estimates suggest a large proportion of workforce-engaged parents in New Hampshire reported taking time off to care for children, including using paid (51 percent of workforce-engaged parents) and unpaid leave (30 percent), and reducing work hours (47 percent). Additionally, an estimated 42 percent of New Hampshire parents in the labor force reported supervising one or more children while working.[19]
The BPC’s analyses explored low- and high-impact scenarios that are more nuanced and realistic than simply estimating financial losses that could occur if all affected parents left the workforce entirely. These low- and high-impact BPC assumptions are based on several reports that estimate economic impacts from an inadequate child care supply, including data from a representative sample of employed U.S. parents who were asked a series of work and child care related questions. Examples of questions from the poll included: To what extent did finding a child care provider affect each of the following: your job search, staying in the work force, working more hours? Have you and/or your spouse made any of the following lifestyle changes in order to afford child care expenses: changed job to have more flexible work hours, working alternative hours with spouse, quit a job to stay at home with child? [20]
In the low-impact scenario, when child care is unavailable, 70 percent of labor force-engaged parents with children under six are estimated to lose productivity that equates to 7 percent of their income, while 30 percent are estimated to leave the workforce entirely, resulting in a loss of all income. In the high-impact scenario, half of all parents with children under six are estimated to lose productivity that equates to 9 percent of their income and half are expected to leave the workforce and lose all income.
Based on the assumptions in the low- and high-impact scenarios described above, New Hampshire families may have collectively lost approximately $114 million to $178 million in earnings in 2023 due to inadequate child care availability, or between $16,111 and $25,159 per unavailable slot. While this income directly affects families’ budgets, it also has impacts on local communities, as these funds are not flowing to employers and businesses in the local and state economies or able to be used for savings and family economic security.
Impact on Businesses
To calculate adverse financial impacts for businesses due to the child care shortage, the BPC analysis accounts for multiple aspects of employee productivity and business losses. Similar to the household impact analysis, the business analysis includes losses in employee productivity when parents need to reduce their hours due to children’s illnesses or school closures as well as productivity loss associated with the stress of coordinating alternative child care arrangements during disruptions.[21] There are also business losses associated with wages and benefits paid to employees while they are on leave and not producing output. Considerable costs are also incurred when employees leave a position and businesses need to recruit, hire, and train a replacement. Investing in and retaining current employees is far more cost-effective for businesses than spending resources to replace them. [22]
Employee Productivity Losses
The BPC analyses estimate that employee productivity losses equate to 10 percent of the family income losses in both low- and high-impact scenarios, totaling approximately $11.4 million to $17.8 million in employee productivity losses for businesses in New Hampshire in 2023.[23]
Continual Pay and Benefits Losses
Benefits such as paid time off, paid family leave, retirement contributions, and medical insurance may not typically be considered as part of an employee’s base salary or wages; however, benefits are continuous expenses for employers even when an employee is not working. When an employee utilizes paid time off, for example, there is often no corresponding employee productivity, but employers still provide compensation and benefits during these time periods. As such, continual pay and benefits losses should be included in models of potential lost revenue to businesses in employee productivity models. In this analysis, costs associated with continual pay and benefits were calculated by using 2023 U.S. Bureau of Labor Statistics data for the New England region, as New Hampshire-specific data was unavailable, and applied to the low- and high-impact family loss totals.[24] The percentage of New England employer costs for employee compensation for paid leave, supplemental pay, and insurance were 8.2 percent, 5.2 percent, and 7.8 percent, respectively. When combined, the continual pay and benefits losses related to inadequate child care for Granite State employers may have ranged between approximately $24.2 million and $37.7 million.
Total Business Losses
When employee productivity losses were combined with continual pay and benefits losses, New Hampshire businesses were estimated to have lost between approximately $35.6 million in the low impact scenario to over $55.5 million in the high impact scenario. This equates to approximately $5,000 to $7,850 per unavailable child care slot.
Impact on Tax Revenues
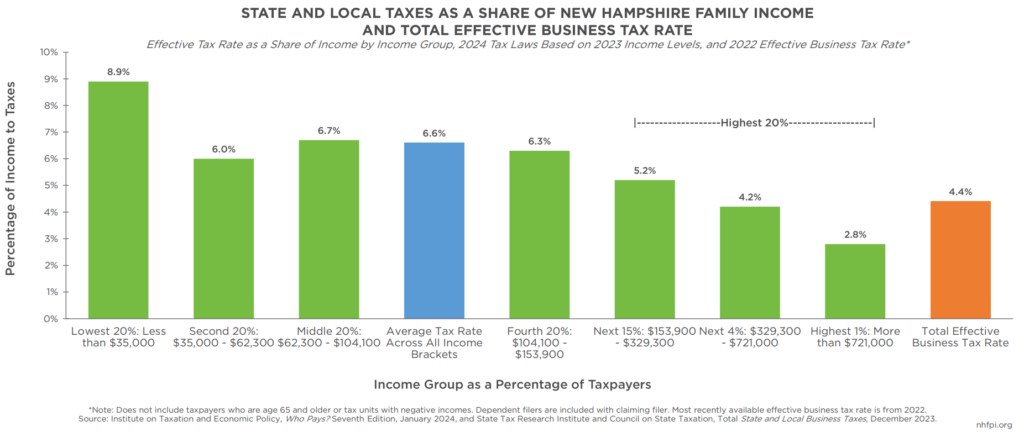
Family and business losses adversely impact overall state and local tax revenues. Although the Granite State does not have a broad-based income or sales tax, residents pay multiple taxes, including taxes on motor fuels, meals when dining out, rental costs when staying in a hotel, and when purchasing real estate, cigarettes, or certain communication services. The original BPC analysis utilized the average national tax rate of 20 percent; however, this New Hampshire-focused analysis can more accurately estimate actual tax rates paid by Granite Staters. To account for state and local tax revenue losses from households to the State and its local municipalities, an average of 6.56 percent was calculated using figures from the Institute on Taxation and Economic Policy to estimate state and local tax revenue losses from families.[25] Forgone state and local tax revenue from business losses was calculated using an average of 4.4 percent derived from the State Tax Research Institute and Council on State Taxation’s total effective business tax rate from the most recent fiscal year available, 2022.[26]
When tax revenue percentages were applied to low- and high-impact scenarios for families and businesses, combined state and local tax revenue loss totals ranged between approximately $9.0 million and $14.1 million, or approximately $1,300 to $2,000 for every unavailable child care slot.
Policy Considerations
Creating additional, high-quality child care slots to meet the potential needs of Granite State families with children is a large endeavor that will require a multi-prong approach. There is no one-size-fits-all solution, even among New Hampshire counties and municipalities, and thus, multifaceted solutions will need to be implemented to help make progress toward meeting New Hampshire’s ECE needs while ensuring safe, enriching environments for the Granite State’s youngest residents.
Reducing Administrative Barriers to New Hampshire’s Child Care Scholarship Program
To help make child care more affordable, the State Fiscal Years (SFYs) 2024-2025 biennium budget expanded family income eligibility for the New Hampshire Child Care Scholarship Program (NHCCSP), a state-federal partnership that helps make child care more affordable for households with low and moderate incomes.[27] Since December 2023, the month prior to the expansion implementation, NHCCSP usage has increased by nearly 42 percent as of October 2024, from 2,660 to 3,773 children. Despite the eligibility expansion and increased usage, NHCCSP is an underused resource, with only 6.9 percent of an estimated 55,000 eligible children in the Granite State using child care scholarship.[28]
National underutilization of services including child care assistance, WIC, and SNAP is, in part, a result of state administrative barriers. These barriers may make enrolling and maintaining enrollment in government programs onerous for eligible individuals and families, and they can be cost-inefficient and time-consuming for state offices and employees who administer the programs.[29] For example, more frequent recertifications generate additional paperwork, questions, and phone calls for program administrators. Under enrollment in assistance programs may also have the potential to negatively impact the overall economy. A Moody’s Analytics report from 2021 estimated that for every one dollar of federal investment in SNAP, child care, or universal pre-kindergarten, there was more than one dollar in economic growth in the fourth quarter of that year.[30] When eligible individuals and families are unable to access government resources, the potential of the additional funds working through the economy goes unrealized.
When permissible by federal rules and regulations, states can reduce administrative barriers by extending time between recertification periods, automating reminders about recertifications through text messages or emails, simplifying reporting requirements to include only necessary information, and investing in human-focused technology infrastructures that are easier to navigate for potential program enrollees like those offered by Code for America.[31] These infrastructure changes can include online application forms available in multiple languages, reducing the reading level necessary to complete applications, and optimizing search engine results for state services.[32] Reducing enrollment barriers and administrative burden for potential enrollees and state program administrators may help more Granite State families enroll in the NHCCSP, reduce workload for program administrators, help New Hampshire draw down additional Federal matching funds from the Child Care and Development Fund (CCDF), and generate addition funds to reinvest into the state’s child care infrastructure.
Additional General Funds for Child Care Providers
Federal regulations have specific rules regarding how CCDF funds are used, including a required state funding match to receive federal funding for NHCCSP.[33] Due to these regulations, the majority of CCDF funding must go to child care scholarships and cannot be allocated directly to child care providers for operating costs that may help recruit and retain early care and education professionals, including increased wages and benefits.
According to the Prenatal-to-Three (PN3) Policy Impact Center’s 2024 Roadmap report, New Hampshire ranks 47th out of the 50 U.S. states and the District of Columbia on policies and strategies that benefit families with young children between the prenatal stage and age three.[34] PN3 has several recommendations to better support families with children in this age range, one of which is to increase reimbursement rates to providers accepting NHCCSP.[35]
Currently, providers receive reimbursement rates set at the 75th percentile of statewide tuition rates based on the 2024 Market Rate Survey.[36] This reimbursement is at the federally recommended rate for state and federal partnership funds used for the NHCCSP; however, states can elect to increase reimbursement to the 100th percentile by funding the difference between the 75th and 100thpercentiles with their own non-federal funds. Currently, some providers may enroll children receiving scholarships at a loss to their business revenues because the reimbursement funds they receive may not fully cover the price of tuition that private-paying families pay.[37] To make up for the disparity in reimbursement, providers may pass on the remaining tuition costs to families receiving scholarships, resulting in child care co-pay fees. Using State General Funds to help ensure reimbursement rates better reflect the true cost of high-quality child care may allow providers to increase wages for the ECE workforce without increasing tuition rates and charging co-pay fees to families receiving scholarships.
Currently, families earning between 138 percent of the federal poverty level and the 85th percentile of State Median Income are expected to pay 7 percent of their household income, which is the upper bounds of child care cost that is considered affordable according to the U.S. Department of Health and Human Services, as part of their child care cost share.[38] Based on estimates from the PN3 report, a single parent with two children earning minimum wage in New Hampshire may pay approximately $4,000 annually in additional child care co-pay fees beyond their cost share in 2024.[39] As a result, some families receiving scholarships in New Hampshire are paying child care tuition rates above 7 percent of their household income. Providers may not participate in NHCCSP due to the disparity in reimbursement, especially if they are in a region where there are enough families who can afford the private tuition rates to fill their open child care slots. The disparity in reimbursement may help explain why approximately 30 percent of New Hampshire child care providers are not enrolled in the NHCCSP.[40]
The estimated losses in local and state tax revenues described in this report are based on 2023 figures and do not include the potential impacts of a $15 million, one-time General Fund allocation to support the Child Care Workforce Grant program. This initiative was an effort to increase recruitment and retention among child care professionals in New Hampshire.[41] Future examination of ECE professionals’ wages and turnover within the field will help determine the impact of the allocation. The $15 million in one-time General Funds was in addition to New Hampshire’s State Fiscal Years’ 2024-2025 allocation of approximately $13.7 million in General Funds each fiscal year to access additional federal funding for NHCCSP.[42] These two General Fund appropriations represented all direct State support to child care providers derived from State-collected revenue during 2024.[43]
Developing A True Cost of High-Quality Early Care and Education Model
States can also elect to invest in the development of a cost modeling approach that estimates the true cost of providing high-quality ECE. These models provide reimbursement standards which pay providers based on operating costs of providing high-quality ECE rather than based on market rate surveys which examine what providers charge for tuition. Providers often set their tuition rates based on what families in their area can afford for child care, rather than the actual cost of running their businesses.[44] This practice may result in some providers operating with thin, if any, profits to reinvest in the business, including increasing wages and providing benefits for ECE professionals. The first step of developing a cost model is investing in data infrastructures to help ensure data used for model creation is of the highest quality and provides representative summaries of the state’s families as well as ECE providers and professionals.[45]
Increased Focus on Recruitment and Retention of Early Care and Education Work Force
In 2023, New Hampshire’s ECE workforce had the lowest paid ECE professionals among the northern New England states and Massachusetts, with professionals in the “child care workers” occupation category earning a median hourly wage of $15.62 and those in the “preschool teacher” category earning $18.10.[46] The median hourly wage in New Hampshire in 2023 was $24.03, suggesting current and potential ECE professionals may be drawn to other occupational opportunities that have higher wages, or they may pursue ECE opportunities in neighboring states.[47]
One approach for increasing recruitment and retention may be direct stipends to ECE professionals. In 2024, the Maine legislature and governor approved an annual allocation of $30 million to provide monthly stipends ranging between $240 and $540 to ECE professionals, depending on level of education and experience in the field.[48] Another approach is providing benefits, including child care tuition assistance for ECE professionals’ own children. During 2024, New Hampshire passed legislation to allocate $2 million for the creation and implementation of a child care workforce assistance project lasting from January 1, 2025 to June 30, 2025. The project expands eligibility for the NHCCSP to child care professionals who work at least 25 hours per week in licensed child care facilities that accept NHCCSP and live in “[h]ouseholds with an income equal to or less than the median income for the geographic area in which they reside”.[49]
New Hampshire businesses can also provide support for their local ECE providers. According to survey results from the Granite United Way’s 2023 Child Care Business and Employer Partnership Project, over 90 percent of employers surveyed reported providing child care supports was important for employee recruitment and retention noting supports improved employee satisfaction, reduced turnover, attracted new talent, and increased productivity and profitability. Additionally, 87 percent of employers reported the reason they wanted to offer supports was “because it’s the right thing to do.” A much smaller proportion of respondents, however, reported having onsite child care (15 percent), backup/emergency child care (11 percent), or child care assistance (45 percent) supports for their employees.[50]
Child care development grant programs may be an opportunity for local businesses in need of child care for their employees to continually invest in a funding pool that could be accessible to local child care providers to create additional slots for children. Funds might be used for various expenses including paying ECE professionals higher wages, hiring additional teachers at higher starting wages, and building or purchasing larger spaces to expand their licensed capacity. The Colorado legislature passed a bill in 2024 that created a development grant program which allows local entities, including local governments and public-private partnerships, to receive funding to create additional child care slots through capital projects. Grant recipients share the cost of expenses with the state for each project.[51] Businesses can also contract with local ECE providers and pay to keep a set number of child care slots open for their current and future employees. Contracting helps ensure employees will have child care when they need it while also providing support to local child care businesses.
Ease Zoning Restrictions and Language Barriers for Potential Family Child Care Providers
Another approach that may help increase the number of child care slots in the Granite State is to support the expansion of a high-quality family child care provider infrastructure. These providers care for children in their homes and are generally smaller than center-based providers. They may be ideal settings in rural areas where the child population may not support a large center. Additionally, smaller, home-based providers may be able to better meet the needs of families seeking culturally competent care, particularly families immigrating from other countries who want their children to learn their cultural traditions and languages. Home-based providers may also be the only option for parents who are shift workers or work multiple jobs and need child care outside of the typical 7am to 6pm time frame.[52]
Family child care businesses, however, may encounter operating barriers due to local zoning restrictions and complexities in navigating licensing requirements, particularly for providers for whom English is a second language. The New Hampshire Community Development Finance Authority has launched several projects to support small businesses in New Hampshire to increase child care availability across the state.[53] The New Hampshire Guide to Becoming a Family Child Care Provider was one of the products that emerged from this work, which explains the process of opening and operating a family child care small business for interested individuals.[54] Continued work in this area may help increase availability of child care slots as well as additional ECE options for families.
Conclusion
Limited child care availability is not only a problem for families with children. Investments in New Hampshire’s child care infrastructure, specifically mechanisms that increase the availability of licensed child care slots, may raise household income for parents engaging in the workforce and increase revenues for businesses, local municipalities, and the State. Increased availability of child care slots may also create workforce engagement opportunities for the portion of the nearly 17,300 individuals out of New Hampshire’s labor force each month in 2024 who would like to work but could not because they were caring for children.[55] One result of limited investment in ECE professionals, or the “workforce behind the workforce,” may be considerable income loss for Granite State families and lost revenue for New Hampshire’s businesses and employers, as well as the State as a whole. At a time when State revenues are falling and there are more employment opportunities available than potential employees to fill them, more public investments in the New Hampshire child care industry could produce clear benefits for Granite Staters and the economy while helping to offset between $9 million and $14 million in lost tax revenue each year to the child care shortage in the Granite State.
Endnotes
[1] See the University of New Hampshire Carsey School of Public Policy’s Fall 2024 Granite Guide to Early Childhood Primer #2, Fewer Providers, Longer Distances: New Hampshire’s Child Care Landscape.
[2] See the U.S. Census Bureau’s American Community Survey Five-Year Estimates, Table S0101, for New Hampshire in 2017 and 2023.
[3] See New Hampshire Department of Health and Human Services Bureau of Child Development and Head Start Collaboration’s September 2024 New Hampshire Child Care Profile.
[4] See the University of New Hampshire Carsey School of Public Policy’s Fall 2024 Granite Guide to Early Childhood Primer #2, Fewer Providers, Longer Distances: New Hampshire’s Child Care Landscape.
[5] See NHFPI’s May 2024 Issue Brief, The Fragile Economics of the Child Care Sector and University of New Hampshire Carsey School of Public Policy’s Fall 2024 Granite Guide to Early Childhood Primer #3, New Hampshire’s Well Educated, Underpaid Child Care Workforce.
[6] See U.S. Bureau of Labor Statistics’ Occupational Employment and Wage Statistics for “childcare workers” and “kindergarten teachers, except special education”
[7] See NHFPI’s May 2024 Issue Brief, The Fragile Economics of the Child Care Sector figure entitled, Projected Annual Turnover for New Hampshire Child Care Workforce.
[8] See U.S. Census Bureau’s Household Pulse Survey, January 9 through September 16 Table 3. Educational Attainment for Adults Not Working at Time of Survey, By Main Reason for Not Working and Source Used to Meet Spending Needs.
[9] See U.S. Census Bureau, Household Pulse Survey, August 20 – September 16, Table 5. Childcare Arrangements for Children in the Household, by Select Characteristics.
[10] See U.S. Bureau of Labor Statistics’ Graphics for Economic News Releases Number of unemployed persons per job opening by state, seasonally adjusted accessed February 3, 2025.
[11] For full report and methodology, see the Bipartisan Policy Center’s November 2021 report, The Economic Impact of America’s Child Care Gap.
[12] For definition of “Own Child” see American Community Survey and Puerto Rico Community Survey 2023 Subject Definitions, p. 87.
[13] See NHFPI table, Returns on Investment from Certain Policies: Fiscal Stimulus Multipliers, 2021.
[14] See U.S. Census Bureau’s 2023 American Community Survey Five-Year Estimates, Table B23008. Calculation derived by adding children under 6 living with both parents in the labor force, children under 6 living with father in the labor force, and children under 6 living with mother in the labor force.
[15] See New Hampshire Child Care Licensing Unit’s document, New Hampshire Licensed Child Care Program and Capacity Data (Updated June 13, 2024). Calculation derived by averaging the May 2023 and December 2023 data points.
[16] See U.S. Census Bureau’s 2023 American Community Survey Five-Year Estimates, Table B23003.
[17] See the Bipartisan Policy Center’s November 2021 report, The Economic Impact of America’s Child Care Gap.
[18] See New Hampshire Employment Security’s Economic and Labor Market Information Bureau’s Granite Stats Annual Civilian Labor Force Size for 2023, the U.S. Bureau of Labor Statics’ State and Regional Labor Productivity for New Hampshire (Updated May 30, 2024), and New Hampshire Employment Security’s Economic and Labor Market Information Bureau’s Occupational Employment and Wages Statistics, 2023 Statewide figures.
[19] See U.S. Census Bureau, Household Pulse Survey, August 20 – September 16 Table 5. Childcare Arrangements for Children in the Household, by Select Characteristics.
[20] See the Bipartisan Policy Center’s November 2021 report, The Economic Impact of America’s Child Care Gap, Morning Consult’s National Tracking Poll Project 191023 and National Tracking Poll 191023 Crosstabulation Results.
[21] See the Bipartisan Policy Center’s November 2021 report, The Economic Impact of America’s Child Care Gap, p. 9.
[22] See Gallup’s March 2019 report, This Fixable Problem Costs U.S. Businesses $1 Trillion and Society for Human Resource Management’s April 2017 report, Talent Engagement: The Link Between Performance & Retention.
[23] See the Bipartisan Policy Center’s November 2021 report, The Economic Impact of America’s Child Care Gap, p. 9-10.
[24] See U.S. Bureau of Labor Statistics March 2024 News Release, Employer Costs for Employee Compensation – December 2023, p. 19
[25] See the Institute on Taxation and Economic Policy’s January 2024 report, Who Pays? A Distributional Analysis of the Tax Systems in All 50 States, p. 50. Note that a weighted average was used to generate the 6.56 percent average tax rate to account for ITEP’s granular breakdown of the top 20 percent of tax payers into smaller categories.
[26] See the State Tax Research Institute and Council on State Taxation’s December 2023 Report, Total State and Local Business Taxes: State-by-State Estimates for FY22, p. 19. Note: The STRI and COST study defined “business taxes” as “…property taxes paid by businesses; sales and excise taxes on intermediate inputs and capital expenditures purchased by businesses; business entity taxes such as the corporate income tax, gross receipts tax, franchise tax and license taxes on businesses and corporations; the share of individual income taxes paid by owners of noncorporate businesses (passthrough entities or PTEs); unemployment insurance taxes and all other state and local taxes that are the statutory liability of business taxpayers.”
[27] See NHFPI’s January 2024 blog, “New Hampshire Child Care Scholarship Eligibility to be Expanded in 2024, Provider Reimbursement Rates Increased.”
[28] See the University of New Hampshire Carsey School of Public Policy’s March 2023 brief, Why Interstate Child Care Scholarship Policy Choices Matter in the Upper Valley and the University of New Hampshire’s Carsey School of Public Policy and NHFPI’s January 16, 2025 presentation to the Department of Health and Human Services’ Bureau of Child Development and Head Start Collaboration State Leadership Team meeting, slide 34.
[29] See Prenatal-to-3 Policy Impact Center’s July 2023 blog, Administrative Burden: Everyone Pays when Eligible Families Can’t Access Public Assistance.
[30] See NHFPI table, Returns on Investment from Certain Policies: Fiscal Stimulus Multipliers, 2021.
[31] See Prenatal-to-3 Policy Impact Center’s July 2023 blog, Administrative Burden: Everyone Pays when Eligible Families Can’t Access Public Assistance and Code for America’s August 2019 article, Bringing Social Safety Net Benefits Online.
[32] See Code for America’s interactive Benefits Enrollment Field Guide.
[33] See NHFPI’s February 2024 issue brief, The State of Child Care in New Hampshire: End of One-Time Federal Investments May Reduce Industry Stability and embedded figures entitled “New Hampshire’s Child Care Development Fund Allocation Formula and Allocations” and “New Hampshire Child Care and Development Fund /Expenditures for Federal Fiscal Year 2020.”
[34] See the Prenatal-to-3 Policy Impact Center’s infographic, The Impact of State Policy Choices on Family Resources Across States.
[35] See the Prenatal-to-3 Policy Impact Center’s 2024 State Policy Roadmap for New Hampshire, p. 3.
[36] See Brodsky Research and Consulting’s June 2024 report, State of New Hampshire Child Care Market Rate Study and Narrow Cost Analysis.
[37] See the Administration for Children & Families January 2025 report, CCDF Provider Payment Rates by State.
[38] See the U.S. Department of Health and Human Services, March 2024’s Federal Register Rules and Regulations entitled, Improving Child Care Access, Affordability, and Stability in the Child Care and Development Fund (CCDF).
[39] See Prenatal-to-3 State Policy Roadmap’s Methods and Sources 2020-2024 Policy Impact Calculator, p. 2 and Prenatal-to-3 Policy Impact Center’s New Hampshire Road Map. Note: New Hampshire refers to the 7 percent payment contribution required by parents to providers as “cost share” and the remaining payments owed (if applicable) “co-payment.” The federal government and Prenatal-to-3 refer to the 7 percent payment as the “co-payment” and the remaining payments owed (if applicable) as “cost share” or “child care fees.”
[40] See University of New Hampshire’s Carsey School of Public Policy and NHFPI’s January 2025 presentation to the Department of Health and Human Services’ Bureau of Child Development and Head Start Collaboration State Leadership Team meeting, slide 29.
[41] See New Hampshire Department of Health and Human Services’ December 2023 document, Child Care Work Force Grant (CCWG) State Fiscal Years 2024 and 2025 as of January 2, 2024 and Chapter 79:534, p. 136.
[42] See Chapter 106: 2977, Laws of 2023, p. 538.
[43] See New Hampshire Child Care Licensing Unit’s document, New Hampshire Licensed Child Care Program and Capacity Data, updated June 13, 2024.
[44] See Prenatal-to-3 State Policy Impact Center’s August 2023 blog, The Child Care Crisis, Part 2: How the Right Reimbursement Rate Changes Everything.
[45] See The Brookings Institution’s January 2025 research, How Virginia’s LinkB5 System Advances Early Education Policy.
[46] University of New Hampshire’s Carsey School of Public Policy and NHFPI’s January 2025 presentation to the Department of Health and Human Services’ Bureau of Child Development and Head Start Collaboration State Leadership Team meeting, slide 36.
[47] See U.S. Bureau of Labor Statistics’ Occupational Employment and Wage Statistics category “All Occupations.”
[48] See the Maine Department of Health and Human Services resource, Early Childhood Educator Workforce Salary Supplement System and Maine Office of the Governor’s January 2024 announcement, Mills Administration Issues Pay Increases to Child Care Workers.
[49] See NHFPI’s January 2025 data byte, Child Care Scholarship Eligibility Caps Temporarily Expanded for Child Care Professionals.
[50] See Granite United Way’s Work Well NH’s Child Care Business and Employer Partnership Project Child Care Survey Results, “Employers Child Care Preferences.”
[51] See Colorado General Assembly’s 2024 Regular Session’s HB24-1237 Programs for the Development of Child Care Facilities.
[52] See Bipartisan Policy Center’s 2021 report, The Value of Family Child Care.
[53] See the New Hampshire Community Development Finance Authority’s October 2023 announcement, CDFA Launching Statewide Family Child Care Workforce Pilot Program.
[54] See the New Hampshire Community Development Finance Authority’s New Hampshire Guide to Becoming a Family Child Care Provider.
[55] See U.S. Census Bureau, Household Pulse Survey, August 20 – September 16 Table 3. Educational Attainment for Adults Not Working at Time of Survey, By Main Reason for Not Working and Source Used to Meet Spending Needs.