Municipal property valuation indicates the total value of properties in a municipality that local governments can use as a tax base to raise revenue. Municipalities with larger populations generally have the highest total property valuation, as properties in the municipality contribute to the total valuation and larger municipalities will necessarily have more housing, commercial buildings, and other taxable property. In fact, the ten municipalities with the highest total property valuations include Manchester, Nashua, Salem, Concord, Londonderry, Merrimack, and Dover, which were all among the state’s top ten most populous municipalities in 2010. Although Manchester and Nashua have the highest property valuations, that does not indicate these cities have a tax base large enough to support the service needs of their populations with greater ease than other municipalities that have lower overall property valuations, as the costs of service needs vary with population and other factors. Municipalities with the highest property values also tend to be located closer to metropolitan Boston or the state’s more urban municipalities as well as near recreation areas in the White Mountains, Lakes, and Seacoast regions.
However, if we compare the total municipal property value in per capita terms for each municipality, it is possible to identify the ways in which external factors may impact municipal property values and show the relative difficulty municipalities may have in raising funds for services. Using the 2017 municipal property value data from the NH DRA and the 2010 Census population count, the map below shows the municipal property value per capita across the state’s municipalities. The larger the property value per capita of the municipality, the darker the shade of brown. Newington and Waterville Valley have the highest valuations per capita at over $1.3 million, with the next closest being New Castle at $748,201; Newington and Waterville Valley have been removed from the color scale on the map to allow for more visible color gradation between communities with lower per capita valuations.
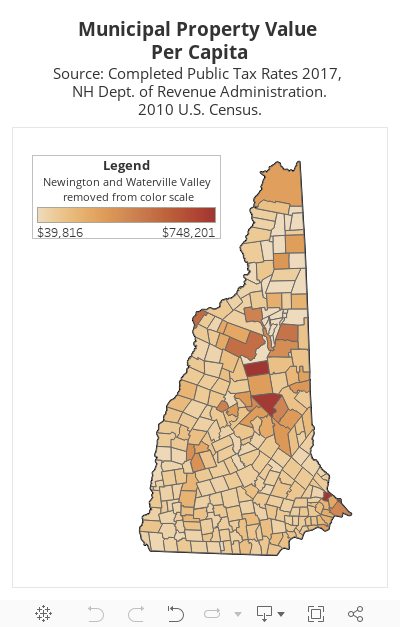
In per capita terms, the most pronounced group of municipalities are the ones located in recreational areas that are likely to have second homes or where property values are higher due to natural amenities, such as mountains or bodies of water. Waterville Valley, New Castle, and Moultonborough are examples of these communities. Vacation or second homes likely increase the property value per capita the most near lakes such as Newfound, Sunapee, and Winnipesaukee, in certain communities adjacent to or within the White Mountains and recreational facilities in those municipalities, and in some North Country communities with relatively low permanent populations. Certain municipalities with high commercial or utility property values relative to their population, such as Newington, also have relatively high property valuations per capita.
Municipalities with larger populations and higher population densities may have a lower property valuation per capita but see their service costs eased through the ability to expand existing services, such as water systems and other utilities, rather than needing to establish new services. However, communities with higher populations may also have higher and more complex service needs that smaller communities do not typically face.
There are also relatively wealthy communities with mid-sized to large populations that have valuations per capita in the middle or the upper-middle of the range. These include residential communities in suburban areas of the southeastern part of the state, such as Bedford and Bow, that may attract middle- and high-income families with the services offered, including the quality of schools and other resources available to residents. These and other municipalities may have less property wealth per capita than the most property-rich communities in the state, despite higher incomes and a healthy residential housing stock, because of a larger average number of people living in each home, in contrast to those communities with high levels of second and vacation homes or smaller household sizes.
There are the communities that likely struggle the most to raise funds, which are municipalities that have low property valuations and low- to mid-sized populations. Berlin and Claremont are examples of communities with mid-sized populations, and Allenstown, Lisbon, Troy, and Pittsfield are examples of smaller communities, that share these characteristics. This group of communities may include certain municipalities in the southeastern part of the state and in areas with higher property wealth more generally. For example, Derry has approximately half of the property valuation per capita as neighboring Londonderry, which suggests substantially differing capacities to provide services paid through property tax revenue.
Property taxes are the primary method through which local governments raise money in New Hampshire, and in some cases are the only viable option for raising revenue. Municipalities with lower populations may face a higher cost per capita to establish and maintain public infrastructure at the local level. This could have a great impact on access to services and potential municipal investments. Municipalities with smaller populations and property tax bases may struggle to raise funds to finance needed infrastructure, as each resident would have to face higher financial cost per dollar of property value to fund investments. Coupling smaller communities’ limited fiscal capacity with their higher incidence of aging population, inequities in access to services and economic opportunity may emerge across the state’s municipalities.
For more on other metrics of economic activity and fiscal capacity in New Hampshire communities, see NHFPI’s Issue Brief Measuring New Hampshire’s Municipalities: Economic Disparities and Fiscal Capacities.