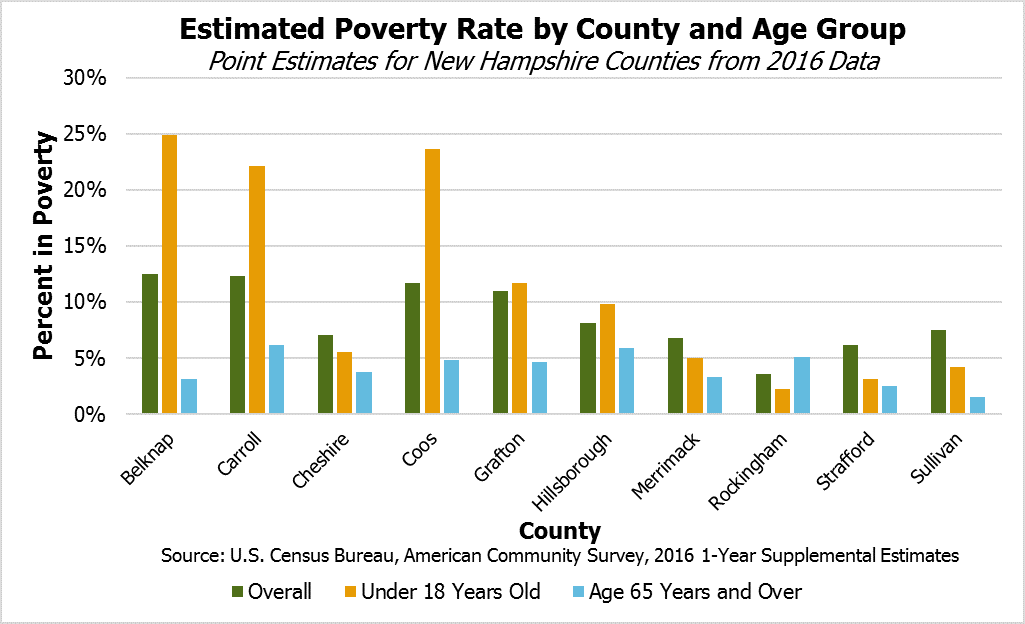
Following the primary data release in September 2017, the United States Census Bureau American Community Survey data released in October 2017 provides estimates, based on data collected in surveys conducted throughout 2016, of New Hampshire’s population characteristics for all geographic subdivisions with more than 20,000 residents. These data permit comparisons between point estimates for median household income and poverty rates in each of the state’s ten counties and 13 largest municipalities. As sample sizes are small for certain geographies, note that the margins of error may be large around some of these point estimates.[1]
Median Household Income
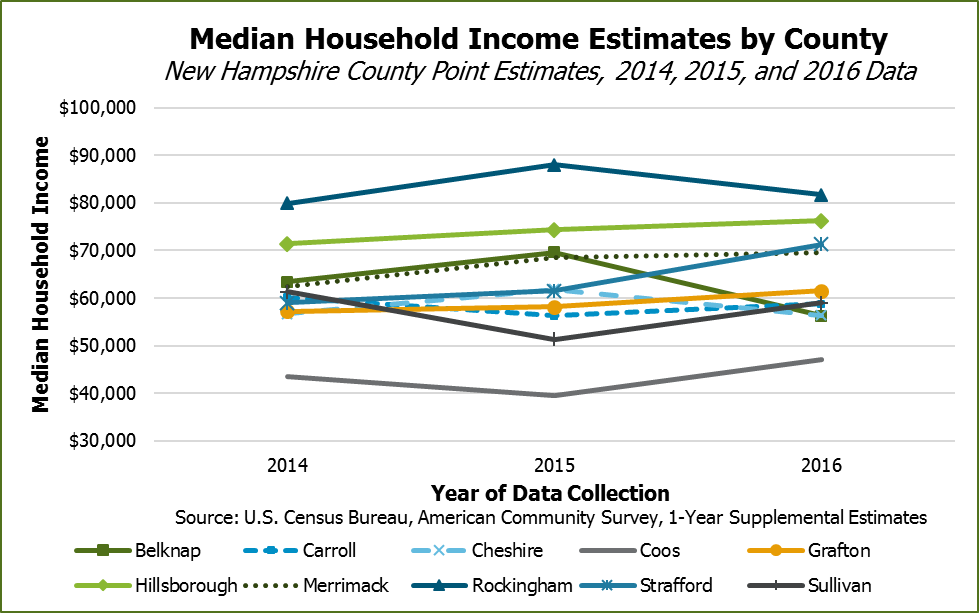
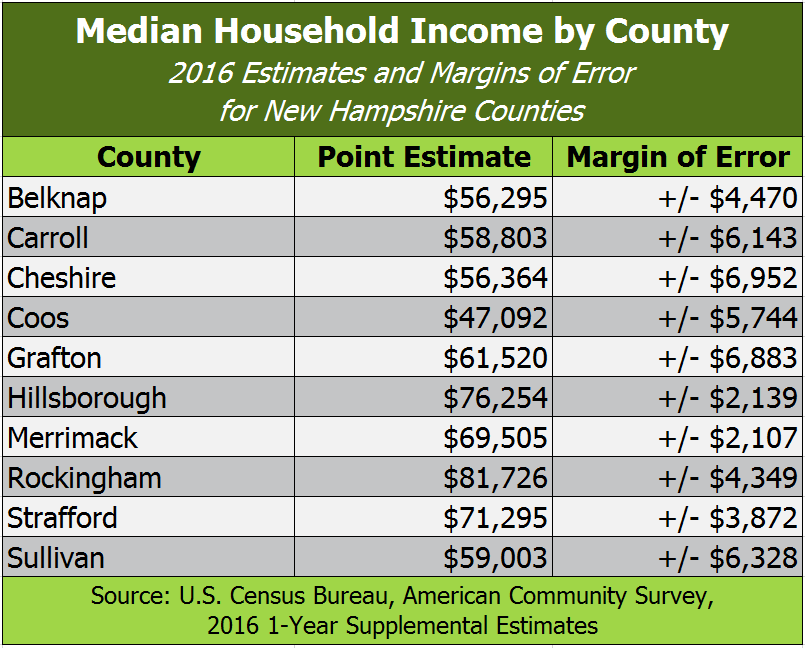
On a county level, Granite Staters see widely different median household incomes from statewide median of $70,936, based on data collected in 2016, but also from each other. The state’s two most populous counties, Hillsborough and Rockingham, help boost the statewide median income, but the least populous county, Coos, has a substantially lower estimate of $47,092. The state’s other predominantly rural counties (Sullivan, Grafton, Carroll, and Belknap) have estimated median household incomes lower than the cluster of more urban counties (Strafford, Merrimack, Hillsborough, and Rockingham).
Rockingham County, which is the state’s most southeastern county and includes both New Hampshire’s seacoast and the communities with the most direct access to Boston, had the highest median household income at $81,726. If Rockingham County were its own state, it would rank first in median household income, above Maryland, while Coos County would rank 43rd, between Tennessee and New Mexico. Compared to 2015, Coos and Strafford counties saw statistically significant increases in their median household incomes, while Rockingham and Belknap counties experienced statistically significant decreases of $6,234 and $13,270, respectively.
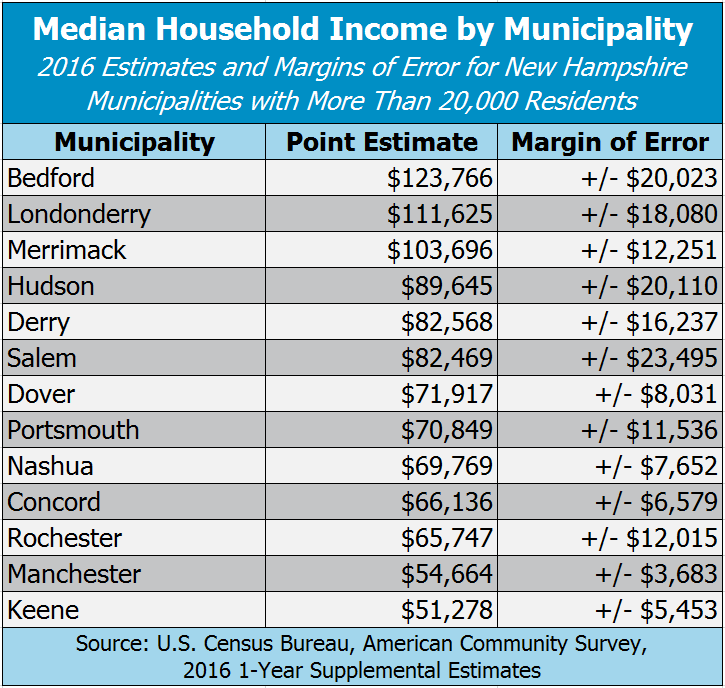
The U.S. Census Bureau also provided details for municipalities with more than 20,000 residents. Although the margins of error can be large due to small sample sizes in this 2016 survey collection, substantial differences in point estimates suggest notable disparities in incomes across municipal borders within counties as well as between counties. For example, Bedford topped the median household income list with $123,766, while neighboring Manchester, also in Hillsborough County, had a figure of $54,664, 44 percent of Bedford’s median household income. Keene, the only municipality with over 20,000 residents outside of the southeastern quadrant of the state, had the lowest median household income of the 13 largest municipalities, with $51,278.
Poverty Rates
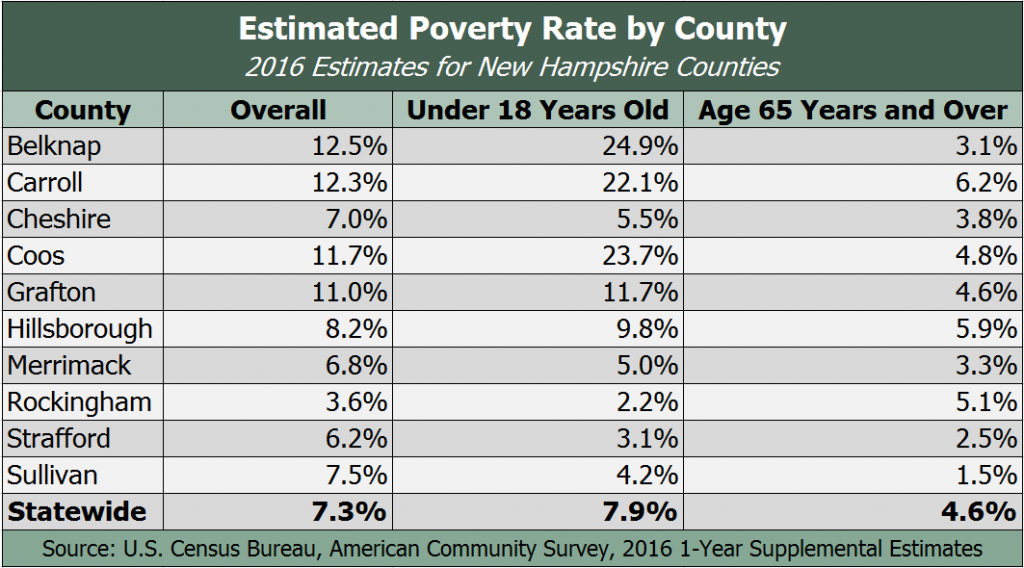
The percentage of people living in poverty also varies widely by county, and there are substantial differences in the point estimates between age groups as well. The four northernmost counties in the state all have estimated poverty rates of 11 percent or higher, well above the state’s average of 7.3 percent, while the child poverty rate is above 20 percent in Belknap, Carroll, and Coos counties. Comparatively, Rockingham County’s overall poverty rate is 3.6 percent. The city of Manchester had a poverty rate of 14.1 percent, and Nashua’s was 9.1 percent. Relative to the 2015 estimates, Coos and Strafford counties saw statistically significant decreases in their poverty rates, while Belknap had a statistically significant increase. Belknap County was the only county to have a statistically significant increase in child poverty, while it dropped in four counties.

