This fact sheet provides a snapshot of key facts about New Hampshire’s housing constraint.
House Sale Prices Continue to Rise
- The median sale price for a single-family house in the Granite State reached $540,000 in June 2024, a 63.3 percent increase from June 2020 and the highest monthly median sale price on record.[1]
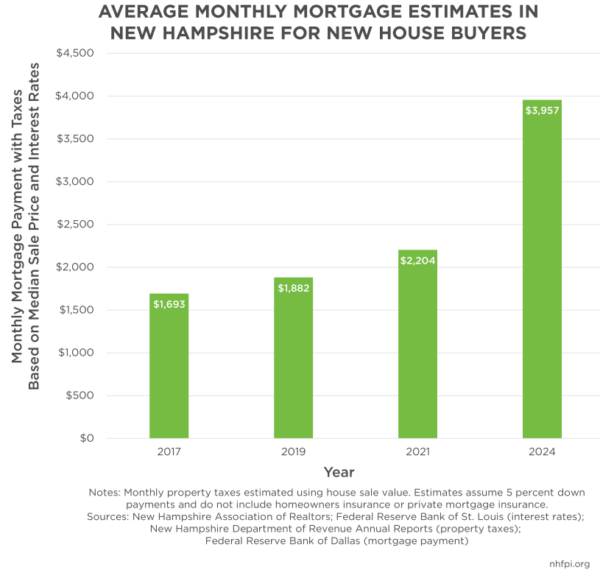
- Using a 6.7 percent 30-year fixed-rate mortgage, the average for 2024, the annual median sales price of $514,000, with a five percent downpayment of $25,700 and the 2024 average monthly New Hampshire property taxes per household of $806, a homebuyer would need to pay a monthly mortgage of $3,957, a 134 percent increase from the 2017 median monthly mortgage and tax estimate for new house buyers.[2]
- Based on median household income in 2023, a New Hampshire household would have needed to spend about 49 percent of its monthly income to afford a median-priced house in 2024.[3]

Low Housing Inventory
- New Hampshire Housing, the state’s housing finance authority, estimated in 2023 that New Hampshire needed 23,500 more housing units to meet demand, and 90,000 more units by 2040.[4]
- The Real Estate Center at Texas A&M University estimates a balanced housing market has about 6.5 months of inventory. New Hampshire had an average of 1.9 months of inventory in 2024.[5]
- According to New Hampshire Housing, a balanced rental market vacancy rate is approximately 5 percent. The vacancy rate for two-bedroom apartments in New Hampshire was 0.6 percent in data collected during early 2023.[6]
Granite State Renters Face Rising Costs
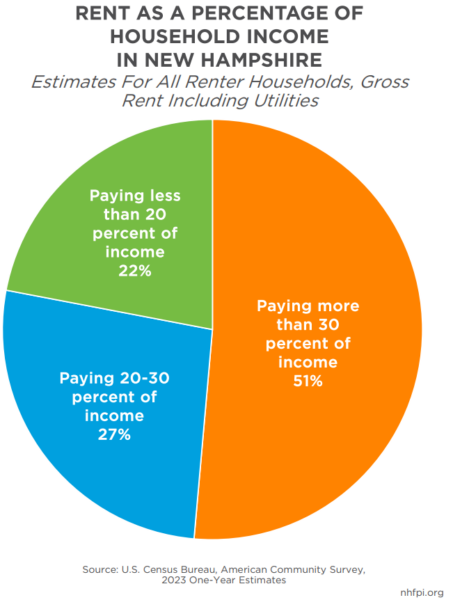
- About 51 percent of New Hampshire renters paid more than 30 percent of their income for housing in 2023.[7]
- The statewide median household income among renters was $53,816 in 2023, slightly less than half the $114,853 homeowner median income.[8]
- Monthly rent for a two-bedroom apartment was $1,833 in early 2024, an annual increase of 3.9 percent. This increase was slightly higher than the average of 3.3 percent overall annual inflation faced by consumers in New England during this period.[9]

Housing Costs Increased Across the State
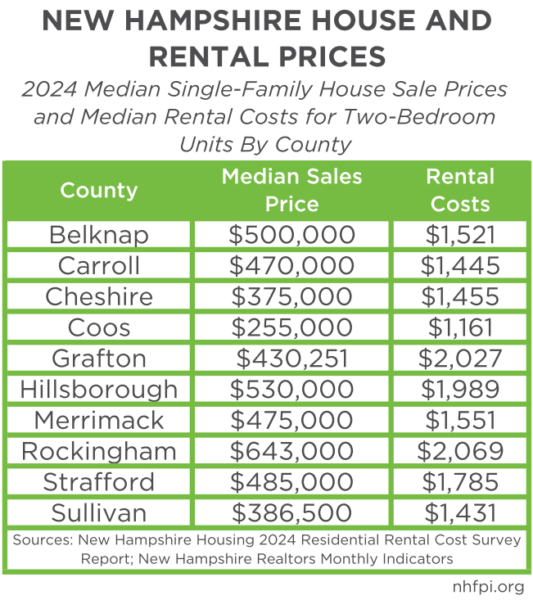
- In 2024, median single-family house sale prices ranged from $255,000 in Coos County to $643,000 in Rockingham County.
- Median single-family house sale prices increased in all counties between 2023 and 2024, ranging from a 1.1 percent increase in Carroll County to 13.2 percent in Sullivan County.[10]
- In 2024, median two-bedroom rental costs ranged from $1,161 in Coos County to $2,069 in Rockingham County.[11]

Homelessness, School Funding, Research
- A case study of four communities found housing constructed between 2014 and 2023 provided local school districts with a net fiscal benefit of $1,711 per unit. Condominium units generated the largest positive fiscal impact, then multifamily rentals and single-family houses.[12]
- Growth in short-term rentals was not related to rental unit cost increases from 2014 to 2021, but may have been associated with a decline in rental vacancy rates.[13]
- The number of Granite Staters experiencing homelessness increased by about 49.5 percent from 2020 to 2024.[14]
[1] See the New Hampshire Association of Realtors Monthly Indicator report from December 2024, page 5, for the most recent peak median single family house sale price from June 2023, and the May 2021 report, page 5, for comparison sale price.
[2] Estimated monthly mortgage costs calculated using Federal Reserve Bank of St. Louis 30-Year Fixed Rate Mortgage Average in United States, New Hampshire Association of Realtors Statewide Single-Family Residential Home Sales 1998-2023 and December 2024 Monthly Indicators Report, and New Hampshire Department of Revenue Administration Annual Reports, and Federal Reserve Bank of Dallas’ Payment Calculator. Note that monthly property tax estimates were calculated using sale prices which are typically higher than house value assessments for tax purposes. Also, estimated monthly mortgage payment assumes 5 percent downpayments and does not include homeowner’s insurance or private mortgage insurance.
[3] Median 2023 monthly household income estimate calculated using the U.S. Census Bureau’s American Community Survey table S1901.
[4] For more information, see the 2023 New Hampshire Statewide Housing Needs Assessment.
[5] See the Texas A&M University’s Real Estate Center’s document for an explanation of a balanced housing market and New Hampshire Association of Realtor’s Monthly Indicators, page 9, for 12-month average of months supply of inventory.
[6] See New Hampshire Housing’s 2023 Residential Rental Cost Survey Report, page 10.
[7] New Hampshire renters cost burdened by housing calculated using the U.S. Census Bureau’s 2023 American Community Survey table DP04.
[8] See the U.S. Census Bureau’s American Community Survey table B25119.
[9] See New Hampshire Housing’s 2024 Residential Rental Cost Survey Report, page 5 and the U.S. Bureau of Labor Statistics Consumer Price Index for New England.
[10] See the New Hampshire Association of Realtors Monthly Indicator report from December 2024, page 15.
[11] See the New Hampshire Housing Finance Authority’s 2024 Residential Rental Cost Survey Report, page 6.
[12] See New Hampshire Housing’s September 2024 report, From Homes to Classrooms.
[13] See New Hampshire Housing’s October 2023 report, Short-Term Rentals in New Hampshire: An Analysis of Data from 2014-2023.
[14] See the New Hampshire Coalition to End Homelessness, 2024 State of Homelessness in NH Report, page 4.
