Due in large measure to the recent national recession and the continuing struggle to recover from it, New Hampshire will face a budget shortfall on the order of several hundred million dollars over the upcoming FY 2012-2013 biennium. The source and size of that deficit should compel state policymakers to use a balanced approach in resolving it, an approach that is not limited simply to reductions in state expenditures, but one that contemplates meaningful changes in the state’s tax system as well.
An Overview of New Hampshire’s Tax System explores some of the recent trends in tax collections in New Hampshire, provides a brief description of each of the state’s eight major sources of tax revenue, and highlights several characteristics of the state’s tax system that can help guide policymakers in devising a response to the fiscal challenges now before New Hampshire.
Introduction
While New Hampshire has fared better economically than many states since the start of the economic downturn in December 2007, it has not been immune to the effects of the national recession and the difficult recovery that is now underway. In fact, like nearly other every state in the union, New Hampshire is expected to face extremely trying fiscal circumstances in the months ahead. Collectively, states have seen tax revenues fall by more than 10 percent in real terms since the start of the recession, the steepest – and potentially longest lasting – such drop in any of the last four economic downturns dating back to the early 1980s.[1] As a result, the fifty states, taken together, are projected to experience budget shortfalls totaling $113 billion in fiscal year (FY) 2012; the gap could ultimately grow to as much as $140 billion.[2] New Hampshire has witnessed sharp tax revenue declines as well, with collections attributable to several key sources, including the interest and dividends tax and the real estate transfer tax, anticipated to shrink by 20 percent or more in real terms between FY 2008 and FY 2011. These declines, in turn, have helped to create a gap between ongoing revenues and expenditures that will likely amount to several hundred million dollars for the upcoming FY 2012-2013 biennium.
In this context, policymakers from the Governor to rank-and-file legislators will, of course, subject current and proposed expenditures to intense scrutiny, assessing whether certain goals can be achieved for less money or whether the state can afford to pursue them at all under current circumstances. Yet, it is also worth examining the other side of the state’s ledger – the manner in which the state generates the revenue needed to finance public services – in order to understand how it may need to be revised to meet the fiscal challenges now before the Granite State. To that end, this report provides an overview of New Hampshire’s current tax system. It first explores some of the recent trends in tax collections in New Hampshire, including shifts in the composition of tax revenue over the last two decades. It then offers a brief description of each of the state’s major sources of tax revenue, such as New Hampshire’s business profits and business enterprise taxes, and closes with a discussion of some of the system’s distinguishing features.
Trends in Tax Revenue Collections and Composition, FY 1990 – FY 2009
In FY 2009, New Hampshire’s three main budgetary funds – the General Fund, the Education Fund, and the Highway Fund – collected a total of $2.47 billion in unrestricted revenue. Of that amount, nearly three-quarters – roughly $1.82 billion – was attributable to the variety of taxes that the state levies, whether on business activity or on property within New Hampshire, on certain types of income earned by Granite State residents, or on purchases ranging from cigarettes to meals in restaurants. The remainder – a sum of about $644 million – arose from other sources, such as the state liquor commission, motor vehicle registration fees, Medicaid enhancement revenues, the state lottery, and tobacco settlement payments New Hampshire and other states receive in accordance with their agreement with cigarette manufacturers.
As Figure 1 demonstrates, both the amount of tax revenue collected and its allocation among the state’s major budgetary funds have changed considerably over the last twenty years. At first glance, the total amount of revenue – as well as the total amount of tax revenue – accruing to the state’s budgetary funds appears to have grown substantially in the last two decades. In FY 1990, total unrestricted revenue was close to $1.2 billion (in inflation-adjusted, constant FY 2009 dollars), while total tax revenue equaled about $866 million. Again, by FY 2009, these amounts had reached $2.47 billion and $1.82 billion respectively, reflecting real average annual growth rates of 3.9 percent and 4.0 percent over this period. However, a sizable fraction of the overall growth in revenue – and in tax revenue more narrowly – over the past twenty years can be attributed to the addition, in response to a series of court decisions, of a separate Education Fund to finance the state’s obligations to provide an adequate public education to the state’s children, effective in FY 2000. Indeed, total revenue and total tax revenue solely within the General Fund grew at much slower rates – by 2.0 percent and 1.5 percent on a real average annual basis – over this two-decade timeframe.
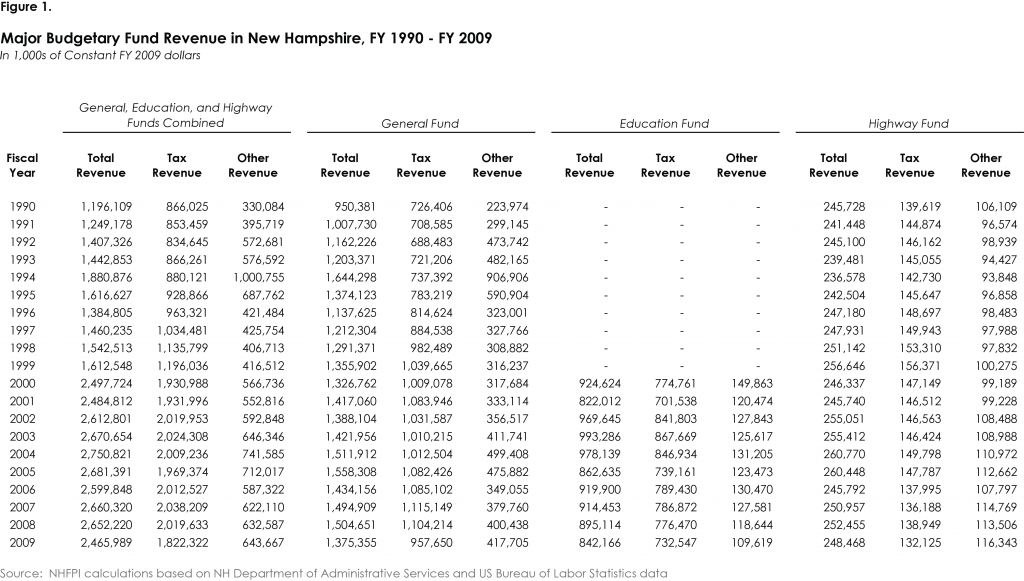
In fact, in the ten years since the advent of the Education Fund, tax revenue has declined in real terms. In FY 2000, after adjusting for inflation, tax revenue within the state’s three principal budgetary funds totaled $1.93 billion, with tax revenue in the General, Education, and Highway Funds individually amounting to $1.0 billion, $774 million, and $147 million respectively. By FY 2009, each of these sums was lower. Total tax revenue fell 0.6 percent per year on average, to $1.82 billion. Taxes within the General and Education Funds declined at a similar pace, to $958 million and $733 million respectively. Taxes within the Highway Fund (namely, the state’s motor fuel taxes) dropped more sharply, by 1.2 percent on a real average annual basis, to $132 million. Needless to say, the recent recession has had some impact on these general trends, but, as will be discussed later in this paper, changes in state tax policy, as well as in the general structure of the state’s tax system, have also played a role.
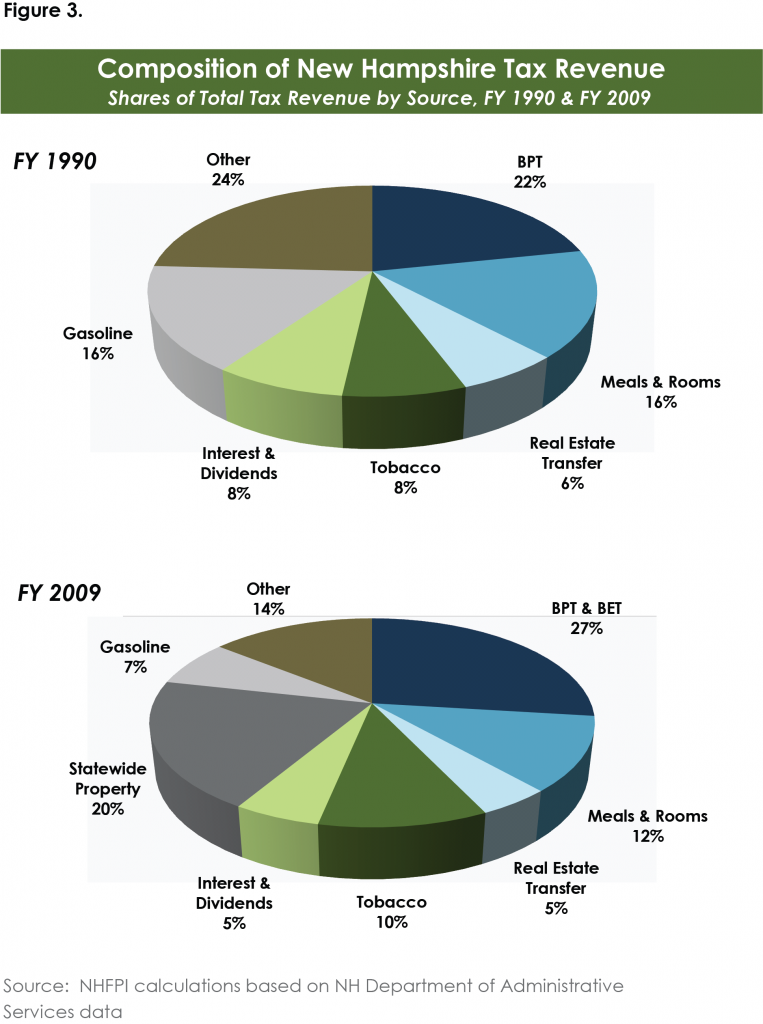
Just as the amount of revenue that New Hampshire’s tax system has yielded has varied over the past twenty years, so too has the composition of that system, as illustrated in Figures 2 and 3. In FY 1990, the state’s business profits tax (BPT) constituted the single largest source of tax revenue, generating some $180 million (in constant FY 2009 dollars) or approximately 22 percent of total tax revenue. Taxes on meals and room rentals and on motor fuel purchases were of nearly identical importance in funding state services in FY 1990, as each produced in the neighborhood of $135 million or about 16 percent of total tax revenue. Taxes on income arising from interest and dividends and on purchases of tobacco products yielded $66 million and $62 million respectively that year, each the equivalent of nearly 8 percent of total tax revenue. Real estate transfer taxes were responsible for $52 million or 6 percent of total tax revenue in FY90, with the remaining $200 million in tax revenue that year arising from such other levies as those on beer, insurance premiums, estates, and utilities.
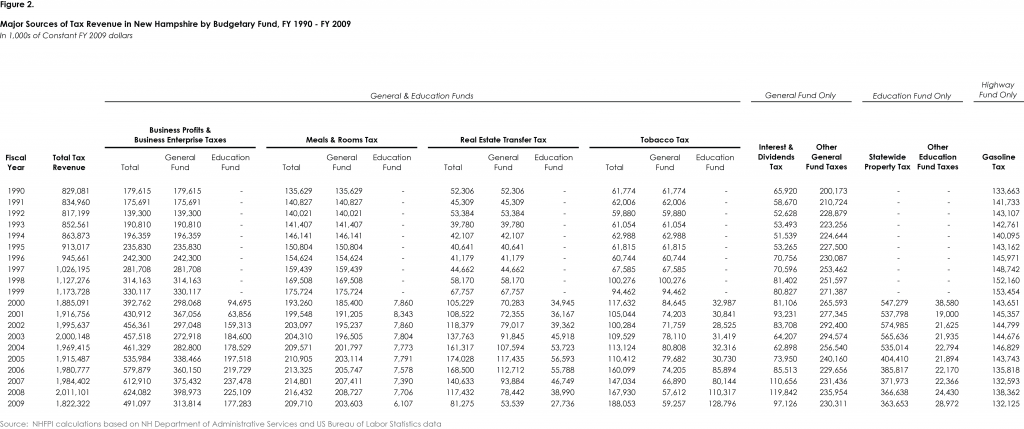
By FY 2009, due in part to the creation of the business enterprise tax (BET) in 1993, as well as rate increases affecting both the BPT and BET in the early 2000s, business taxes had grown, both in terms of revenue output and of prominence within the state’s tax system. Taken together, the BPT and BET accounted for $491 million in tax revenue in FY09 – or roughly 27 out of every 100 tax dollars collected by the state that year. The statewide property tax, instituted along with the Education Fund in 1999, comprised roughly 20 percent of total state tax collections in FY09, generating a statutorily mandated sum of $363 million. Tobacco taxes also comprised a larger share of total tax revenue in FY09 than they had twenty years earlier, making up one out of every ten tax dollars collected – or $188 million all told. Given the additions of the BET and the statewide property tax, as well as the growth in the tobacco tax, several other sources of tax revenue fell in relative importance over the last twenty years, even as the amount of revenue they produced generally climbed in real terms. For instance, though the yields of the meals and rooms tax and of the interest and dividend tax grew to $210 million and $97 million by FY 2009, their shares of total tax revenue declined, to 12 percent and 5 percent, in order. Motor fuel tax revenue dropped slightly in real terms over the last two decades – from $133.7 million to $132.1 million – cutting its share of total tax revenue by more than half. Other sources of tax revenue generated around $260 million in FY 2009 or about 14 percent of the total.
Major Sources of Tax Revenue in New Hampshire
As the preceding section suggests, New Hampshire generally relies upon eight major taxes to produce the bulk of the revenue it collects in its General, Education, and Highway Funds. This section examines each of those taxes.
Business Profits Tax (BPT) and Business Enterprise Tax (BET)
New Hampshire levies two separate taxes on companies doing business in the Granite State. The first, the business profits tax (BPT), has been in place since 1970 and functions much in the same way that corporate income taxes in other states do. That is, any company engaged in a sufficient level of economic activity in New Hampshire – a concept often referred to as nexus – is subject to the business profits tax. To determine the business profits tax owed to New Hampshire, a company, after accounting for relevant exemptions and deductions, uses a formula specified by law to calculate the amount of the income it and all of its affiliates have earned nationwide that is attributable to its New Hampshire operations. (This formula, like those employed in other states, uses the share of a company’s property located in New Hampshire, the share of its total sales that occur in New Hampshire, and the share of its total payroll paid to its New Hampshire workforce to apportion income to New Hampshire for tax purposes. Like most states, New Hampshire gives greater weight to the share of sales that occur in New Hampshire in its particular apportionment formula.) The income apportioned to New Hampshire is then taxed at the current BPT rate of 8.5 percent. Several credits, including the Community Development Finance Authority (CDFA) investment tax credit and the research and development tax credit, can then be used to reduce a company’s final tax bill. Any company with gross receipts in excess of $50,000 is required to file a BPT return.
The second business tax, the business enterprise tax (BET), was instituted in 1993 and, in the view of many observers, operates in a fashion similar to a value-added tax (VAT).[3] In simple terms, a VAT is imposed on the value added to a particular good or service throughout the production process. For example, if a company sells an item for $100, but paid $90 for the materials that went into creating that item, it would pay a tax on the $10 difference under a VAT. In the case of New Hampshire’s BET, that difference – or value added – is known as the “enterprise value base” and is defined in law as the total amount of wages and salaries, interest, and dividends paid by a given company. To determine the BET it owes, a company performs a series of calculations – similar to those outlined above for the BPT – to establish the amount of its enterprise value base subject to taxation. It then multiplies that amount by 0.75 percent, the current tax rate for the BET. Any company with either gross receipts of more than $150,000 or an enterprise value base above $75,000 is required to file a BET return.
Importantly, the business profits tax and the business enterprise tax are designed to work in concert, as companies can use whatever they may owe in business enterprise tax as a credit against their business profits tax liability. For instance, if a company owes $15,000 in BET and $25,000 in BPT, its total tax liability is $25,000, as its BPT bill is reduced to $10,000 by its $15,000 credit for BET paid. However, if the same company did not owe any BPT, it would still owe its full BET liability of $15,000. Consequently, the BET serves as a supplement or a backstop to the BPT, ensuring that all businesses conducting operations in New Hampshire make some contribution to the public services – such as the state’s schools, courts, or roads – from which they benefit in any given year.
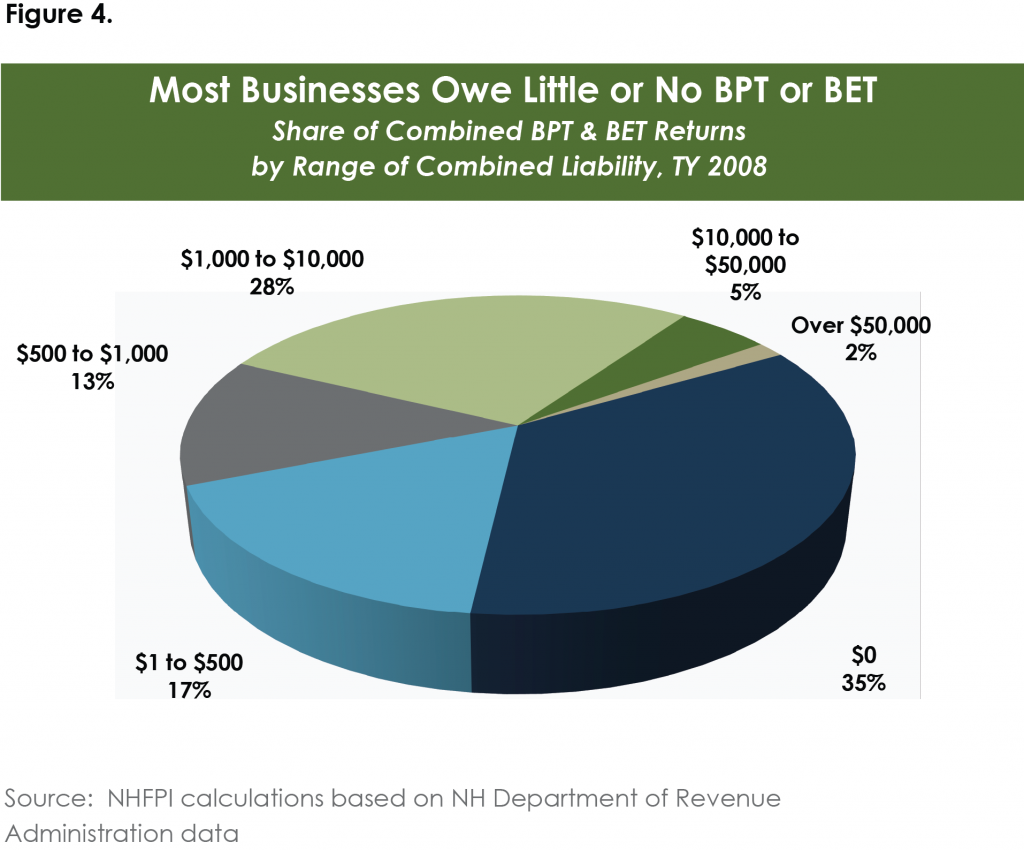
According to preliminary data from the New Hampshire Department of Revenue Administration (DRA), in tax year 2008, nearly 66,900 businesses filed either a BPT return, a BET return, or both, resulting in total tax collections under the two levies of approximately $430 million.[4] Of the total number of combined BPT and BET returns filed in 2008, corporations and proprietorships accounted for roughly equal shares – about 42 percent of returns each – with partnerships comprising almost all of the remaining 16 percent of returns. Despite this rough parity in the number of returns between corporations and proprietorships, corporations paid a much larger share of total BPT/BET collections in 2008, furnishing eight out of every ten dollars arising under those two sources of revenue.
Still, as Figure 4 makes clear, many businesses owe either very little or nothing at all under the BPT or BET. In particular, more than 23,000 BPT/BET returns – or over one third of total returns – showed no business profits or business enterprise tax owed in 2008. Another 11,400 returns – or 17 percent of the total – had combined liabilities of less than $500 that year; returns in this latter category owed an average of $218 between the two taxes. While there are a variety of reasons why a company may not owe tax in a given year – such as the use of various deductions, exemptions, or credits – it is also worth noting that the DRA estimates that as many as 130,000 to 150,000 companies are doing business in New Hampshire at any one time, suggesting that some companies that may be required to file a BPT or BET return – and that may face some liability under one or both of those taxes – are not now doing so.[5]
Revenue arising from business profits and business enterprise taxes flows into both the General Fund and the Education Fund. More specifically, each year, the DRA Commissioner is required to calculate how much revenue was generated, in that year, by the 1.5 percentage point increase in the business profits tax rate from the 7.0 percent rate that was in place prior to 1999 to the 8.5 percent rate that obtains today. The Commissioner is also required to calculate the amount of revenue produced, in that year, by the 0.5 percentage point increase in the business enterprise tax rate from its pre-1999 level of 0.25 percent to its present level of 0.75 percent. Those amounts, in turn, are deposited into the Education Fund, with all remaining revenue from these two taxes accruing to the General Fund. As a result, between 35 and 40 percent of the revenue collected from these two levies has gone to the Education Fund in recent years.
Interest and Dividends Tax
Though New Hampshire does not impose a comprehensive individual income tax, as is the practice in the vast majority of states, it does levy a tax on two specific forms of income: the interest and dividends generated from stocks, bonds, bank accounts, and other investments. (The interest on US Government bonds, as well as those issued by the state of New Hampshire and any of its subsidiary governments is excluded from taxation.) Any New Hampshire resident, as well as any taxpayer who lived in the state for a portion of the year, who receives such income is subject to the tax at its current rate of 5 percent. For single taxpayers, the first $2,400 of interest and dividend income is exempt from taxation; for married couples filing jointly, the first $4,800 is exempt. Elderly, disabled, and blind taxpayers may claim an additional exemption of $1,200.
Close to 75,000 interest and dividend tax returns were filed in tax year 2008 according to DRA preliminary data. The vast majority of those returns – about 64,500 – were submitted by individuals, as opposed to partnerships or fiduciaries. By comparison, data from the US Internal Revenue Service show that roughly 669,000 New Hampshire residents filed federal income tax returns that same year, suggesting that only a very small fraction of Granite Staters end up owing the interest and dividends tax in any given year. Moreover, of those taxpayers who did file an interest and dividend return, most owed a relatively low level of tax to the state. The same DRA data for 2008 reveal that 63 percent of interest and dividend filers had a liability of less than $500 in 2008. In fact, of the more than 47,000 filers that fell into this category, the average tax owed was $147.
Though the interest and dividends tax has existed in one form or another since 1923, it has seen relatively few changes in recent years. The tax has employed the same, basic 5 percent rate since FY 1977 and the prior rate of 4.25 percent had been in place since the mid-1950s.[6] The last significant and permanent change to the tax was made in June 1995, when long-standing exemptions for interest from New Hampshire- and Vermont-based banks were eliminated and the general exemptions for single and married taxpayers were doubled, thus bringing them to their present levels. In 2009, in a change that was expected to generate some $15 million in additional revenue each year, New Hampshire did expand the types of income subject to the tax to include distributions from limited liability companies (LLCs) and partnerships, just as distributions from corporations are currently subject to taxation as dividend income. That change proved only temporary, however, as legislation enacted in June of this year repealed the change effective January 1, 2010.
Finally, as Figure 2 indicates, all of the revenue produced by the interest and dividends tax flows into New Hampshire’s General Fund.
Meals and Rooms Tax
While New Hampshire does not levy a general tax on the sales and use of goods or services, it does impose a variety of taxes on certain types of purchases. One such tax is the meals and rooms tax, which applies to the purchase price of meals served in restaurants and other similar establishments, to the cost of hotel, motel, and other room rentals, and to the cost of car rentals.
The rate for the meals and rooms tax presently stands at 9 percent. The rate had been 8 percent since 1990, but to help close the expected gap in the FY 2010-2011 budget, the Legislature adopted, and Governor John Lynch approved, an increase in the rate effective July 2009, a move that was anticipated to bring in more than $25 million per year. At the same time, the Legislature also modified the definition of what constituted a room rental subject to tax to include the rental of campsites. However, like the attempted expansion of the interest and dividends tax, the inclusion of campsites in the base of the meals and rooms tax was short-lived; the Legislature and the Governor approved its repeal in May 2010, meaning that, going forward, the state will not collect the roughly $4.5 million in annual revenue the change in definition was projected to produce.
As Figure 2 indicates, by far, most of the revenue collected under the meals and rooms tax – approximately 96 to 97 percent in any given year – is deposited in the General Fund. The roughly $6 to $7 million generated each year from the taxation of rental cars is allocated to the Education Fund. In addition, under law, a set amount of the meals and rooms tax collections deposited in the General Fund is meant to be returned to cities and towns each year; such funds are allocated in proportion to each municipality’s share of the state’s population. In FY 2009, $58.8 million in meals and rooms taxes were distributed to cities and towns; changes in law enacted in 2009 limit the distributions for FY 2010 and FY 2011 to no more than that amount.[7]
Tobacco Tax
One other set of purchases subject to taxation in New Hampshire is the purchase of tobacco products, including not only cigarettes, but also cigars, loose tobacco, and smokeless tobacco. Under current law, the tax rate on cigarettes is $1.78 per pack of 20 cigarettes, while the rate on other tobacco products is equal to 65.03 percent of their wholesale sales price. Cigarette taxation generates virtually all the revenue collected under the tobacco tax; in fact, preliminary data from the Department of Revenue Administration suggest that it will account for more than 96 percent of total tobacco tax revenue in FY 2010.[8]
Of the major taxes levied by the state, the cigarette tax has experienced the most numerous changes in its rate over the last two decades. In 1990, the cigarette tax rate was 25 cents per pack. Since then, New Hampshire has enacted half a dozen rate increases, including legislation, passed in 2009 to help finance the FY 2010-2011 budget, that brought the rate from $1.33 to $1.78 per pack.
While such frequent changes may point to the political palatability of sin taxes relative to other approaches for generating the funds needed to finance public services, they reveal as well one of the shortcomings that all excise taxes share. An excise tax, like the cigarette tax, the gasoline tax, or the beer tax, is a tax imposed on a particular commodity on a per unit basis, rather than as a percentage of the commodity’s price (as general sales taxes typically operate). As the Institute on Taxation and Economic Policy has observed, “The per-unit base of excise taxes means that these taxes inherently grow more slowly than the economy. Excise tax revenue grows only when the volume of the commodity sold grows, and does not respond to changes in prices.” Consequently, “states must continually raise the rates of excise taxes just to keep revenues up with inflation.”[9] Indeed, had New Hampshire policymakers kept the 1990 cigarette tax rate of 25 cents per pack in place over the last twenty years, the state likely would have collected only about $40 million in tobacco tax revenue in FY 2009, more than $150 million below the actual level of collections that year and approximately $20 million below the inflation-adjusted level of collections for FY 1990. In other words, over the past two decades, some changes in New Hampshire’s cigarette tax would have had to have been made in order for it to produce a reliable stream of revenue that preserved its real purchasing power over time. The same will remain true into the future: even if the number of packs of cigarettes sold in New Hampshire holds steady, additional rate increases will be required if the tax is to maintain its real value.
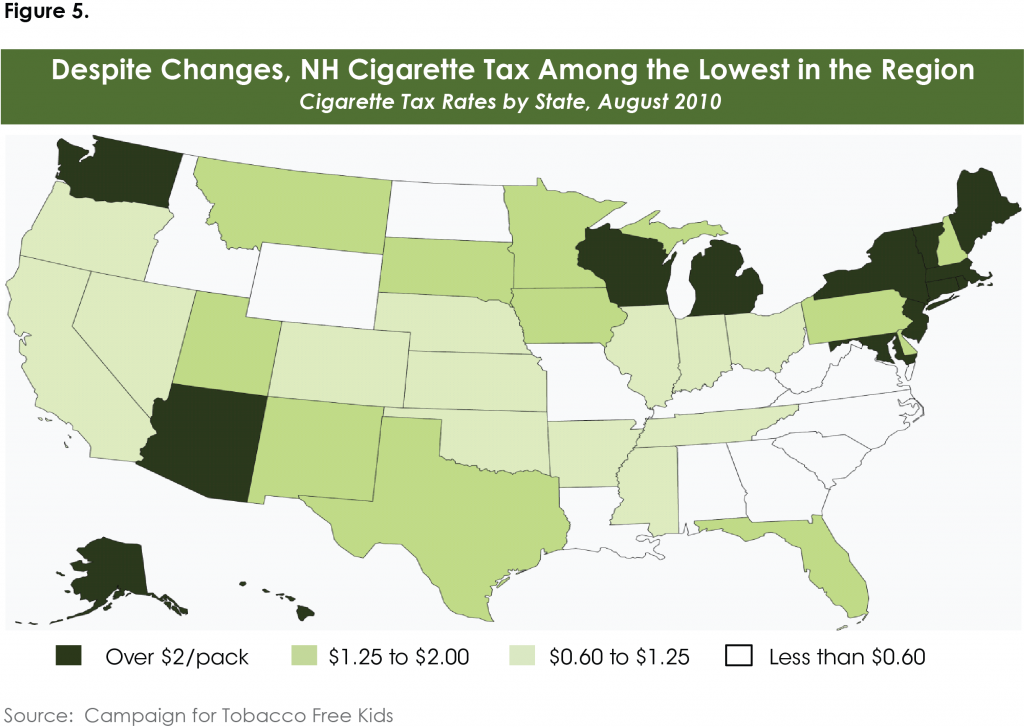
Despite the multiple increases in New Hampshire’s cigarette tax rate in recent years, the rate remains among the lowest in the northeast, as Figure 5 illustrates. Overall, New Hampshire’s current rate of $1.78 per pack ranks sixteenth highest out of the fifty states and the District of Columbia.[10] Each of the states with higher rankings than New Hampshire – including all five of the other New England states – have cigarette tax rates of $2 per pack or higher. Pennsylvania and Delaware – both of which impose, as of August 2010, a rate of $1.60 per pack – are the only northeastern states with lower cigarette tax rates than New Hampshire.
The revenue generated by New Hampshire’s tobacco tax is split between the General Fund and the Education Fund. More specifically, beginning in 1999, any revenue attributable to the portion of the cigarette tax rate over $1 per pack is deposited in the Education Fund. As a result of this requirement, the General Fund received roughly 32 percent of tobacco tax revenue in FY 2009, while the Education Fund garnered the remaining 68 percent. Naturally, in the absence of additional changes in law, any future cigarette tax increases would tip this balance further in favor of the Education Fund.
Real Estate Transfer Tax
New Hampshire imposes a tax on the sale of all real estate within the state’s boundaries, whether the sale of land, residences, or commercial properties. The tax is assessed at a rate of 75 cents per $100 of the sale price and is imposed on both the buyer and the seller of the property. For instance, if a home were sold for $200,000, $3,000 in tax is due, $1,500 of which is paid by the buyer of the home and $1,500 by the seller. Over the past twenty years, the rate has changed three times: in April 1990, when it was raised from 47.5 cents to 52.5 cents per $100; in July 1993, when it was lowered to 50 cents per $100; and in July 1999, when it was increased to 75 cents per $100 of sales price.
Given the base on which it is imposed, revenue from the real estate transfer tax can fluctuate significantly over time, as Figure 6 suggests. At the start of the millennium, New Hampshire real estate transfer tax revenue was approximately $105 million (in constant FY 2009 dollars). It then climbed roughly 65 percent to its FY 2005 peak of $174 million, before plunging 53 percent to its FY 2009 level of $81 million. This swing roughly coincides with trends in the median value of single-family residential home sales as well as in the number of such sales, as seen in Figure 6. While residential trends do not tell the complete story – since commercial and other property are also subject to taxation – they nonetheless help to illustrate how the real estate transfer tax can be affected by market forces.
New Hampshire law stipulates that any revenue arising from the portion of the real estate transfer tax rate above 50 cents per $100 of value must be deposited in the Education Fund. Accordingly, roughly one-third of the real estate transfer tax revenue the state collects each year is used to finance education aid.
![]()
Education property tax
Since 1999, New Hampshire has imposed a statewide property tax for the purposes of supporting local education expenditures. Present law requires that cities and towns collectively generate $363 million each year under this tax. By December 15 of each year, the DRA Commissioner must inform each municipality of the amount of property tax revenue it is required to raise to help meet that total. The amount each municipality is mandated to produce, in turn, is based upon the amount of total equalized property value, adjusted for the purposes of the education tax, within its boundaries. For the tax year beginning April 1, 2009, DRA calculated that a uniform statewide property tax rate of $2.135 per $1,000 of equalized value would be sufficient to yield the mandated sum of $363 million. In practice, however, that rate varied from jurisdiction to jurisdiction; for instance, data from DRA’s Municipal Services Division indicate that, for tax year 2009, it fell below $2.00 in Randolph and Sugar Hill but exceeded $2.50 in Tilton and Plaistow.
Individuals with incomes below $20,000 and married couples with incomes below $40,000 may apply, under New Hampshire’s Low and Moderate Income Homeowners Property Tax Relief Program, for a rebate of some or all of the statewide education property tax they owe. The precise amount of the rebate varies depending on one’s income, the value of one’s home, and the city or town in which one lives, but, according to the Department of Revenue, it distributed a total of $3.1 million in rebates in 2009 – or an average of $120 per household.[11]
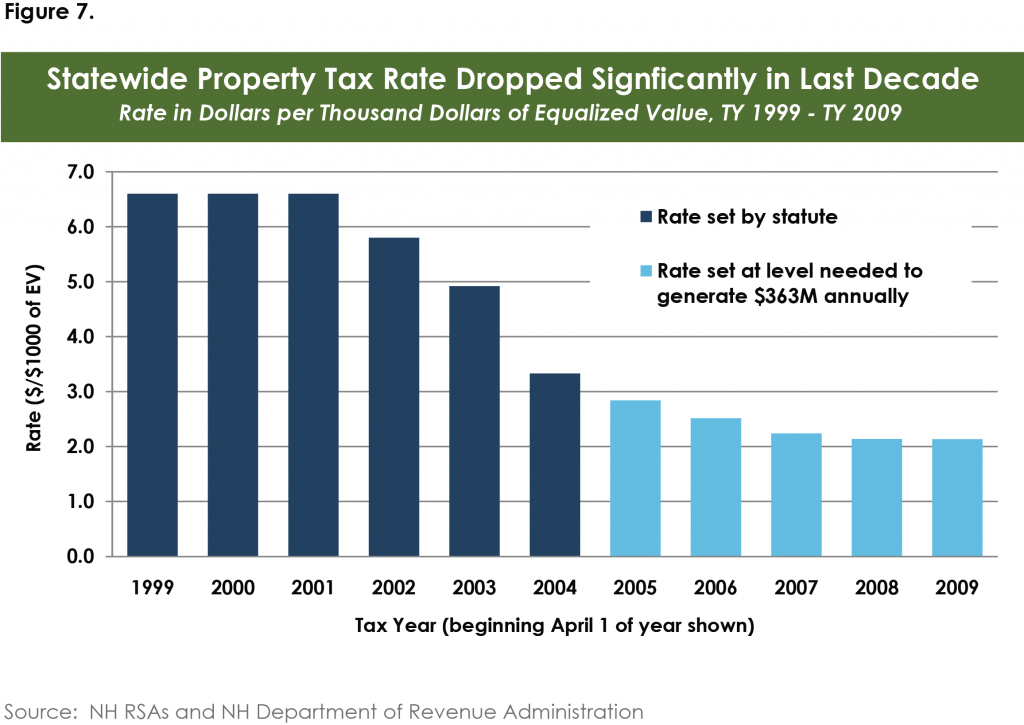
As Figure 7 indicates, New Hampshire’s approach to generating revenue under the education property tax has changed on multiple occasions since its inception. When the tax was first enacted, the uniform statewide property tax rate was set in statute – at $6.60 per $1,000 of equalized value. Subsequent changes in law lowered that uniform rate – to $5.80 in 2002, to $4.92 in 2003, and to $3.33 per $1,000 of equalized value in 2004 – until, effective for 2005, the law was amended to specify the amount to be raised, rather than the rate to be used. Taken in combination with the general growth in property values up until the economic downturn, this meant that the effective uniform rate continued to fall each year between 2005 and 2009.
Finally, it is important to note that, while the statewide property tax is imposed by state statute – and the resulting revenue is typically recorded as a deposit into the state’s Education Fund – the tax is collected and, at least through the end of the current fiscal year, retained in its entirety by each municipality for the purposes of meeting its obligations to provide a constitutionally-adequate education to local schoolchildren. Changes in law adopted in 2008 and scheduled to take effect in July 2011 would change this practice, such that cities and towns that generate more in statewide property tax revenue than is needed to meet their own education adequacy obligations would be required to transmit the excess to the state for distribution to other cities and towns. However, whether those changes will be allowed to take effect as intended is now subject to considerable public debate.[12]
Motor Fuels Tax
Under current law, motor fuel purchases in New Hampshire (including gasoline, diesel, and biodiesel) are subject to a tax of 18 cents per gallon.[13]
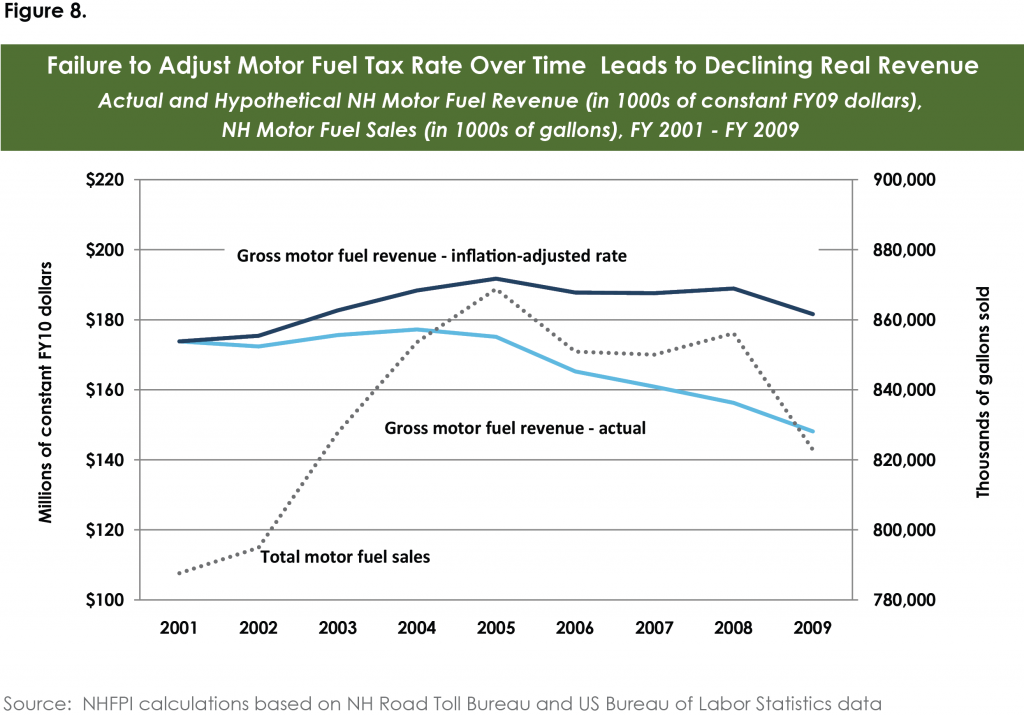
In the past two decades, the motor fuel tax rate has changed just once, rising from 16 cents per gallon to 18 cents in 1991. As a result, New Hampshire’s experience with its motor fuel tax demonstrates quite clearly the inability of excise taxes, in the absence of regular rate adjustments, to keep pace with inflation, as discussed earlier. As seen in Figure 8, the total number of gallons of motor fuel sold in New Hampshire rose from 788 million in FY 2001 to 823 million in FY 2009. Yet, despite this more than 4 percent increase in the volume of fuel sold, the gross value of motor fuel tax collections declined by close to 15 percent after adjusting for inflation, dropping from $174 million in FY 2001 to $148 million in FY 2009. Had the rate been indexed to inflation over this period – so that it would have reached 22 cents per gallon in FY 2009 – New Hampshire’s gross motor fuel tax collections would have reached approximately $181 million in FY 2009. That is roughly $33 million more than under current law. Of course, had the rate been continuously adjusted for inflation since its last permanent increase in 1991, thus bringing it to roughly 29 cents, gross collections would have been higher still – about $237 million.
All of the revenue produced by New Hampshire’s motor fuel tax is directed into the Highway Fund.
Distinguishing Features of the New Hampshire Tax System
While each of the major taxes levied by the state of New Hampshire may have their own strengths and weaknesses, features that ought to be preserved and shortcomings that ought to be mitigated, it is also worth considering how they function together as a system. As the remainder of this section details, New Hampshire’s tax system differs from those in most states, both in the approach it employs and in the level of revenue it produces. Moreover, taken as a whole, New Hampshire’s tax system fails to meet at least two critical criteria for evaluating state tax systems – it neither generates revenue in an equitable manner nor does it yield an amount of revenue adequate for maintaining essential public services.
New Hampshire lacks a broad-based income or sales tax.
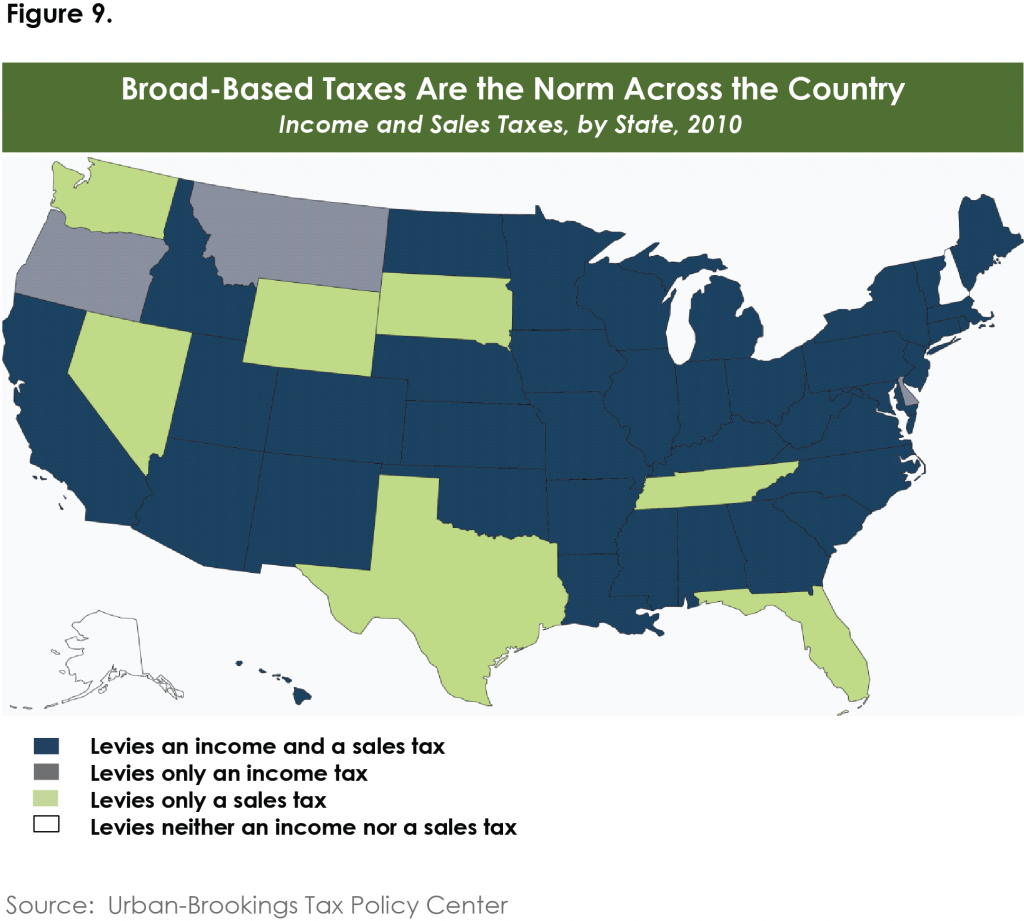
Virtually anyone who has ever come into contact with New Hampshire and its tax system – whether a long-time resident or a first-time visitor, whether a seasoned elected official or a new voter – is aware of perhaps the single most defining characteristic of that system: the absence of either a broad-based income or sales tax. As Figure 9 makes clear, such taxes are the norm across the country. Forty-one states levy a comprehensive income tax and forty-five states impose a tax on the sale and use of most tangible goods. Furthermore, nearly all of the states that fail to employ one of these taxes look to the other as a major source of revenue. Florida, Tennessee, Texas, South Dakota, Nevada, Washington, and Wyoming, none of which impose a broad-based income tax, all impose a general sales tax at the state (and, in some instances, local) level, with combined rates that can exceed 9 percent in some jurisdictions.[14] Conversely, Oregon and Delaware have no general sales tax, but do have income taxes that produce substantial sums of revenue. Only Alaska, which depends heavily on revenues arising from its oil reserves, shares with New Hampshire the distinction of lacking both a statewide income and a statewide sales tax.
While this feature of New Hampshire’s tax system is quite well known, it is worth mentioning here since it helps to shape many of the system’s other features. For instance, as noted earlier, the combination of the business profits and business enterprise taxes, as well as tobacco and meals and rooms taxes, all make up a significant share of total tax revenue in New Hampshire; the state would not be as dependent on these particular revenue sources if it elected to employ either a sales or an income tax. In turn, as will be discussed below, the composition of New Hampshire’s tax system helps to determine the manner in which taxes vary across income groups.
Taxes in New Hampshire are substantially lower than in most states – and have been for some time.
Due in part to the absence of either a comprehensive income tax or a general sales tax, New Hampshire has long had one of the lowest levels of taxation among the fifty states and the District of Columbia. To make such an assessment, fiscal analysts often examine total state and local taxes in a particular state relative to total personal income in that state. They do so for two reasons. First, responsibility for taxation by different levels of government varies greatly across the country. As a result, it is necessary to combine state and local taxes when making comparisons among states; focusing solely on state taxes or strictly upon local taxes would distort those comparisons. Second, state personal income, a statistic published by the United States Bureau of Economic Analysis, is a common proxy for the economic capacity of a given state; as the New England Public Policy Center has observed, state personal income is better suited than other measures for assessments of tax levels, since it “best reflects state residents’ ability to pay for state and local government and their resulting tax burden.”[15]
In New Hampshire, total state and local taxes equaled 8.7 percent of personal income in FY 2008, the most recent year for which such data are available for all fifty states. By comparison, total state and local taxes for the country as a whole amounted to 10.9 percent of personal income, a difference of more than two percentage points. More to the point, by this measure, New Hampshire had the next to lowest level of taxation in the country in FY 2008, ranking 50th out of the fifty states and the District of Columbia. Only South Dakota – where state and local taxes were 8.1 percent of personal income – had a lower level of taxation, in the aggregate, that year.
As Figure 10 suggests, the difference in aggregate levels of taxation between New Hampshire and the United States as a whole has persisted for some time. Indeed, with the exception of the mid-1990s, the difference in state and local taxes between New Hampshire and the country overall has been on the order of two percent of personal income for the past three decades. Over the same period of time, only twice – again, in the mid-1990s – did the level of taxation in New Hampshire rise to the point where the state was not among the ten lowest states in the nation.
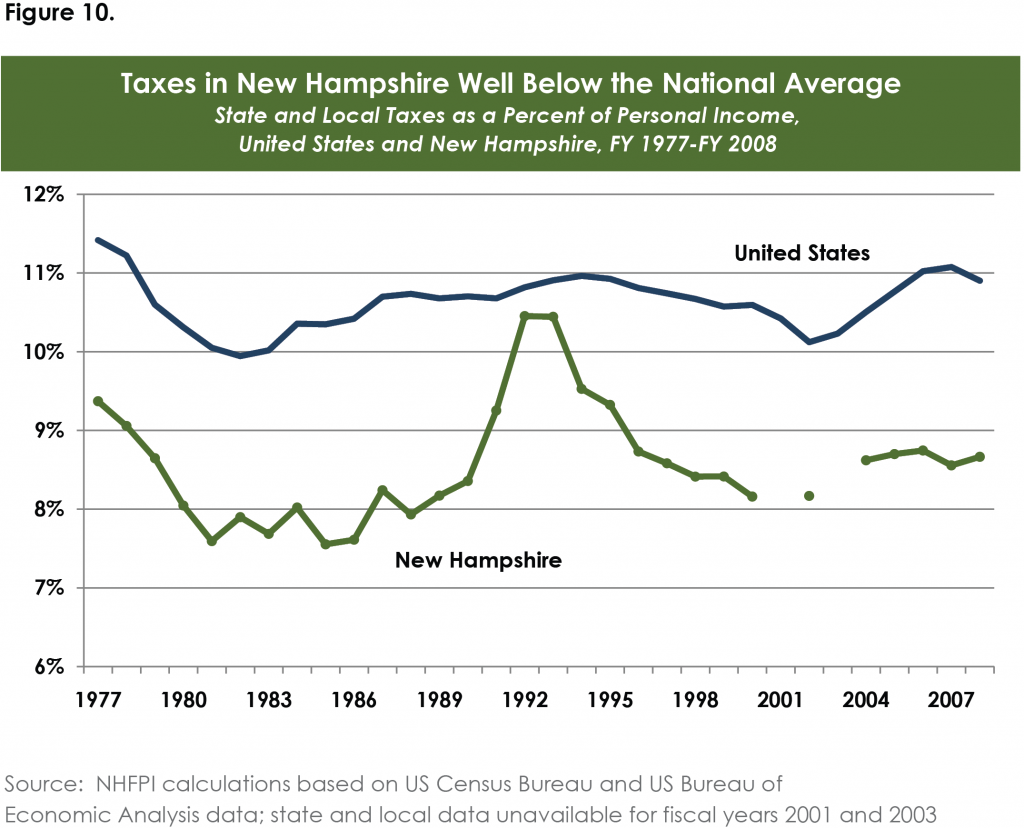
Two percent of personal income may not seem to be a significant gap, but, as personal income amounts to more than $50 billion per year, it can have meaningful consequences for financing state and local government. For example, as noted above, in FY 2008, total state and local taxes were 8.7 percent of personal income in New Hampshire and 10.9 percent nationally. For New Hampshire simply to bring its aggregate level of taxation to the national average of 10.9 percent of personal income, the state, in conjunction with local taxing jurisdictions, would have had to have increased revenue by nearly $1.3 billion over what was actually collected – a sum that almost matches the whole of the state’s General Fund. In other words, New Hampshire’s relative standing among the states seems unlikely to change significantly, even if the state were to adopt modest tax increases as part of a balanced approach to addressing its ongoing fiscal crisis, rather than relying solely on cuts in services.
New Hampshire’s tax system is regressive.
While taxes in New Hampshire, in the aggregate, are quite low, it is not necessarily the case that every taxpayer in New Hampshire faces the same low level of taxation relative to his or her ability to pay, as reflected in his or her total income. Rather, taxes in New Hampshire, as is the case in nearly every state in the country, vary substantially across income levels.
Economists, academics, and other analysts typically use one of three terms to characterize the relationship between tax systems and income levels. A progressive tax system is one in which the share of income an individual or family must devote to paying taxes generally increases as one’s income rises. A proportional tax system is one in which all taxpayers devote the same share of income to paying taxes, regardless of how poor or rich they may be. A regressive tax system is one in which the share of income an individual or family must devote to paying taxes generally falls as one’s income grows.
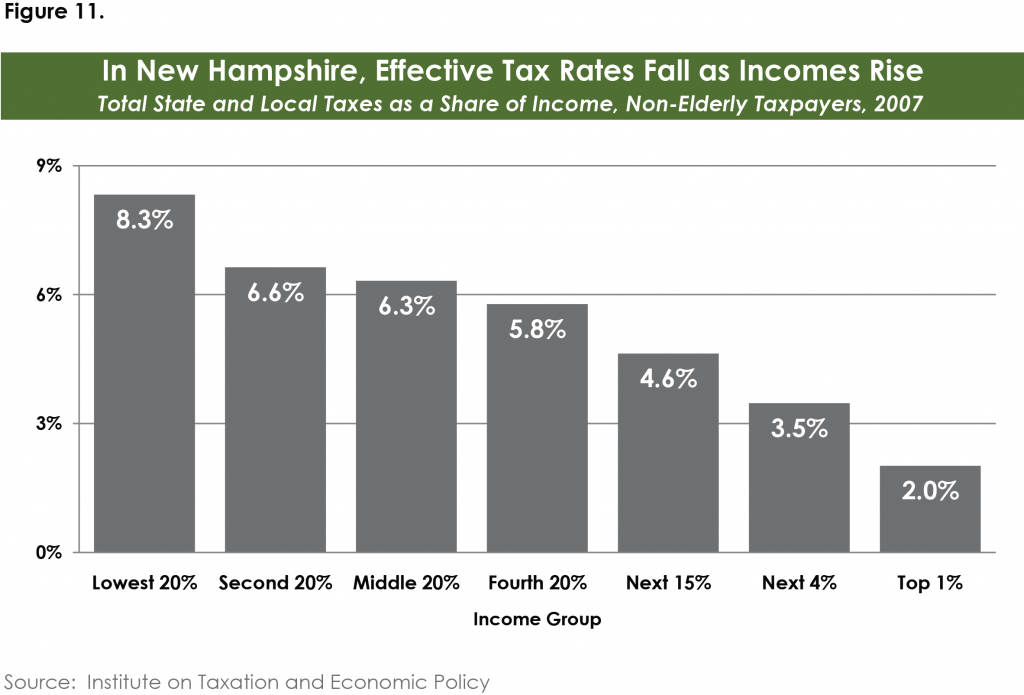
As Figure 11 illustrates, New Hampshire’s tax system is clearly regressive. It requires low- and moderate-income individuals and families to dedicate much larger shares of their incomes to meeting their tax responsibilities than it demands of upper-income taxpayers.[16] More specifically, it shows that, in 2007, the individuals and families that comprised the poorest fifth of taxpayers in New Hampshire, on average, paid 8.3 percent of their incomes in state and local taxes. In other words, these taxpayers –whose average income was $14,100 in 2007 – faced an effective state and local tax rate of 8.3 percent. Meanwhile, taxpayers in the middle of the income distribution – individuals and families with incomes ranging from $40,000 to $65,000 – paid a somewhat smaller share of their incomes – 6.3 percent – in taxes that same year. In stark contrast, the most well-off Granite Staters – those that constituted the very richest 1 percent of taxpayers – experienced an effective tax rate of just 2.0 percent on average. Taxpayers in this category had an average income of close to $1.65 million in 2007. In short, at a time when poverty is on the rise in New Hampshire and when the typical New Hampshire household has seen its income decline in real terms, New Hampshire’s tax system impairs working families’ ability to make ends meet.
The inequitable distribution of taxes in New Hampshire arises both from the mix of taxes levied in the state and the specific structure of those taxes. For instance, there is fairly broad consensus that tobacco taxes are among the most regressive forms of taxation that state governments can employ, as consumption taxes generally fall more heavily on low- and moderate-income taxpayers, while tobacco use tends to be more prevalent among the poor.[17] Yet, as noted earlier, tobacco taxes constitute a significant portion of state General Fund revenue in New Hampshire. As a result, New Hampshire’s tax system is more regressive than it would be if tobacco taxes held a less prominent place in funding state services. Similarly, while property taxes obviously play an important role in New Hampshire, the manner in which they are designed may exacerbate the regressive nature of the state’s tax system. That is, many states offer a basic exemption – often referred to as a homestead exemption – that shields a certain amount of a home’s value from taxation; while all homeowners may receive the exemption, it is usually more meaningful to low- and moderate-income taxpayers, as that amount represents a larger share of their homes’ values or reduces their taxes more relative to their total incomes. New Hampshire uses this property tax relief mechanism in only a limited fashion, permitting exemptions only for specific categories of homeowners, such as veterans, the elderly, or blind, deaf, or disabled residents.[18] Again, then, the state’s tax system is more regressive than it would be if the state had a robust homestead exemption in place.
New Hampshire’s tax system has grown at a relatively slow pace in recent years.
State expenditures – even if only to maintain the same level of services from one year to the next – typically grow over time. They do so not only because of burgeoning state populations generally or expanding caseloads in particular, but also because of rising costs, as the price of the goods government must purchase, from heat for schoolrooms, to asphalt for paving projects, to prescription medicines, climb from one year to the next. State revenues, therefore, must grow along with them. The failure to match the natural growth in state expenditures with growth in state revenues will invariably lead to a structural budget deficit. This condition has long prevailed in New Hampshire. Indeed, a February 1992 study by KPMG Peat Marwick found that:
New Hampshire can be characterized as having a long-term structural deficit in the sense that for a given scope of programs and revenue system, expenditures grow automatically faster than revenues.[19]
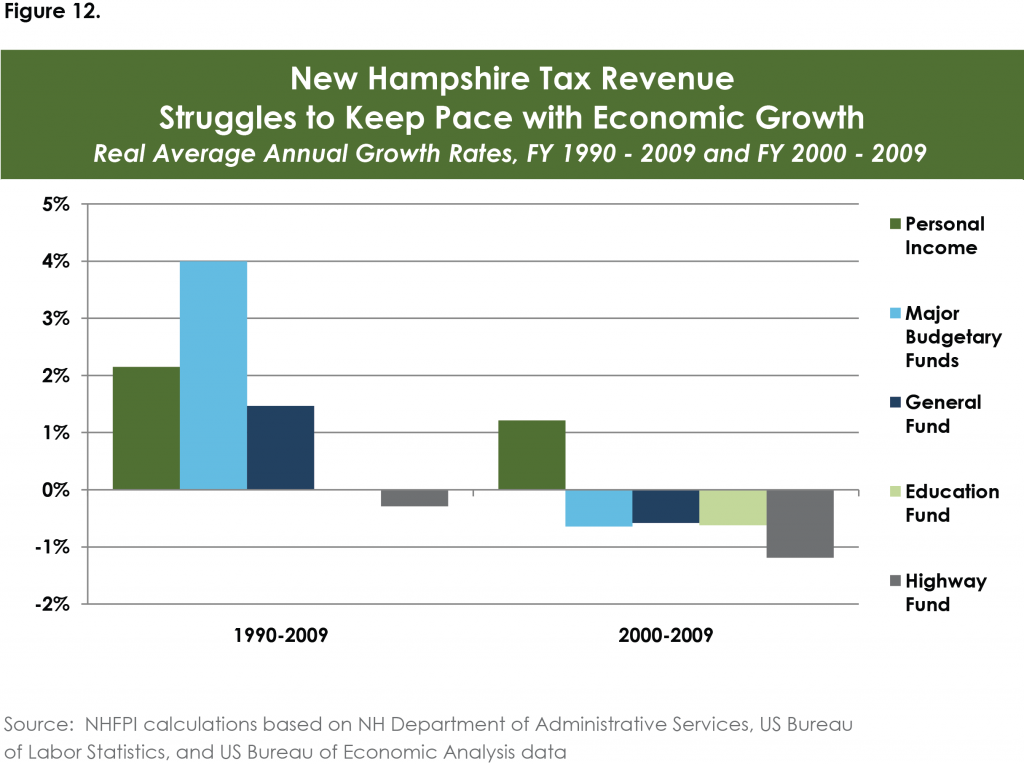
One way in which states can forestall the emergence of structural deficits is to ensure that their tax systems produce a stream of revenue that grows along with the state’s economy. Yet, in recent years, New Hampshire’s tax system has struggled to meet that standard. As noted earlier, one common measure of the size of a state’s economy is state personal income. In New Hampshire, state personal income, after adjusting for inflation, has grown by 2.1 percent per year on average over the period from FY 1990 to FY 2009. As Figure 12 shows, the total amount of tax revenue collected by the state’s three major budgetary funds has grown more quickly than personal income over that time frame, but only because of the addition of the Education Fund in the middle of that period, rather than due to underlying growth in the state’s tax system. In fact, tax revenue growth within individual budgetary funds has been considerably slower than personal income growth; as Figure 12 demonstrates, tax revenue within the General Fund grew at a real average annual rate of 1.5 percent between FY 1990 and FY 2009, while tax revenue within the Highway Fund declined at a pace of 0.3 percent per year in real terms over the same stretch.
Since FY 2000, personal income in New Hampshire has climbed by just 1.2 percent per year on average. Yet, tax revenue within the General Fund and the Education Fund, as well as within all three major budgetary fund taken together, has declined by about 0.6 percent on an average annual basis, while motor fuel tax revenue within the Highway Fund has dropped as quickly as incomes have grown – 1.2 percent per year on average.
Conclusion
Due in large measure to the recent national recession and the continuing struggle to recover from it, New Hampshire will face a budget shortfall on the order of several hundred million dollars over the upcoming FY 2012-2013 biennium. The source and size of that deficit should compel state policymakers to use a balanced approach in resolving it, an approach that is not limited simply to reductions in state expenditures, but one that contemplates meaningful changes in the state’s tax system as well.
To that end, this report offers some insight into the manner in which New Hampshire currently generates revenue for vital public services. It highlights several characteristics that can help guide policymakers in devising a response to the fiscal challenges now before New Hampshire. Given the state’s comparatively low level of taxation, policymakers should be aware that generating additional revenue will not significantly alter New Hampshire’s relative standing among the states. Further, given the inequitable distribution of taxes now in place, policymakers should give greater priority to revenue options – such as the expansion of the interest and dividends tax to include capital gains or the reinstatement of some form of an estate tax – that ask more of affluent residents. Finally, given the relatively slow pace at which the state’s tax system has grown in recent years – as well as long-standing concerns about the state’s structural deficit — policymakers should look to methods for ensuring that the tax system will grow more in line with expenditures and with the economy generally.
Endnotes
[1] McNichol, Elizabeth, “Another Tough Budget Year for States — and Next Year Looks No Better,” off the charts, October, 7, 2010, available at http://www.offthechartsblog.org/another-tough-budget-year-for-states-%E2%80%94-and-next-year-looks-no-better/.
[2] McNichol, Elizabeth, Oliff, Phil, and Johnson, Nicholas, States Continue to Feel Recession’s Impact, Center on Budget and Policy Priorities, December 9, 2010.
[3] See, for instance, Kenyon, Daphne A., “A New State VAT? Lessons from New Hampshire,” National Tax Journal, September 1996, p. 381 or Arnold, Stan and Ardinger, William F.J., “Top Ten Reasons Why New Hampshire’s BET May Provide An Answer to State Tax Reform,” State Tax Notes, November 29, 2004, p. 583.
[4] New Hampshire Department of Revenue Administration, Presentation to Commission to Study Business Taxes, October 22, 2010, p. 18-19, available at http://www.gencourt.state.nh.us/StatStudComm/committees/2027/DOI/DRA-Presentation%20to%20Comm%20to%20Study%20BT%20102210.pdf
[5] Ibid., p. 27
[6] Information on interest and dividend tax rate changes, as well as rate changes for other taxes discussed in this report, is taken from Office of Legislative Budget Assistant, Introduction to New Hampshire Taxes, January 27, 2009.
[7] State of New Hampshire, Information Statement, July 14, 2010, p. 14.
[8] Email communication with John Lighthall, Department of Revenue Administration, October 21, 2010.
[9] The ITEP Guide to Fair State and Local Taxes, Institute on Taxation and Economic Policy, February 2005, p. 19.
[10] Lindblom, Eric, State Cigarette Excise Tax Rates and Rankings, Campaign for Tobacco-Free Kids, August 3, 2010, available at http://www.tobaccofreekids.org/research/factsheets/pdf/0097.pdf.
[11] Press Release, NH Department of Revenue Administration, April 27, 2010, available at http://www.nh.gov/revenue/publications/pr/documents/2010LM042710.pdf.
[12] Ireland, Doug, “NH lawmakers to tackle education funding,” The Eagle-Tribune, November 14, 2010, available at http://www.eagletribune.com/latestnews/x967714405/NH-lawmakers-to-tackle-education-funding.
[13] Aviation fuel is also subject to taxation, but is not included in this discussion.
[14] Tax Policy Center, Comparison of State and Local Retail Sales Taxes, 2010, March 3, 2010, available at http://www.taxpolicycenter.org/taxfacts/Content/PDF/state_local_sales_tax.pdf.
[15] Nagowski, Matthew P., Memorandum to David Emer, New England Public Policy Center, Federal Reserve Bank of Boston, July 13, 2006, p. 2.
[16] Davis, Carl, et. al., Who Pays? A Distributional Analysis of the Taxpayers in All 50 States, Institute on Taxation and Economic Policy (ITEP), December 2009, p. 74. Given the disparate treatment of elderly taxpayers among the states, ITEP’s incidence analysis includes non-elderly taxpayers only.
[17] Centers for Disease Control and Prevention, “Cigarette Smoking Among Adults — United States, 2002,” Morbidity and Mortality Weekly Report, May 28, 2004, available at http://www.cdc.gov/mmwr/preview/mmwrhtml/mm5320a2.htm; Goszkowski, Rob, “Among Americans, Smoking Decreases as Income Increases,” Gallup, March 21, 2008, available at http://www.gallup.com/poll/105550/among-americans-smoking-decreases-income-increases.aspx.
[18] Lincoln Institute of Land Policy and George Washington Institute of Public Policy, Significant Features of the Property Tax, available at http://www.lincolninst.edu/subcenters/significant-features-property-tax/Report_ResidentialRelief.aspx
[19] KPMG Peat Marwick, A Study of the New Hampshire State and Local Revenue Structure, February 13, 1992, p. ii.