While the final state of New Hampshire’s finances for FY 2016 will not be known for a few more months, the latest information on revenue collections provides an optimistic sign.
On July 5, the Department of Administrative Services released its last monthly Revenue Focus for the recently completed fiscal year, which ended June 30. After a solid FY 2015, collections grew by 5.7 percent in FY 2016 (excluding tax amnesty receipts). Unrestricted revenue for the General and Education Funds received during the entire fiscal year totaled $2.39 billion, which was nearly $100 million above what policymakers expected these two funds to collect. While the General and Education Funds have nearly 20 streams of revenue, combined business taxes did most of the heavy lifting, as collectively they received $75 million more than anticipated.
Yet, despite a much healthier and growing economy, the circumstances faced by some of our residents is not as favorable as one might expect. Below are some takeaways from the revenue results and recent economic data.
The General and Education Funds will likely experience a surplus in FY 2017.
According to the surplus statement for the General and Education Funds, budget writers planned for these two funds to receive approximately $2.32 billion in FY 2017. Given that revenues have been rising over the past few years in conjunction with the current stability in the New Hampshire economy, it is extremely likely that the state will receive at the very least the same amount it collected in FY 2016, $2.39 billion or close to $70 million above plan in FY 2017.
A second round of business tax rate reductions is virtually set in stone.
As part of a budget deal reached between Governor Hassan and state legislators last September, the statutory rates of the business profits tax and business enterprise tax were reduced from 8.5 percent to 8.2 percent and from 0.75 percent to 0.72 percent respectively. Also, under the law, if the General and Education Funds collect at least $4.64 billion over the FY 2016-2017 biennium, as reported in the state’s audited comprehensive annual report, then the business profits tax rate will drop to 7.9 percent, while the business enterprise tax rate will be lowered to .675 percent. If this comes to fruition, the reduced rates will go into effect for tax year 2018.
As mentioned, revenue for the General and Education Funds totaled $2.39 billion in FY 2016. While this number is subject to minor revisions, it implies that these two funds only need to collect roughly $2.25 billion in FY 2017 to trigger an additional phase of rate reductions. For context, if this amount was collected, it would represent a nearly 6 percent reduction in collections from FY 2016. A measurable decline in collections is highly unlikely given the recent trend in revenues as well as the current condition of the New Hampshire economy. Consequently, outside of an enormous and unforeseen negative shock to the economy, further business tax cuts are a fait accompli.
From one angle, the New Hampshire economy is in great shape. Yet, at the same time there are some troubling symptoms.
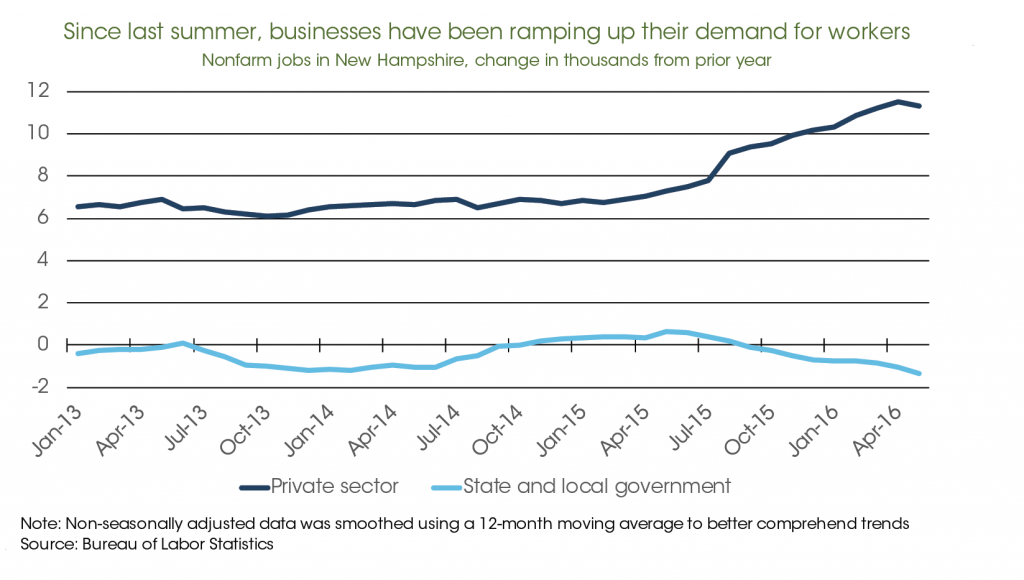
A first pass at standard economic indicators suggests that the New Hampshire economy is faring quite well. The charts below illustrate this more fully. The first graph shows that there seems to have been an inflection point last summer for private employers, who are adding workers to their payrolls at a solid pace.
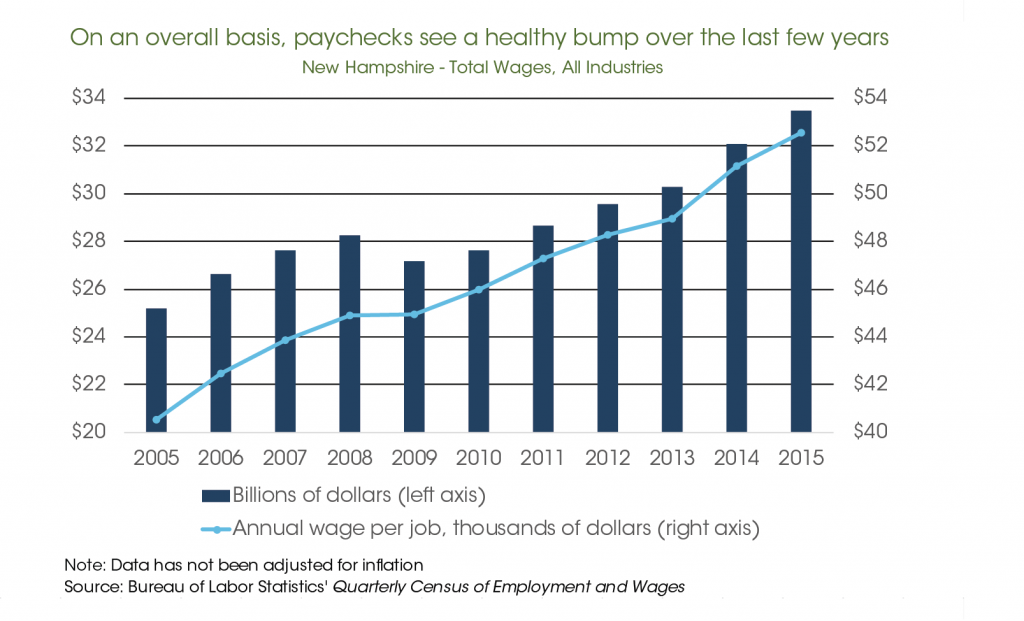
Second, Granite State employers, as a whole, have been paying out more to their employees in the form of wages. This sounds reasonable given that employers, outside of the public sector, have been adding more and more employees. However, one could argue that while the total is growing, each employed person might be receiving the same amount or even less. At first glance, that does not seem to be the case, as New Hampshire’s average annual wage or annual wage per job has been steadily rising.
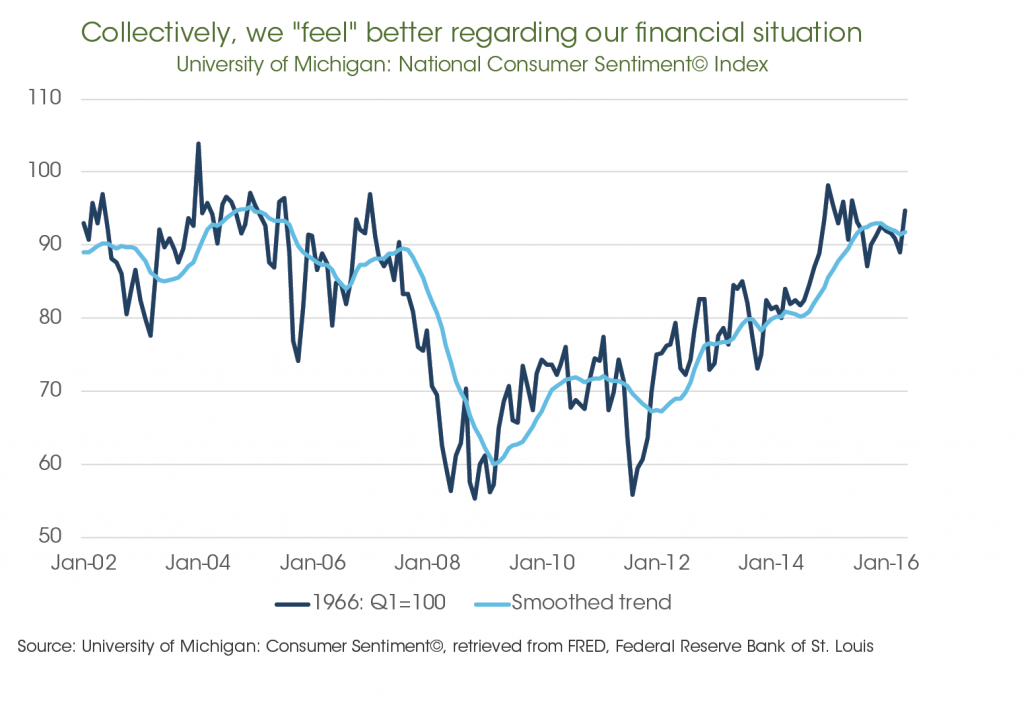
Third, while there is no New Hampshire measure of consumer confidence, households across the country in general feel much more confident about their financial situation and the economy than they did a few years ago. How households feel is important, because their psyche is often crucial to decisions they make to spend on consumer items or take another job. The combination of larger paychecks and more consumer confidence is manifesting itself in the Granite State, through higher revenue collections in the real estate transfer tax and the meals and rooms tax. Furthermore, according to the New Hampshire Automobile Dealers, automobile sales are their strongest in over a decade.
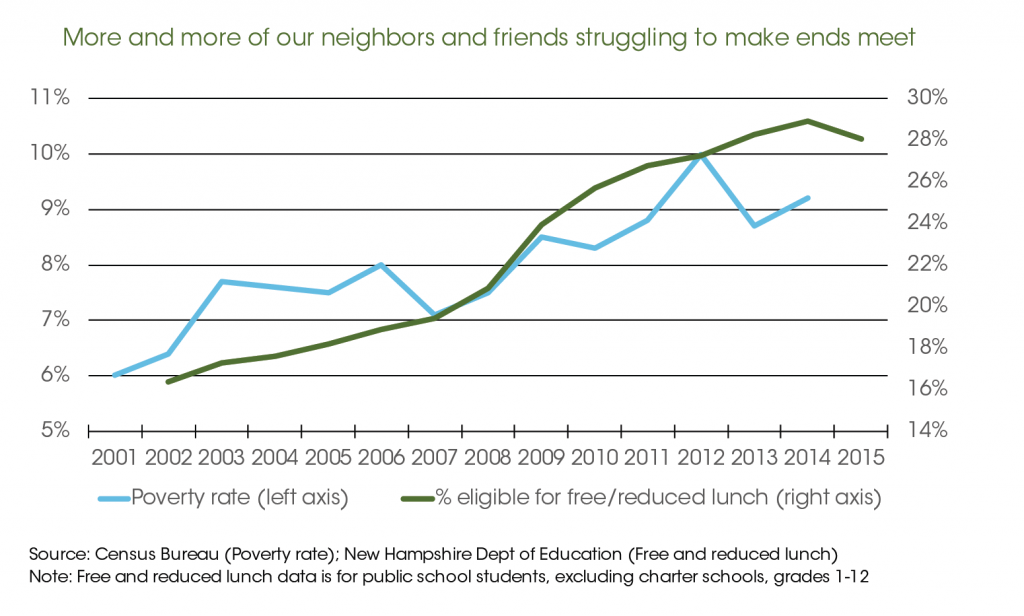
Yet, despite this evidence, there are other data points that appear at odds with this rosy picture. Whether you look at New Hampshire’s poverty rate or the share of public school children eligible for free or reduced school lunches, the data clearly suggest that more households are struggling to provide the basics.
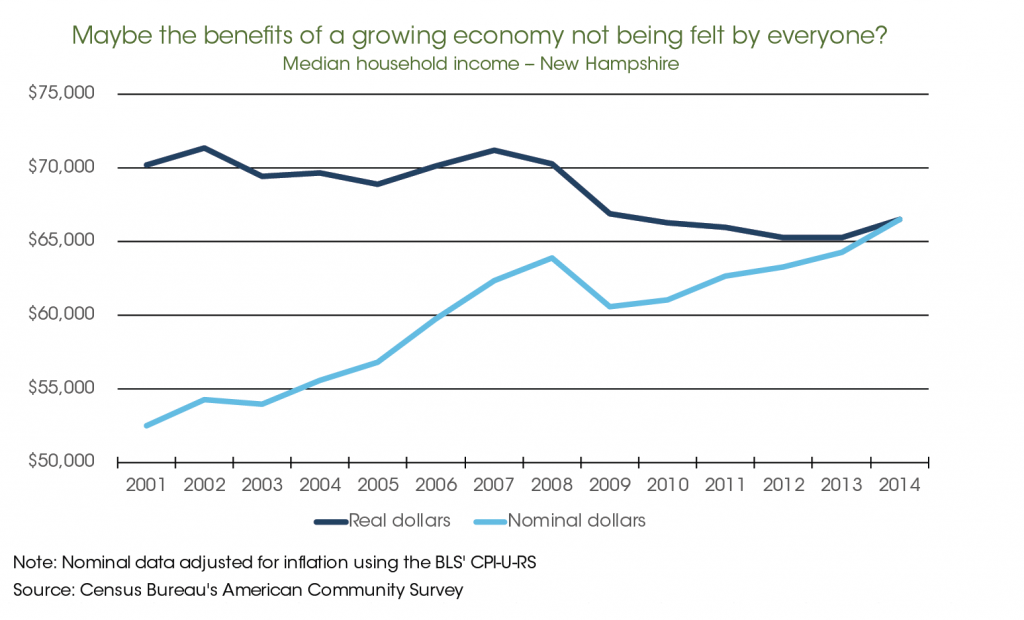
Additionally, median household income has not recovered from the damage done by the Great Recession. The graph below depicts median household income, both unadjusted (nominal dollars) and adjusted (real dollars) for the effects of inflation. In doing economic analysis, accounting for inflation is key because it helps determine if households are able to maintain their purchasing power or, put differently, buy the same basket of goods and services that they have been buying previously.
When accounting for inflation, the purchasing power of the bottom 50 percent of New Hampshire households has fallen. Now, it is unlikely that those households in the bottom 50 percent in 2007 are the exact same households in the bottom 50 percent today. It’s plausible that younger households who started their careers in 2007 have gained work experience and seen some career progression. Nevertheless, it is troubling that collectively the bottom half of households cannot purchase as much as they could seven years ago.
Finally, there appears to be a contradiction in the data presented on the fortunes of the “typical” New Hampshire worker. On one hand, the data clearly shows that the average wage per job is growing steadily. However, on the other hand, the data shows that the median household has seen a decline in their income. What gives? Well, the disconnect stems from the fact that the average of anything assumes everyone gets an equal slice, which is often far from reality, and the average is prone to distortion by outliers or abnormal observations. For example, if we calculated the average of the following annual salaries…
$30,000, $35,000, and $50,000
…we would get $38,333, which does a decent job at reflecting what a “typical” person in this group earns. However, if you add someone who makes $1 million to this group, the average becomes $279,000, which represents none of these people very well. Why does this happen? Because by its very nature, the average can be heavily skewed, in this case by the fortunes of a very wealthy person. Consequently, the fact that the average pay per job in New Hampshire is steadily climbing says little about whether most people are experiencing more prosperity. On the other hand, the median is not subject to these distortions and can usually provide a better pulse on the fortunes of the middle class.

