Estimates from the U.S. Census Bureau’s annual American Community Survey provide insights into the economic conditions of New Hampshire residents. Estimates released in December 2019 average responses over the five-year period, from 2014 to 2018, which allows for more certainty among smaller population groups than annual data alone.
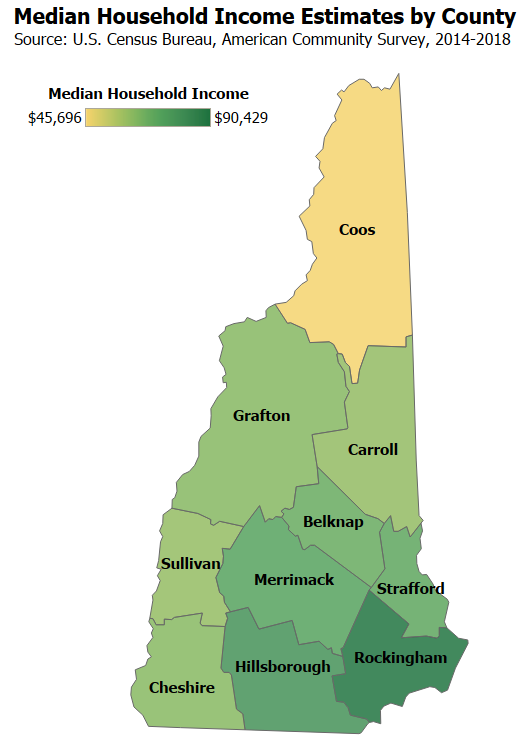
Median Household Income by County
Median household income varies considerably within New Hampshire, and is in part driven by distance from the Boston metropolitan area. Rockingham County’s estimated annual median household income for the 2014 to 2018 period was approximately $90,400 in inflation-adjusted 2018 dollars, which was about $11,800 per year greater than the next highest income county, Hillsborough County. Coos County had the lowest estimated median household income during this period at approximately $45,700, which was about $15,100 less than that of Sullivan County, the second lowest county estimate, and only about half of Rockingham County’s median household income.
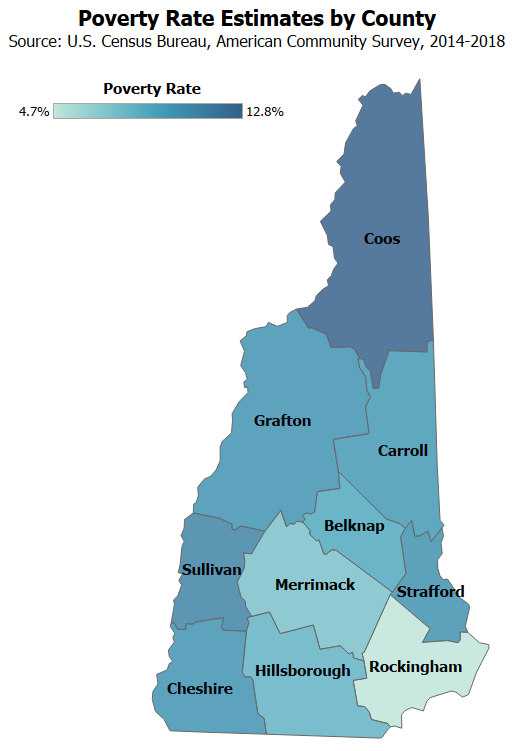
Poverty Rates by County
Using county-level data, the concentration of poverty generally increases as distance from the more urban, southeastern portions of the state increases. In 2018, an individual less than 65 years old and earning less than $13,064 was in poverty; poverty-level income for a family of three, with one child, was less than $20,212. Rockingham County had the lowest poverty rate in the state at 4.7 percent. While all other county estimates were statistically indistinguishable from at least one other county estimate, the highest estimated poverty rate was 12.8 percent, in Coos County. Estimates of poverty for those under 18 years of age were spread more widely, with nearly one in five children in Coos County estimated to be living in poverty, compared to one in 15 children in Rockingham County. Estimates of poverty for those aged 65 years or more ranged from about one in 22 in Merrimack County to one in 11 in Coos County, with Coos County only statistically indistinguishable from Cheshire County and higher than all other counties. Females were more likely to be in poverty than males in the state’s four most populous counties.
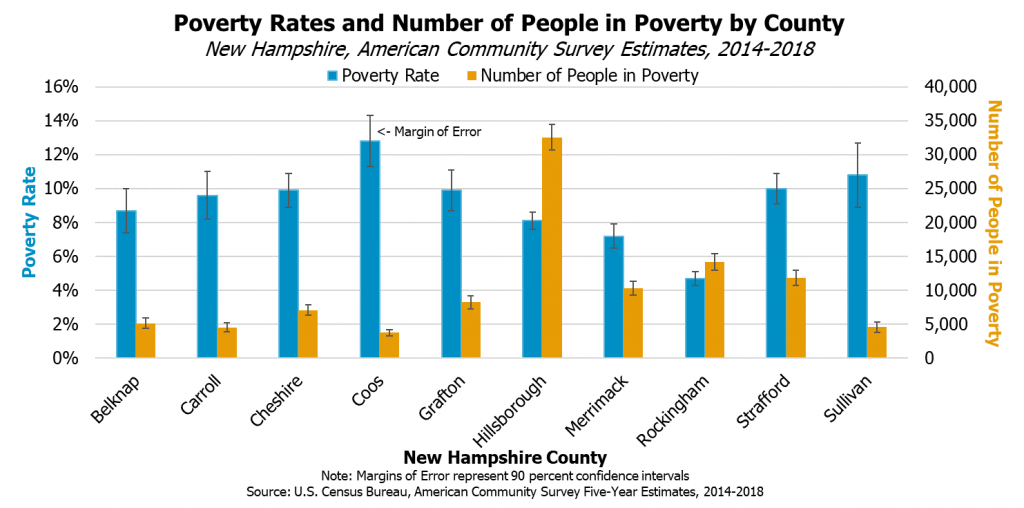
Differing county poverty rates, however, do not necessarily reflect the number of people in poverty in these areas. While Rockingham County has the lowest poverty rate in New Hampshire, this county is estimated to be home to the second-largest number of people in poverty, about 14,200, relative to other counties in the state. Hillsborough County was home to an estimated 32,600 people living at or below poverty-level incomes, the highest county-level estimate in the state.
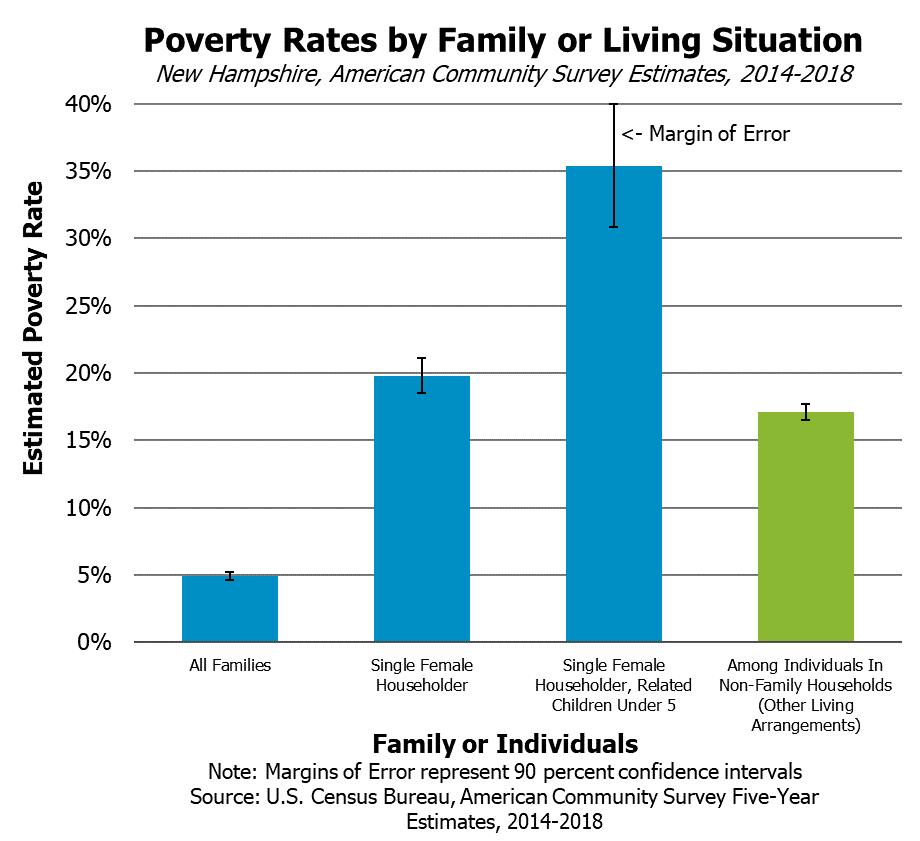
Statewide Demographic and Family Groups
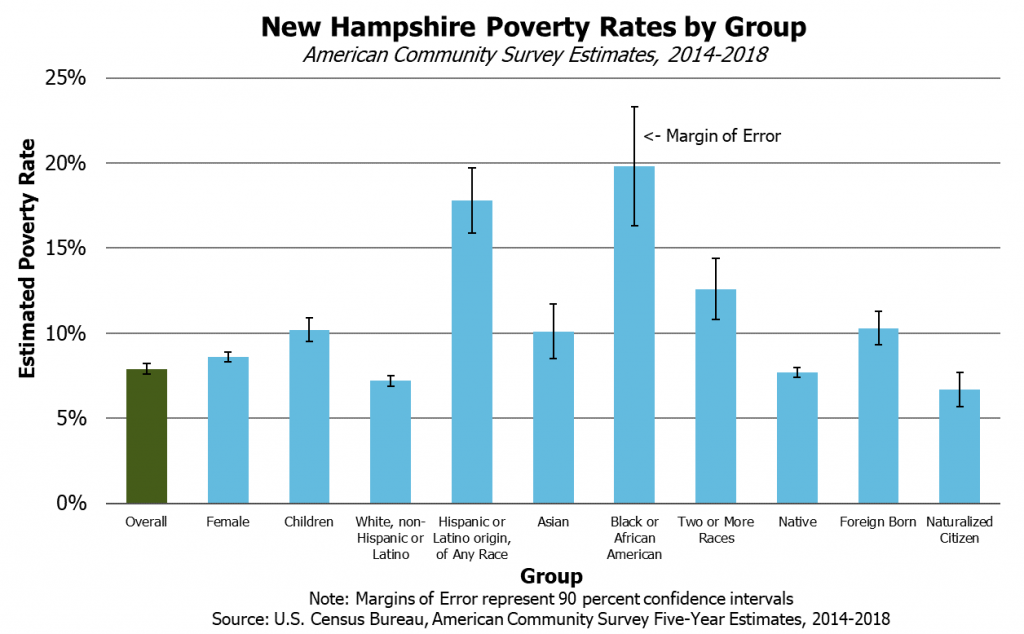
Certain groups are more likely to face economic hardships than other populations. Among racial or ethnic groups, non-Hispanic whites were the least likely to be in poverty from 2014 to 2018 in New Hampshire, while other groups faced higher poverty rates. Approximately one out of every five black or African-American Granite Staters were in poverty, while about one of every six Hispanic or Latino residents were in poverty. Individuals who were female, under age 18, or foreign born also faced higher poverty rates than the overall population.
Different family compositions faced different poverty rates as well. Families with single female householders were more likely to be in poverty than families overall. Roughly one out of three of these families with a child under five years old live in poverty. Individuals in non-family households also faced relatively higher poverty rates.