This second edition of New Hampshire Policy Points provides an overview of the Granite State and the people who call New Hampshire home. It focuses in on some of the issues that are most important to supporting thriving lives and livelihoods for New Hampshire’s residents. Moreover, the book addresses areas of key policy investments that will help ensure greater well-being for all Granite Staters and a more equitable, inclusive, and prosperous New Hampshire.
New Hampshire Policy Points is intended to provide an informative and accessible resource to policymakers and the general public alike, highlighting areas of key concerns. Touching on some important points but by no means comprehensive, each section within New Hampshire Policy Points includes the most up-to-date information available on each topic area. The facts and figures included within this book provide useful information and references for anyone interested in learning about New Hampshire and contributing to making the Granite State a better place for everyone to call home.
To purchase a print copy or download a free digital PDF of New Hampshire Policy Points, visit nhfpi.org/nhpp

Population Changes
As of July 1, 2023, the U.S. Census Bureau estimated a total Granite State population of 1,402,054 individuals, an increase of about 6.5 percent from the estimated population of 1,316,762 on July 1, 2010.[1]
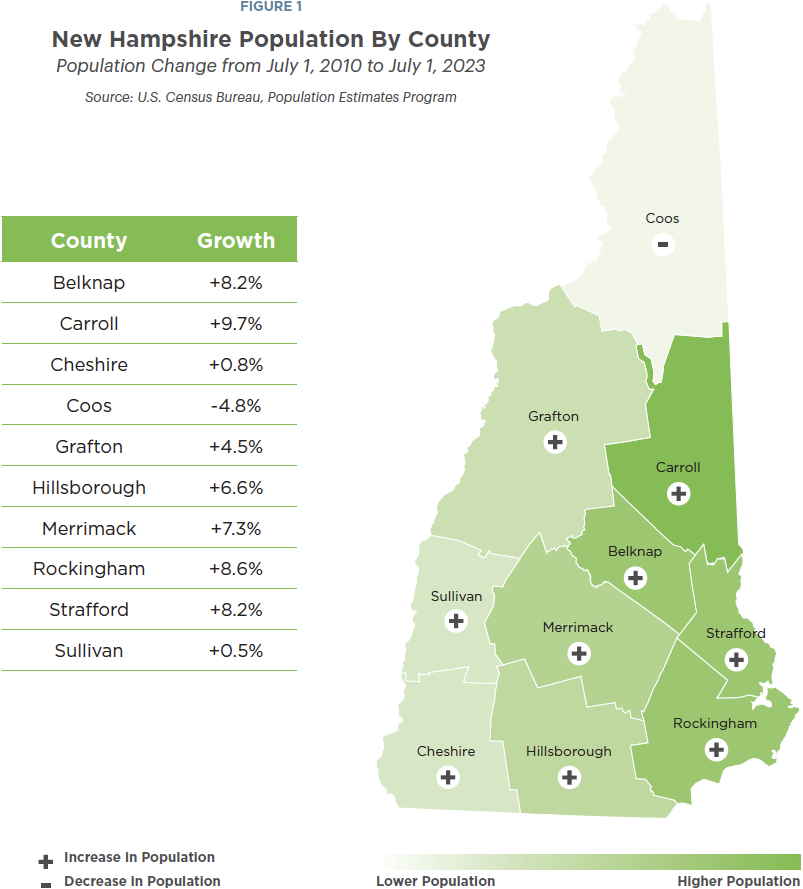
As of July 2023, the most populous counties were Hillsborough (427,354), Rockingham (320,689), and Merrimack (157,103), and the least populous counties were Coos (31,372), Sullivan (43,969), and Carroll (52,448). From July 1, 2010 to July 1, 2023, all counties, except Coos County, experienced an increase in their populations, ranging from Sullivan’s 0.5 percent to Carroll’s 9.7 percent.[2]
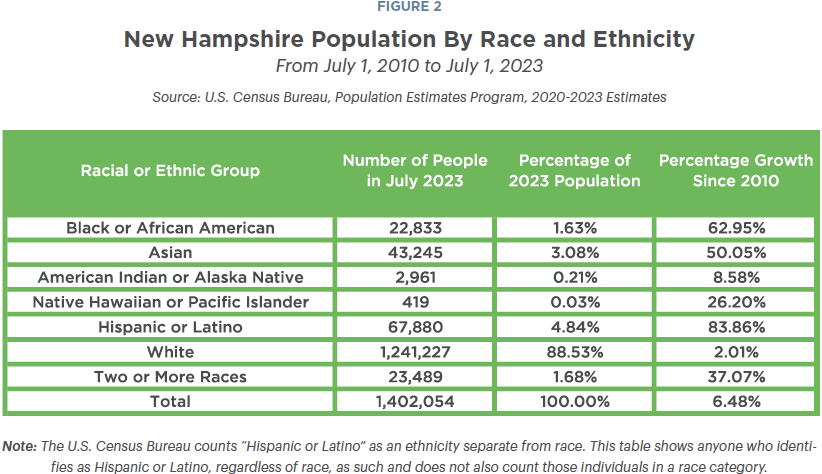
Based on population estimates from July 2023, the majority of the state’s population identified as both white and non-Hispanic, comprising about 88.5 percent of the total population. While those who identified with a racial or ethnic minority group made up smaller percentages of the population, the number of individuals identifying as such has increased rapidly since July 2010. Those who identified as Hispanic or Latino, regardless of racial identity, experienced the largest increase in terms of the percentage of the population from 2010, increasing about 83.9 percent from 2010 to 2023 while still representing a relatively small 4.8 percent of the population. Granite Staters identifying as Black or African American and non-Hispanic experienced the second largest increase, about 63.0 percent from 2010 to 2023 and increased to about 1.6 percent of the state’s population.[3]
New Hampshire's Age Structure
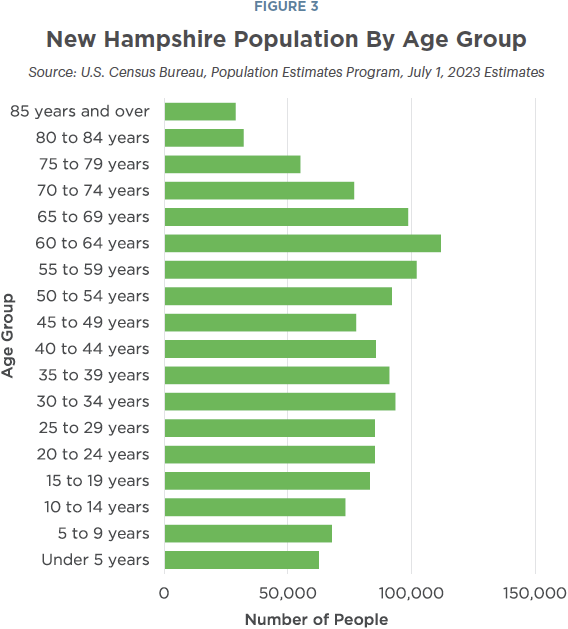
More New Hampshire residents will be reaching traditional retirement ages in the coming decade. As of July 2023, the median age in New Hampshire was 43.4 years old, making the state tied with Vermont as the second-oldest state in the United States, and behind only Maine (44.8 years), in median age. Based on population estimates from July 2023, approximately 20.8 percent (291,526 adults) of Granite Staters were over the age of 65, which was an increase from about 18.8 percent (259,015 adults) of the state’s population in July 2020. In contrast, those under the age of 18 made up about 18.0 percent (252,050 children) of the population in 2023. The total population of children has decreased since 2020, when children comprised about 18.8 percent (259,269 children) of the state’s population. In addition, a large number of Granite State residents will be reaching traditional retirement ages over the next decade, as about 15.3 percent (213,876 adults) of the state’s population was between the ages of 55 to 64 in 2023.[4]
Although New Hampshire’s population is aging, a significant number of adults under age 65 have moved to the state in recent years. In the 2018 to 2022 timeframe, working age adults comprised about 76.8 percent of the combined total number of individuals who migrated into the state, including both movers from other states and from other countries. This percentage has remained similar to previous years prior to the pandemic. From 2013 to 2017, working age adults comprised about 76.9 percent of those migrating into the state.[5]
International and Domestic Migration
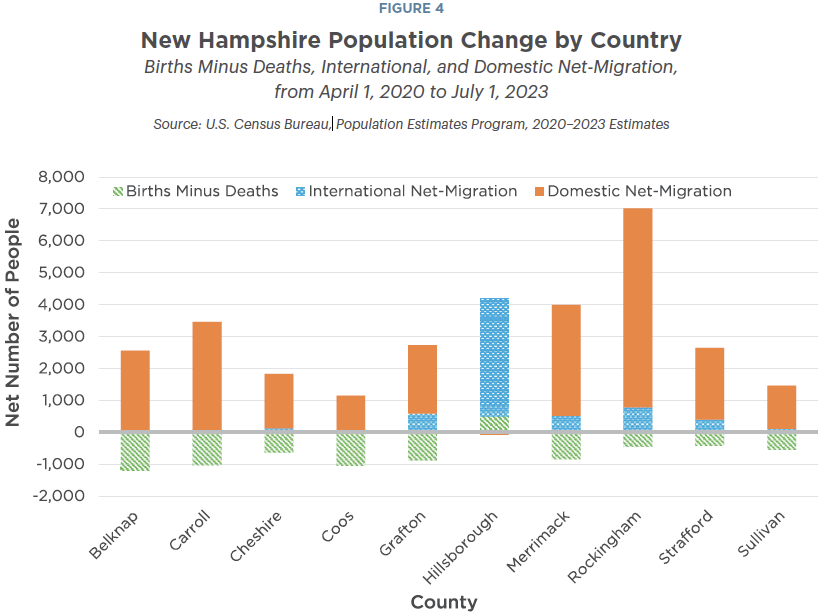
Net migration to New Hampshire was responsible for the entirety of estimated population growth between 2020 and 2023. From April 1, 2020 to July 1, 2023, the state experienced a population change of approximately 24,530 people. During this time period, there were around 39,525 births and 46,128 deaths across the state, contributing to a negative change of about 6,603 people. New Hampshire also experienced a net population gain of around 30,472 people due to migration into the state during the same time period. Around 79.2 percent of the net migration gain was due to migration from other states, while about 20.8 percent was due to international migration.[6]
While domestic and international migration has increased the statewide population, increases due to this migration differed by county. Hillsborough County was the only county to experience a domestic net migration loss from April 1, 2020 to July 1, 2023; however, the county also experienced the largest international net increase during this time, and it was the only county in the state to have more births than deaths among its residents. Rockingham County and Merrimack County, two other populous counties that include southeastern parts of the state, experienced the largest net increases in the number of people migrating into the state during this time; Coos County and Sullivan County experienced the smallest net population increases from migration.[7]
Implications for the Future
New Hampshire’s population is growing solely due to migration and is becoming more diverse. The population of those identifying as white and non-Hispanic increased by 2 percent between 2010 and 2023, while the number of people identifying as a member of a racial or ethnic minority group in New Hampshire grew by 61 percent. About 20.2 percent of New Hampshire’s children identified as being from a race or ethnicity other than white and non-Hispanic in 2020.
New Hampshire’s child population overall has been declining, which suggests potential challenges for the state’s economic future. While the child population overall declined from 2010 to 2020, the number of children of color grew in the state, suggesting the state’s workforce and economy will become more diverse. The median age of New Hampshire’s overall population, however, continues to be among the highest of the 50 U.S. states.
According to age projections published by the New Hampshire Department of Business and Economic Affairs, the working-age population, or those aged 15 to 64, is expected to decrease by 2050. Further, the percentage of the population over the age of 65 is expected to continue to increase until 2050.[8]
These shifting demographic trends have important implications for the future of New Hampshire, as fewer working adults are available for the state’s workforce, and care for older adults will likely require additional investments.
• • •
This publication and its conclusions are based on independent research and analysis conducted by NHFPI. Please email us at info@nhfpi.org with any inquiries or when using or citing New Hampshire Policy Points in any forthcoming publications.
© New Hampshire Fiscal Policy Institute, 2024.
Endnotes
[1] See the U.S. Census Bureau’s Population Estimates Tables, State Population Totals: 2010-2019 and State Population Totals: 2020-2023. Note: The Decennial Census count taken in 2020 created a new April 1, 2020 population baseline for U.S. Census Bureau annual estimates, which may explain part of the faster population increase between the 2019 and 2020 estimates.
[2] See the U.S. Census Bureau’s Population Estimates Tables, County Population Totals: 2020-2023.
[3] See the U.S. Census Bureau’s Population Estimates Tables, State Population by Characteristics: 2020-2023, Sex, Race, and Hispanic Origin. Note: The U.S. Census Bureau defines race and ethnicity separately, using 1997 standards from the U.S. Office of Management and Budget. For ethnicity, “Hispanic or Latino” is defined as “a person of Cuban, Mexican, Puerto Rican, South or Central American, or other Spanish culture or origin regardless of race.”
[4] See the U.S. Census Bureau’s Population Estimates Tables, State Population by Characteristics: 2020-2023, Median Age and Age by Sex.
[5] See the U.S. Census Bureau’s Microdata Access Tool, 5-year Estimates for 2022 and 2017. Data was assessed using multiple variables: mobility status, migration, and age recode by group.
[6] See the U.S. Census Bureau’s Population Estimates Tables, State Population Components of Change: 2020-2023.
[7] See the U.S. Census Bureau’s Population Estimates Tables, County Population Components of Change: 2020-2023.
[8] See the New Hampshire Department of Business and Economic Affairs’ September 2022 report, State, County, and Municipal Population Projections: 2020-2050, page 52.